The Mesotherapy Market is estimated to be valued at USD 251.1 million in 2025 and is projected to reach USD 1259.7 million by 2035, registering a compound annual growth rate (CAGR) of 17.5% over the forecast period.
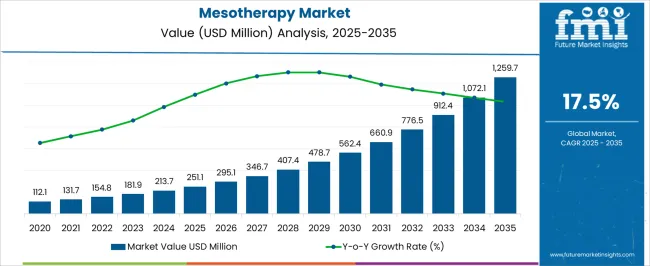
| Metric | Value |
|---|---|
| Mesotherapy Market Estimated Value in (2025 E) | USD 251.1 million |
| Mesotherapy Market Forecast Value in (2035 F) | USD 1259.7 million |
| Forecast CAGR (2025 to 2035) | 17.5% |
The mesotherapy market is witnessing steady growth as advancements in cosmetic procedures and rising consumer focus on minimally invasive treatments converge. Increasing awareness about skin health and the desire for aesthetic enhancements are driving demand across various demographic groups.
Industry observations indicate that innovations in solution formulations and delivery techniques are expanding treatment efficacy, further encouraging adoption. The proliferation of dermatology and cosmetic clinics equipped to offer specialized services is also supporting market expansion.
Regulatory environments favorable to non-surgical cosmetic interventions coupled with growing disposable incomes in urban centers contribute to sustained market momentum. Future growth prospects are anticipated to be strengthened by the integration of digital diagnostics, rising male consumer base, and expansion of treatment indications beyond traditional aesthetic applications.
The market is segmented by Type, Application, and End-use and region. By Type, the market is divided into Solutions, Masks, Creams, Devices, and Other Types. In terms of Application, the market is classified into Anti-aging, Facial Rejuvenation, Stretch Marks, Acne & Scar Treatment, Fat Loss, Hair Loss, and Other Applications. Based on End-use, the market is segmented into Dermatology & Cosmetic Clinics, Hospitals, and Other End-uses. Regionally, the market is classified into North America, Latin America, Western Europe, Eastern Europe, Balkan & Baltic Countries, Russia & Belarus, Central Asia, East Asia, South Asia & Pacific, and the Middle East & Africa.
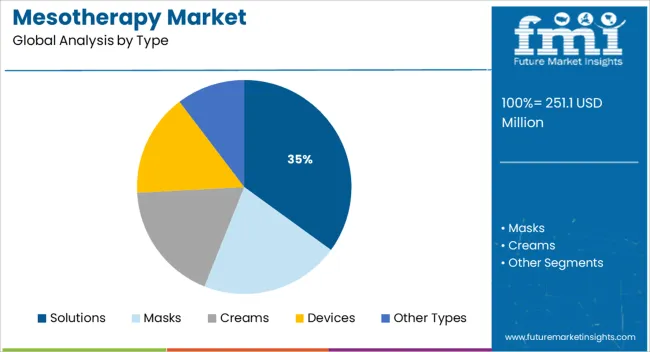
When segmented by type the solutions segment is expected to hold 35.0% of the total market revenue in 2025 establishing it as a leading category. This dominance can be attributed to continuous innovation in bioactive compounds and delivery mechanisms that enhance therapeutic outcomes.
The ability of solutions to target multiple concerns such as hydration, pigmentation, and collagen stimulation simultaneously has made them highly preferred among practitioners. Furthermore investment in research and development to improve biocompatibility and minimize adverse reactions has reinforced confidence in solution-based treatments.
Clinics and dermatologists benefit from the versatility of these solutions which allow customization per patient requirement driving their widespread use. Operational efficiencies in formulation and ease of administration have further accelerated adoption positioning this segment at the forefront of the market.
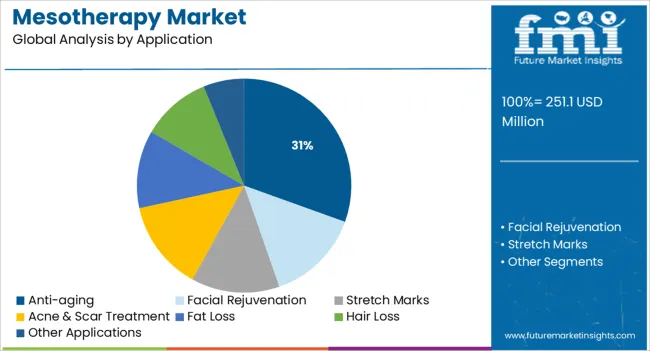
Segmented by application the anti-aging segment is projected to account for 30.5% of the market revenue share in 2025 ranking it as a top use case. This position has been driven by the increasing demand for non-invasive treatments aimed at reducing wrinkles fine lines and improving skin elasticity.
The growing aging population coupled with rising consumer preference for natural and gradual rejuvenation solutions has expanded the target audience. Clinics have widely adopted anti-aging mesotherapy protocols due to their proven efficacy and minimal downtime enhancing patient satisfaction.
Innovations in peptide complexes and vitamin-enriched formulations have further elevated the appeal of anti-aging applications. The segment’s growth is also supported by increasing awareness campaigns and social media influence which boost consumer interest and acceptance of these treatments.
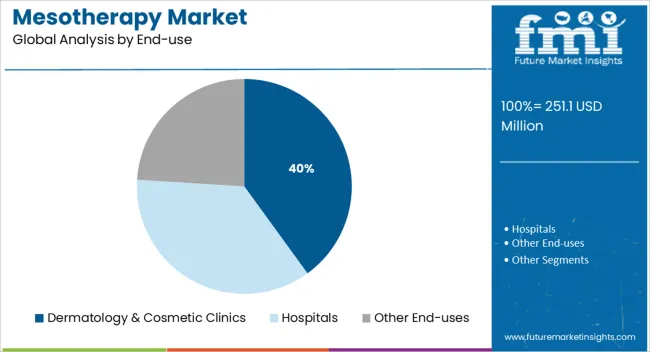
When segmented by end use the dermatology and cosmetic clinics segment is forecast to hold 40.0% of the total market revenue in 2025 securing its position as the dominant channel. This leadership is driven by clinics’ ability to offer specialized expertise advanced equipment and personalized treatment plans.
Dermatologists and cosmetic specialists have increasingly incorporated mesotherapy into their service portfolios as a complement or alternative to more invasive procedures. The segment benefits from strong patient trust and repeat treatment potential which supports revenue stability.
Investments in staff training and technological upgrades have improved treatment outcomes and patient experiences. Furthermore clinics’ strategic focus on holistic skin health solutions and growing acceptance of cosmetic treatments in emerging markets have contributed to the segment’s sustained growth and market prominence.
As per the Mesotherapy Market research by Future Market Insights - a market research and competitive intelligence provider, historically, from 2020 to 2024, the market value of the Mesotherapy Market increased at around 14.3% CAGR. With an absolute dollar opportunity of USD 251.1 Million from 2025 to 2035, the market in the country is expected to reach a valuation of USD 1259.7 Million by 2035.
The mesotherapy industry is rapidly being affected by Mesotherapy Solutions in an effort to encourage patient participation in their sector to gather data. The market for analytics data concerning patient welfare is slowly being stimulated by the growing demand for consumer analysis.
Some of the factors driving market expansion include the rising popularity of mesotherapy amongst some of the middle-aged population who are self-conscious about their appearance. As a result, the expanding number of aesthetic clinics offering mesotherapy treatments is projected to increase demand for mesotherapy. Furthermore, increased medical tourism for aesthetic operations is adding to the market's expansion.
The therapy is increasingly being employed for skin rejuvenation operations in both developing and developed countries. Consumers have a vast range of mesotherapy products to choose from, including peels, solutions, lotions, masks, and dermal fillers. The advantages of mesotherapy, such as its minimally invasive character, cost-effectiveness, and ease of product availability, are key factors driving the growth of the mesotherapy market.
Being non-invasive and comparatively low cost of treatment are the main reasons for the Mesotherapy market growth. The number of competent and licensed professionals in dermatology clinics around the world has been increasing. The developments in the number of mesotherapy institutes and the efforts of the International Society of Mesotherapy to cultivate acceptable mesotherapy practice have positively impacted the quality of mesotherapy and benefited the market in recent years.
The rise in cosmetic treatment adoption, mind fashion sense among the middle-aged population, and an increase in the number of cosmetic centers offering mesotherapy are likely to fuel market expansion. The technique is painless and takes less time, and it is expected to assist replace more difficult skin rejuvenation processes, creating new prospects for the worldwide mesotherapy market. Mesotherapy is regarded as a relatively recent type of skin treatment.
In 2024, North America held the largest share of the global Mesotherapy Market with a CAGR of 14.3%. The market in the region has been impacted owing to the growing middle-aged population who are worried about their looks and a rise in the number of beauty clinics providing mesotherapy solutions.
Due to the growing mesotherapy expenditure of South Korea, Japan, and China and factors such as the growing geriatric population, Asia Pacific is projected to grow at the fastest rate throughout the projection period.
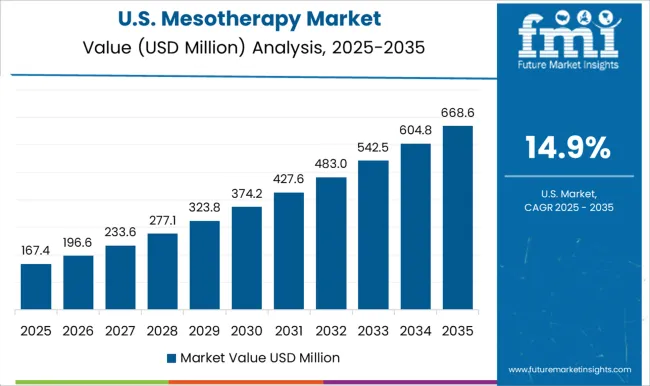
The United States is expected to account for the largest market of USD 1259.7 million by the end of 2035. Rising consumer disposable incomes, as well as increased care about aesthetic appearance, have been leading to market growth. Furthermore, increased age concerns, changing climatic circumstances, changes in lifestyle, and stress are all contributing to an increase in demand for mesotherapy. Furthermore, the manufacturing businesses' extensive distribution network has enabled mesotherapy products’ availability throughout the globe. Besides, rising media and internet saturation have raised product awareness, expertise, and ease of access.
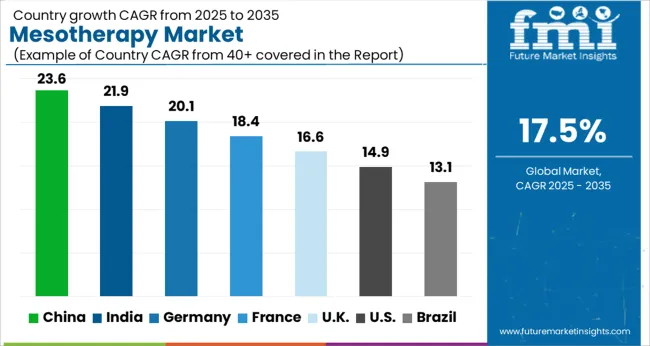
The market for mesotherapy is expected to reach a valuation of USD 53.7 Million by 2035. Growing at a CAGR of 18.9% from 2025 to 2035, the market in the country is projected to gross an absolute dollar opportunity of USD 44.2 Million.
The market in China is expected to register USD 77 Million by 2035 at a CAGR of 15.7% from 2025 to 2035. During the forecast period, the market in the country is expected to gross an absolute dollar opportunity of USD 59 Million.
In Japan, the market is expected to garner a market of USD 30.3 Million by 2035. With a projected CAGR of 17%, the market in the country is expected to gross an absolute dollar opportunity of USD 24 Million during the forecast period.
The market in South Korea is projected to garner an absolute dollar opportunity of USD 251.1 Million from 2025 to 2035. With a CAGR of 16.2% from 2025 to 2035, the market in the country is projected to garner an absolute dollar opportunity of USD 251.1 Million.
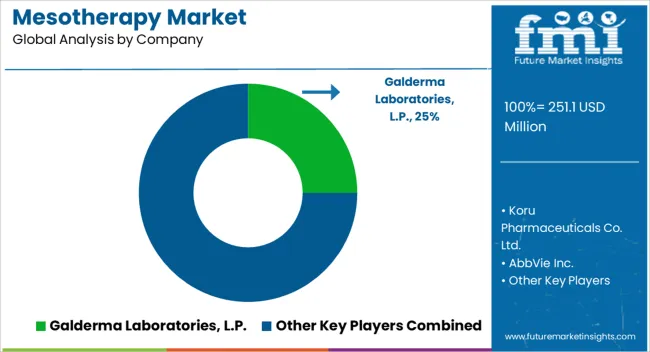
Some of the key companies operating in the mesotherapy market include Koru Pharmaceuticals Co. Ltd., AbbVie Inc., Galderma Laboratories, L.P., Mesoskinline, Institute BCN, Fusion Meso, and Mesoestetic.
Some of the recent developments of key mesotherapy providers are as follows:
Similarly, recent developments related to companies in the Mesotherapy Services have been tracked by the team at Future Market Insights, which are available in the full report.
The global mesotherapy market is estimated to be valued at USD 251.1 million in 2025.
The market size for the mesotherapy market is projected to reach USD 1,259.7 million by 2035.
The mesotherapy market is expected to grow at a 17.5% CAGR between 2025 and 2035.
The key product types in mesotherapy market are solutions, masks, creams, devices and other types.
In terms of application, anti-aging segment to command 30.5% share in the mesotherapy market in 2025.


Our Research Products

The "Full Research Suite" delivers actionable market intel, deep dives on markets or technologies, so clients act faster, cut risk, and unlock growth.

The Leaderboard benchmarks and ranks top vendors, classifying them as Established Leaders, Leading Challengers, or Disruptors & Challengers.

Locates where complements amplify value and substitutes erode it, forecasting net impact by horizon

We deliver granular, decision-grade intel: market sizing, 5-year forecasts, pricing, adoption, usage, revenue, and operational KPIs—plus competitor tracking, regulation, and value chains—across 60 countries broadly.

Spot the shifts before they hit your P&L. We track inflection points, adoption curves, pricing moves, and ecosystem plays to show where demand is heading, why it is changing, and what to do next across high-growth markets and disruptive tech

Real-time reads of user behavior. We track shifting priorities, perceptions of today’s and next-gen services, and provider experience, then pace how fast tech moves from trial to adoption, blending buyer, consumer, and channel inputs with social signals (#WhySwitch, #UX).

Partner with our analyst team to build a custom report designed around your business priorities. From analysing market trends to assessing competitors or crafting bespoke datasets, we tailor insights to your needs.
Supplier Intelligence
Discovery & Profiling
Capacity & Footprint
Performance & Risk
Compliance & Governance
Commercial Readiness
Who Supplies Whom
Scorecards & Shortlists
Playbooks & Docs
Category Intelligence
Definition & Scope
Demand & Use Cases
Cost Drivers
Market Structure
Supply Chain Map
Trade & Policy
Operating Norms
Deliverables
Buyer Intelligence
Account Basics
Spend & Scope
Procurement Model
Vendor Requirements
Terms & Policies
Entry Strategy
Pain Points & Triggers
Outputs
Pricing Analysis
Benchmarks
Trends
Should-Cost
Indexation
Landed Cost
Commercial Terms
Deliverables
Brand Analysis
Positioning & Value Prop
Share & Presence
Customer Evidence
Go-to-Market
Digital & Reputation
Compliance & Trust
KPIs & Gaps
Outputs
Full Research Suite comprises of:
Market outlook & trends analysis
Interviews & case studies
Strategic recommendations
Vendor profiles & capabilities analysis
5-year forecasts
8 regions and 60+ country-level data splits
Market segment data splits
12 months of continuous data updates
DELIVERED AS:
PDF EXCEL ONLINE

Thank you!
You will receive an email from our Business Development Manager. Please be sure to check your SPAM/JUNK folder too.
Chat With
MaRIA