Anti-Aging Products Services and Devices Market
Market Survey on Anti-Aging Products Services and Devices Market Covering Sales Outlook, Up-to-date Key Trends, Market Size and Forecast, Per Capita Expenditure, Company Share, Brand Share, Regulations, Reimbursement Scenario, Epidemiology, Procedure Numbers, and Pipeline Assessment
An In-depth Market Insights of Anti-Aging Products Services and Devices Market including Creams, Moisturizers, Retinols, Dermal Fillers, Botulinum Toxin, Chemical Peels, Cellulite Treatment, and Non-Surgical Fat Reduction Covering 30+ Countries like United States, United Kingdom, Germany, France, Norway, Sweden, Saudi Arabia, United Arab Emirates, Japan, Korea, Australia, New Zealand, and Others
Anti-aging Products Services and Devices Market Outlook (2023 to 2033)
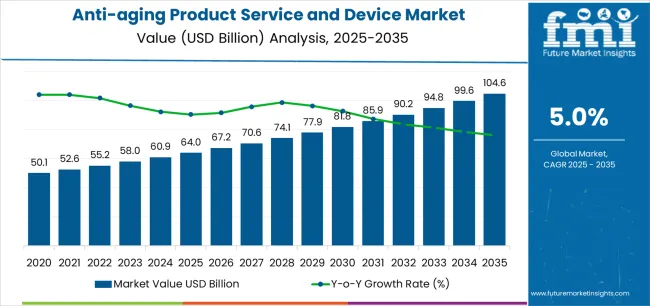
Demand for anti-aging products services and devices is set to rise at 5.5% CAGR between 2023 and 2033. In 2022, the global anti-aging products services, and devices market was estimated to be worth about US$ 59 billion. Future Market Insights (FMI) forecasts revenue growth of the anti-aging market is expected to grow from US$ 64.0 billion in 2023 to US$ 109.8 billion by 2033.
People nowadays are putting a lot of focus on looking young, and the worldwide cosmetics and skincare market is fully using this aspect. Several end-usage of anti-aging products services and devices is creating demand among consumers, both young and old, owing to their increased self-awareness regarding their physical appearance.
Although aging is a physiological phenomenon, it is observed that external variables like air pollution, exposure to harmful UV rays, and alcohol consumption harm skin cells and contribute to premature aging. By helping to maintain moisture and a young glow, anti-aging creams and lotions are essential in a person's life.
The most widely used category of anti-aging products is sunscreen since it shields the skin from damaging UV radiation, delaying the appearance of wrinkles and discoloration. Brands operating in the sun care market are providing paraben-free anti-aging skincare products to meet the mounting demand, expanding the sun care industry size.
One major factor driving the anti-aging market expansion is the expanding elderly population. This demographic is becoming more knowledgeable about anti-aging products. Due to stringent laws and regulations, there is an increase in the development of safe and effective anti-aging products and services, which is boosting market growth.
The demand consumption of anti-aging market products is also anticipated to increase over the forecast period due to increasing awareness among consumers regarding age-related skin concerns like wrinkles, fine lines, and dullness of skin, in addition to a rising tendency to overspend on products that help them to showcase their youthful skin.
Manufacturers are now concentrating on the effectiveness and quality of their products. This includes increasing funding for research and development initiatives which is likely to result in the creation of novel anti-aging product services and devices, such as breast implants, botulinum toxin injection therapy, plastic surgery, and other long-lasting procedures.
Don't pay for what you don't need
Customize your report by selecting specific countries or regions and save 30%!
Growing Consumer Enthusiasm for Natural Products Generating Opportunities for the Manufacturers
The current shift in customer demand for organic and natural products is a result of the expanding trend toward plant-based substitutes. In this sense, this phenomenon is likely to produce several growth opportunities for anti-aging market manufacturers. They can contribute to revenue growth by providing solutions made with natural components instead of chemicals.
The trend toward natural beauty has also generated the potential for several crossover products formed by manufacturers who hold an enormous skin-lightening market share. For instance, to assist individuals to safeguard their natural skin, they have the combined benefits of cosmetics and wrinkle care.
Anti-aging product formulators are developing front-line technologies and powerful components like sophisticated biotechnology products or synthetic proteins to get a strong foothold in the skincare industry. This is generating a positive outlook scope of anti-aging products services and devices market.
The rising demand for liposuction operations due to social media's impact is likely to spur the market expansion of anti-aging products, services, and technology. Another key growth driver of anti-aging products services and devices creating opportunities in the worldwide cosmetics and skincare market is the increasing penetration of new brands in the beauty care sector.
Attributes |
Details |
Anti-aging Products Services and Devices Market Base Year Value (2022) |
US$ 59 billion |
Anti-aging Products Services and Devices Market Value (2023) |
US$ 64 billion |
Anti-aging Products Services and Devices Market Absolute Dollar Growth (US$ million/billion) |
US$ 45.8 billion |
Anti-aging Products Services and Devices Market Expected Value (2033) |
US$ 109.8 billion |
Anti-aging Products Services and Devices Market Projected CAGR (2023 to 2033) |
5.5% |
Anti-aging Products Services and Devices Market Register Historic Sales Compared to 2023 to 2033 Forecast Outlook
FMI forecasts revenue growth of the anti-aging market is estimated to grow at 5.5% CAGR between 2023 and 2033. Historically, the market value of anti-aging products services, and devices showed reasonable development from 2017 to 2022, with a CAGR of 8.1%.
According to the American Society of Plastic Surgery and International Society of Plastic Surgery (ISPS) 2019, around 2.68 million people underwent soft tissue filler procedures and around 709,413 procedures of microdermabrasion were recorded in 2017.
- Short Term (2023 to 2026): The growth of the anti-aging products services and devices market is likely to be propelled by the rapidly aging and affluent baby boomer population and increasing beauty and health awareness among generation X and Y.
- Medium Term (2026 to 2029): The increasing number of cases of skin cancer and other skin diseases is anticipated to improve the adoption of such procedures and products. Growing penetration of social media and the relentless urge to have younger-looking skin have increased the number of people undergoing anti-wrinkle and anti-cellulite treatment & procedures.
- Long Term (2029 to 2033): Several advanced techniques have been introduced by key players in the anti-aging market, which are likely to fuel market revenues. Increasing demand for clinically-advanced solutions is boosting non-surgical-medical anti-aging cosmetic procedures, creating lucrative growth opportunities for the anti-aging market, especially across the USA, United Kingdom, India, and Germany.
As per Future Market Insights (FMI), the global revenue of the anti-aging products services, and devices market is predicted to reach approximately US$ 109.8 billion by 2033, expanding at a CAGR of over 5.5% during the forecast period.
Historical CAGR (2017 to 2022) |
Forecast CAGR (2023 to 2033) |
8.1% |
5.5% |
Demand for Non-Surgical Anti-aging Procedures Pushing Sales
Non-surgical and minimally invasive anti-aging treatments are gaining wider adoption despite being costlier in certain cases as compared to invasive procedures. The ISAPS statistics reveal that globally highest number of non-surgical anti-aging procedures were adopted by the USA, followed by Brazil, Japan, Italy, Turkey, India, and Mexico.
Top non-surgical anti-aging procedures adopted include photo-rejuvenation, chemical peel, microdermabrasion, dermabrasion, & skin tightening. Also, with the quest of looking young, consumers are increasing the adoption of several cosmetic procedures such as liposuction, tummy tuck, cellulite reduction, and others, which is one of the major factors driving the anti-aging market.
These procedures have improved the manufacturing of anti-aging devices, widening growth opportunities for anti-aging product services, and devices market key players.
As per the data from the American Society of Plastic Surgeons (ASPS) 2019, around 7.44 million procedures were recorded for botulinum toxin type-A, while the chemical peel procedure was recorded around for 1.38 million people in 2017.
Demand for non-invasive and non-surgical procedures is expected to increase over the coming years, fostering the sales of anti-aging products and devices.
Existence of Counterfeit Items Carrying Hazardous Materials Limit Sales
Two major business restraints of the anti-aging products services and devices market are the high expense of anti-aging treatments and cosmetics, as well as the availability of counterfeit goods with harmful components.
Major manufacturers provide a variety of products for various skin issues. Since they are made using unique processing methods and natural components, these items are rather pricey. Due to their rising popularity, several counterfeit companies are developing duplicate products with the same label and design. Customers purchase and use these products while not being aware of the original products' identifying markers. These goods don't work and can even have bad impacts.
The adoption of corrective cosmetic surgery is being hampered by the rising demand for invasive procedures which directly impedes the demand consumption of the anti-aging market. Invasive cosmetic treatments have a shorter recovery time and fewer adverse effects thereafter. This is anticipated to impede the expansion of the anti-aging products, services, and devices market.
The Pharmaceuticals and Cosmetics Act and other regulatory authorities' strict control of anti-aging products, services, and devices are also regarded as a barrier for the skin care industry.
Get the data you need at a Fraction of the cost
Personalize your report by choosing insights you need
and save 40%!
Comparative Analysis of Adjacent Markets
Anti-aging Products Services and Devices Market:
Differentiating Aspects |
Anti-aging Products Services and Devices Market |
CAGR (2023 to 2033) |
5.5% |
Market Valuation in 2023 |
US$ 64 billion |
Projected Market Value in 2033 |
US$ 109.8 billion |
Growth Factors |
Rising adoption of diverse treatments to slow down the aging process |
Opportunities |
Consumer preference for skin resurfacing and rejuvenation treatments |
Key Trends |
Influencer and celebrity endorsement for multipurpose products |
Anti-Pollution Skin Care Market:
Differentiating Aspects |
Anti-Pollution Skin Care Market |
CAGR (2023 to 2033) |
7.4% |
Market Valuation in 2023 |
US$ 8.48 billion |
Projected Market Value in 2033 |
US$ 17.33 billion |
Growth Factors |
Metropolitan regions and urban cities are becoming more polluted. |
Opportunities |
High-end anti-pollution skin care products are also used in dispensaries and beauty clinics. |
Key Trends |
The increasing prevalence of skin disorders like psoriasis and acne is driving up demand for derma cosmetics. |
Skincare Market:
Differentiating Aspects |
Anti-aging Products Services and Devices Market |
CAGR (2023 to 2033) |
5.5% |
Market Valuation in 2023 |
US$ 64 billion |
Projected Market Value in 2033 |
US$ 109.8 billion |
Growth Factors |
Rising adoption of diverse treatments to slow down the aging process |
Opportunities |
Consumer preference for skin resurfacing and rejuvenation treatments |
Key Trends |
Influencer and celebrity endorsement for multipurpose products |
Regional Market Share in Anti-aging Products Services and Devices
Regions | North America |
Countries | United States |
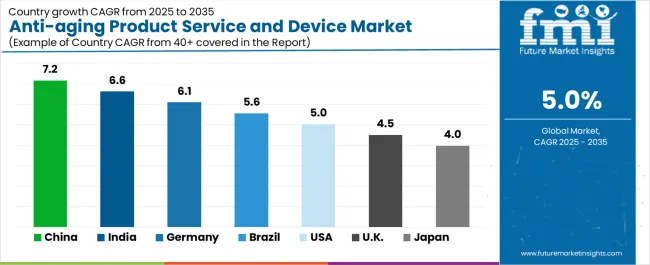
CAGR (2023 to 2033) | 5.6% |
Regions | Europe |
Countries | United Kingdom |
CAGR (2023 to 2033) | 5.9% |
Countries | Germany |
CAGR (2023 to 2033) | 5.2% |
Regions | Asia Pacific |
Countries | China |
CAGR (2023 to 2033) | 4.8% |
Countries | India |
CAGR (2023 to 2033) | 4.5% |
Top Countries Driving Anti-aging Products Services and Devices Market Growth
How is the USA Anti-aging Products Services and Devices Market Faring?
North America is anticipated to be the leading market, holding a major share of the anti-aging products services, and devices market.
The significant rise in demand for anti-aging products and devices is directly related to the growing prevalence of skin cancer among women in the USA As per the Skin Care Foundation, 1 in 5 Americans develops skin cancer by the age of 70 and 48 people die every day due to skin cancer.
Attributes |
Details |
USA Market Size (2033) |
US$ 27.6 billion |
USA Market Absolute Dollar Growth (US$ million/billion) |
US$ 11.6 billion |
CAGR % 2017 to 2022 |
9.5% |
CAGR % 2023 to End of Forecast(2033) |
5.6% |
Most skin cancers such as melanoma skin cancer, basal cell carcinoma, and squamous cell carcinoma require proper anti-aging reconstructive procedures, which is fuelling the demand for such procedures across the USA
Also, according to the International Society of Aesthetic Plastic Surgery (ISAPS), non-surgical anti-aging procedures across the USA are gaining wider adoption over invasive treatments.
With the growing demand for anti-aging surgical and non-surgical procedures across the USA, dermatology clinics and facilities are likely to witness a massive boom over the forecast period. Also, the increasing prevalence of skin cancer and rising awareness about skincare has boosted the anti-aging products and devices market across the USA
American Academy of Dermatology Association stated every day around 9.500 people in the USA are diagnosed with skin cancer. Research states that non-melanoma skin cancer and basal cell carcinoma affect 3 million Americans every year.
As per FMI’s analysis, the USA is expected to witness high remunerative growth in terms of revenue during the forecast period.
Why will the United Kingdom Anti-aging Products Services and Devices Market lead in Europe?
Burgeoning adoption of retinol and anti-wrinkle creams across the United Kingdom has significantly bolstered the growth of the anti-aging products & devices market. With the growing aging population and early adoption of anti-aging procedures, the industry is witnessing massive growth.
Attributes |
Details |
United Kingdom Market Size (2033) |
US$ 23.2 billion |
United Kingdom Market Absolute Dollar Growth (US$ million/billion) |
US$ 10.1 billion |
CAGR % 2017 to 2022 |
7.2% |
CAGR % 2023 to End of Forecast(2033) |
5.9% |
The increasing incidence of skin cancer and millions of people undergoing anti-wrinkle and anti-cellulite procedures across the United Kingdom have improved the demand. With the United Kingdom leading the Europe market, it is expected to remain the largest hotspot for anti-aging products & devices manufacturers.
According to Cancer Research United Kingdom, around 16,200 melanoma and non-melanoma skin cancer cases are recorded every year in the United Kingdom. Increasing cases of skin cancer have propelled the adoption of invasive as well as non-invasive anti-aging procedures across the United Kingdom.
Several new and advanced techniques have been introduced to curb skin cancer cases in the United Kingdom and reduce the cost of treatment and procedures. Also, with the constantly growing demand for new products, leading brands are investing heavily to cater to the demand.
For instance, in November 2020, Sof Wave Medical, the leading player, secured CE Mark for its next-generation Sofwave anti-aging system, approved for use in the treatment of fine lines and wrinkles in the European Union.
Based on these aforementioned factors, the United Kingdom’s anti-aging products services, and devices market is anticipated to witness the highest growth across Europe.
What's the Current State of the German Anti-aging Products, Services, and Devices Market?
Germany is one of the most mature markets for anti-aging products and services. The German anti-aging industry is expanding as a result of increased healthcare spending, growing interest in physical appearance maintenance, and high purchasing power.
Attributes |
Details |
Germany Market Size (2033) |
US$ 4.7 billion |
Germany Market Absolute Dollar Growth (US$ million/billion) |
US$ 1.9 billion |
CAGR % 2017 to 2022 |
9.8% |
CAGR % 2023 to End of Forecast(2033) |
5.2% |
Germany is seeing tremendous technological advancements in the cosmetics and beauty business as part of its fast industrialization and robust economic growth. On the basis of their skin type and preferences, German customers are renowned for making educated purchasing decisions. Individuals continue to look for product formulations that satisfy their requirements for product quality and related adverse effects.
Although price is still a significant determinant of purchasing choices, there has been a significant rise in consumer preference for expensive products with superior quality.
The majority of consumers in Germany concentrate their attention on certain well-known brands, like L’Oréal and Unilever PLC. 4.492 metric tons of skincare items were imported into Germany in 2021, according to ITC Trade Map, with Italy accounting for the largest value share of those imports.
What is the Demand Outlook for the Chinese Anti-ageing Products Services and Devices Market?
Anti-aging cream sales are now growing the fastest in China. Consumers in this industry are also strongly trending toward displaying an early interest in age prevention. Young people in this country frequently devote a large percentage of their earnings to cosmetic products.
Attributes |
Details |
China Market Size (2033) |
US$ 7.3 billion |
China Market Absolute Dollar Growth (US$ million/billion) |
US$ 2.8 billion |
CAGR % 2017 to 2022 |
6.1% |
CAGR % 2023 to End of Forecast(2033) |
4.8% |
Chinese millennials spend more on cosmetic items because they place a high value on appearance. The younger generations' understanding of skincare has steadily grown in comparison to the generation born in the 1970s and 1980s.
Young people start using anti-aging cosmetics sooner because of concerns about skin aging. They want heavier moisturizers and anti-aging products rather than as many whitening and brightening cosmetics.
Customers are more interested in product technology due to increased ingredient importance and increased skin care awareness among consumers. In contrast to moisturizing and whitening creams, anti-aging products' effects take longer to become apparent. The brand's focus on developing high-tech ingredients and promoting them has emerged as the key to winning over customers.
Young Chinese citizens’ shared philosophy of beginning early has undoubtedly revitalized the profitability of many high-end cosmetic companies. As the primary consumer group becomes more affluent and has more money to spend on themselves, the market is overflowing with anti-aging skincare products from both local and international companies.
Why is India a Key Player in the Field of Anti-aging Products, Services & Devices?
Demand for plant-based anti-aging skin products in India has boosted the adoption of anti-wrinkle and anti-cellulite treatments.
Attributes |
Details |
India Market Size (2033) |
US$ 4.5 billion |
India Market Absolute Dollar Growth (US$ million/billion) |
US$ 1.6 billion |
CAGR % 2017 to 2022 |
5.8% |
CAGR % 2023 to End of Forecast(2033) |
4.5% |
Maintaining youthful femininity and masculinity despite aging has bolstered the consumption of retinol-based creams and products in India. Also, the demand for topical and peel-based anti-aging treatments has increased in the country, especially among women.
Patients in this country also are resorting to the use of large amounts of over-the-counter anti-aging products in the Indian anti-aging products services and devices market. These products are widely adopted as they are much cheaper than botulinum toxin injections and laser therapies.
Anti-aging treatments that are easily available and affordable outside of dermatology clinic settings, however, have limited documented data on efficacy, which is anticipated to limit the growth of the market.
Costly procedures and treatments for anti-aging might also impede the growth as organic and natural alternatives are gaining precedence in the youth of the country.
What are the Factors Driving Anti-ageing Products Services and Devices Sales in Brazil?
Increasing cases of skin conditions such as atopic dermatitis, hair loss, and skin cancer across Brazil have amped up the adoption of anti-aging products in the country.
Brazil is a country of continental dimensions with high UV radiation incidence increases the risk of melanoma and non-melanoma skin cancer.
Data from the Brazilian National Cancer Institute for the year 2020 reported that around 4.03 new cases per 100,000 men and 3.94 new cases per 100,000 women in Brazil were diagnosed with melanoma skin cancer.
With increasing rates of skin conditions and Brazil being a low-income country, people are adopting treatments that cost low and have efficiency rates. Hence, the adoption of peel-based anti-aging treatment is gaining traction across the country.
This treatment is widely adopted as it is much cheaper than anti-wrinkle treatment or botulinum toxin products, which is improving the revenue generation of market players manufacturing chemical peels.
Categories Contributing to the Global Sales of Anti-aging Products Services and Devices Industry
Segment | Product Type |
Attributes | Moisturizers |
CAGR % 2017 to 2022 | 7.8% |
CAGR % 2023 to End of Forecast(2033) | 5.1% |
Segment | Application |
Attributes | Anti-pigmentation Therapy |
CAGR % 2017 to 2022 | 7.4% |
CAGR % 2023 to End of Forecast(2033) | 5.0% |
Which Distribution Channel is More Preferred?
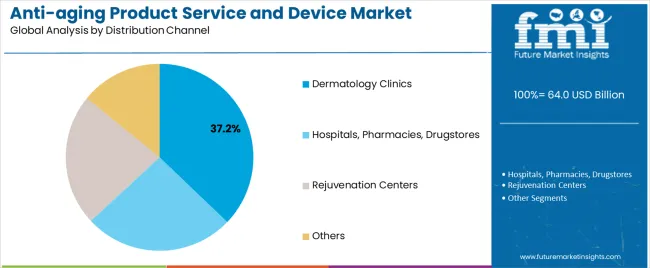
Dermatology clinics are anticipated to generate the highest demand owing to the increasing number of non-surgical and surgical cosmetic procedures across the globe. Rising awareness about skincare and the growing demand for anti-wrinkle and other anti-aging procedures will elevate the demand for anti-aging products services and devices.
Rejuvenation centers, pharmacies, and drugstores are expected to register steady growth over the forecast period owing to the increasing demand for anti-aging products.
The emergence of online retail pharmacies and drugstores has propelled segment growth and will continue to do so in the upcoming years.
Which Product Type is Gaining Traction in Anti-aging Services Products & Devices Market?
Increasing awareness about having a proper skincare routine to make skin more healthy and younger looking has improved the adoption of various anti-aging skin care products.
According to the International Society of Plastic Surgery (ISPS), a total of 1,582,296 adults underwent anti-aging procedures such as botulinum toxin procedure, wrinkle treatment, and others in 2020.
Increasing urbanization and the growing influence of social media have furthered the adoption of skin care products such as retinol, moisturizers, dermal fillers, and others among consumers in their skincare regimen.
As per FMI analysis, cellulite treatment and botulinum toxin are anticipated to lead the segment, followed by retinol and chemical peels over the forecast period.
Population in low-and middle-class income countries such as India, and Brazil are promoting the adoption of topical and peel-based anti-aging treatments, which will improve the growth of chemical peels and creams in the upcoming years.
Which Application Holds the Crown in Anti-aging Products Services & Devices Market?
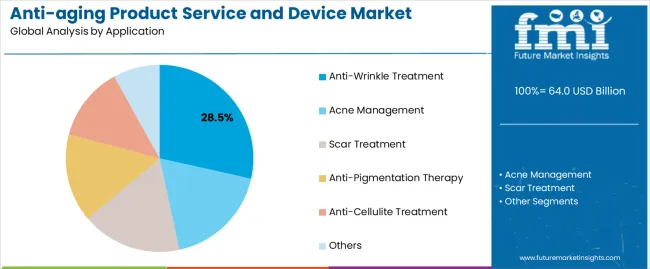
In terms of application, the market is segmented into anti-pigmentation therapy, anti-cellulite treatment, anti-wrinkle treatment, acne management, scar treatment, and others. As per FMI, cellulite reduction is one of the most popularly adopted anti-aging procedures.
A quest to remain beautiful and have younger-looking skin has fueled the demand for anti-cellulite and anti-wrinkle treatments across the globe.
FMI opines that anti-wrinkle products are undoubtedly likely to be the largest anti-aging market products share segment drawing the maximum revenue.
Data revealed by the American Society of Plastic Surgeons (ASPS) shows that patients aged between 35 years and 50 years, followed by anti-aging patients of age 51-64 years undergo cellulite treatment.
Around 90% of the female population is affected by cellulite problems and around 130,081 tummy-tuck and cellulite procedures were performed in the USA, as per ASPS.
Apart from this, around 17.7 million surgical and minimally invasive cosmetic procedures were performed in the USA in 2018 that included anti-wrinkle reduction, acne management, and other fat reduction procedures.
Top non-surgical anti-aging procedures include wrinkle reduction by injecting botulinum toxin type A; volume restoration with the help of hyaluronic acid-based dermal fillers; non-surgical fat reduction; hair removal and chemical peeling.
Growing inclination among people to look youthful and slow the aging process has increased the demand for such procedures and as per FMI, the demand will continue to increase with the increasing influence of social media across the globe.
Anti-aging Products Services and Devices Market Initiatives: Investments and Developments from Renowned Start-ups
New market entrants in the anti-aging products, services, and devices industry are utilizing technological developments to create unique products and achieve a competitive edge as they have identified growth opportunities for the anti-aging market. These companies consistently spend money on Research and Development (R&D) to stay abreast of changing customer tastes and market demands and to hold a large skin-lightening market share. Startup companies use a range of growth strategies to advance the industry and produce new products to satisfy the rising consumer demand for anti-aging products.
Leading Startups to Keep an Eye on
Start-up Company | True Botanicals |
Country | United States |
Description | Luxury skincare products are offered by the internet-only business True Botanicals. It offers skin care products for anti-aging that are made with bioactive ingredients. Its skincare products have the Made Safe label. It also uses an online survey to make customized product suggestions depending on the needs and features of the skin. |
Start-up Company | Senolytic Therapeutics |
Country | Spain |
Description | By identifying and removing damaged cells that produce the senescence-associated secretory phenotype (SASP) and cause tissue damage, Senolytic Therapeutics creates a revolutionary class of medicines. In addition to providing the patient with a therapeutic impact, it makes an effort to eliminate the damaged cells. Senolytics, a family of medications that target aging (or senescent) cells and kill them via inducing cell death, is a specialty of the firm. |
Competitive Landscape
Relentless urge to look youthful and have unblemished skin has significantly propelled the market growth along with the competition in the industry. With increasing competition, key players are introducing new and effective products to maintain their lead. Product innovation and combination therapeutics are the key strategies market players have adopted to stay ahead of the competition. Alongside product innovation, manufacturers are also collaborating and building partnerships with top brands to expand their customer base and have an extended reach to the global audience. Increasing social media penetration and hyper-awareness about skincare have urged the key players to come up with new & effective devices and products catering to the booming demand, to gain remunerative revenue over the forecast period.
Top Players Share in Anti-ageing Products Services and Devices Market and their Recent Developments
Company | Aesthetics Biomedical®, Inc. |
Details | Aesthetics Biomedical®, Inc., is dedicated to the creation and marketing of pioneering aesthetic goods, technologies, and services on a global scale. Its innovation center is a market leader in unique patient treatment approaches that profit from continuing research, authorized clinical grounds for usage, as well as a customized strategy created for consumer benefit. It serves its customers, physician network, and the aesthetic industry. |
Recent Developments | In September 2021, Aesthetics Biomedical Inc., a regenerative aesthetics medical device and top skin care company, announced new scientific findings through its research & development initiatives for its radio frequency micro-needing device (RFMN), Vivace, adhering to the booming demand for minimally invasive devices to address anti-aging and skin care procedures. |
Company | Innisfree |
Details | Innisfree provides innovative beauty products that are fueled by the purest natural ingredients that are ethically obtained from Korea's beautiful Jeju Island. Advanced compositions that safely address all skin conditions without the use of dangerous chemicals and preservatives are available by the brand. |
Recent Developments | In January 2021, Amorepacific-owned South Korean brand, ‘Innisfree’ announced the launch of a new anti-aging line, ‘Black Tea Youth Enhancing’, in Singapore after witnessing a huge success in South Korea. |
Company | Crescita Therapeutics Inc, |
Details | Crescita is a Canadian commercial dermatological firm focused on innovation and expansion that has in-house R&D and production capabilities. Crescita provides a variety of prescription medications that are in the early to commercial stages as well as high-quality, science-based non-prescription skincare items. |
Recent Developments | In January 2021, Crescita Therapeutics Inc, another leading player, and commercial dermatology announced the new certification from Laboratories FILMED, for its new ART FILLER range of products and New Cellular Treatment Factor in Canada. |
Company | Bare Minerals |
Details | Bare Minerals is one of the most well-known manufacturers of mineral cosmetics. Additionally, a large number of chemical-free cosmetic items are made by Bare Minerals. Since its early years as a mineral cosmetics pioneer, the company has gone a long way. Skincare items for antioxidants and anti-aging are now part of the lineup |
Recent Developments | In December 2020, Bare Minerals announced a new product line of its anti-aging collection for dry winter skin with a plant-based alternative to retinol. |
Company | L'Oreal SA |
Details | L'Oreal SA is the top cosmetics company in the world and strives to provide everyone with access to the finest in beauty via its commitment to quality, scientific brilliance, and ongoing innovation. Key aging indicators are fought and prevented by its anti-aging skin care treatments and products. |
Recent Developments | In February 2019, L'Oréal obtained ModiFace, an Augmented Reality and AI company. In addition, L'Oréal Research Innovation released the first version of a digital skin diagnosis for customers based on 15 years of scientific research on skin aging by L'Oréal R&I assessment teams. |
Company | The Face Shop |
Details | The Face Shop is a skincare and cosmetics producer, retailer, and franchise company with its headquarters in South Korea. It sells body care, cosmetics, skincare, and bath items for both men and women. |
Recent Developments | In October 2018, The Face Shop, a South Korean skincare producer, retailer, and franchisor, introduced a new product line called Yehwadam that focuses on antiaging and brightening issues. |
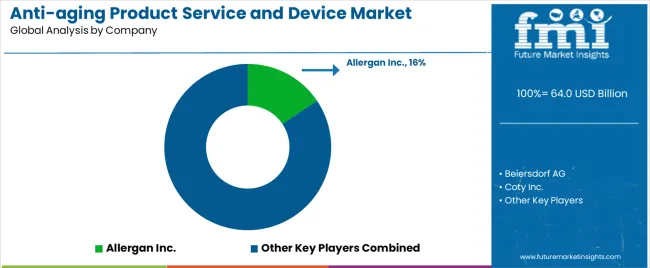
Future Market Insights has outlined the some other top players of anti-aging market
- Allergan Inc.
- Beiersdorf AG
- Coty Inc.
- Cynosure Inc.
- Personal Microderm (PMD)
- Age Sciences Inc.
- Lumenis Ltd.
- Solta Medical Inc.
- Nestle
Anti-aging Products Services and Devices Market by Category
By Application:
- Anti-Pigmentation Therapy
- Anti-Cellulite Treatment
- Anti-Wrinkle Treatment
- Acne Management
- Scar Treatment
- Others
By Product Type:
- Creams
- Moisturizers
- Retinols
- Dermal Fillers
- Botulinum Toxin
- Chemical Peels
- Cellulite Treatment
- Non-Surgical Fat Reduction
- Others
By Distribution Channel:
- Dermatology Clinics
- Hospitals, Pharmacies, Drugstores
- Rejuvenation Centers
- Others
By Region:
- North America
- Latin America
- Western Europe
- Eastern Europe
- China
- Japan
- Asia Pacific excluding Japan (APEJ)
- Middle East & Africa (MEA)
Frequently Asked Questions
What is the current anti-aging products services and devices market value?
The anti-aging products services and devices market is expected to surpass a valuation of approx US$ 64 billion in 2023.
At what rate did the Anti-aging products services and devices market grow between 2016 and 2020?
The anti-aging products services and devices market witnessed moderate growth at around 8.1% CAGR between 2017 and 2022.
What are the key trends driving anti-aging products services and devices sales?
The growing aging population worldwide, strict regulations led to the introduction of safe and efficient anti-aging products and services, and an increase in awareness about aging signs in younger generations are the key trends driving sales.
Who are the leading players of anti-aging products services and devices?
Allergan, Inc., Beiersdorf, AG, L’Oreal, SA, Coty, Inc., and Cynosure, Inc. are the top players leading the anti-aging products services, and devices market.
What will be the demand outlook for the United States Anti-aging products services and devices market?
Sales in the United States for the anti-aging products services and devices market are set to grow at a healthy rate, reaching a valuation of approx US$ 27.6 billion by 2023.
Which country in Europe will lead the anti-aging products, services and devices market?
The United Kingdom is expected to spearhead the market growth across Europe, growing at a CAGR of 5.6%
Which are the top countries leading the anti-aging products services and devices market demand?
The USA, The United Kingdom, Germany, China, and India are the top countries driving the anti-aging products services, and devices market.
What is the market share of leading players in anti-aging products services and devices market?
Top tier-1 players operating in the anti-aging products services and devices market contribute around 25-30% of the global market share.
Table of Content
1. Executive Summary | Anti-Aging Products Services and Devices Market 1.1. Global Market Outlook 1.2. Demand-side Trends 1.3. Supply-side Trends 1.4. Technology Roadmap Analysis 1.5. Analysis and Recommendations 2. Market Overview 2.1. Market Coverage / Taxonomy 2.2. Market Definition / Scope / Limitations 3. Market Background 3.1. Market Dynamics 3.1.1. Drivers 3.1.2. Restraints 3.1.3. Opportunity 3.1.4. Trends 3.2. Scenario Forecast 3.2.1. Demand in Optimistic Scenario 3.2.2. Demand in Likely Scenario 3.2.3. Demand in Conservative Scenario 3.3. Opportunity Map Analysis 3.4. Investment Feasibility Matrix 3.5. PESTLE and Porter’s Analysis 3.6. Regulatory Landscape 3.6.1. By Key Regions 3.6.2. By Key Countries 3.7. Regional Parent Market Outlook 4. Global Market Analysis 2017 to 2022 and Forecast, 2023 to 2033 4.1. Historical Market Size Value (US$ million) Analysis, 2017 to 2022 4.2. Current and Future Market Size Value (US$ million) Projections, 2023 to 2033 4.2.1. Y-o-Y Growth Trend Analysis 4.2.2. Absolute $ Opportunity Analysis 5. Global Market Analysis 2017 to 2022 and Forecast 2023 to 2033, By Application 5.1. Introduction / Key Findings 5.2. Historical Market Size Value (US$ million) Analysis By Application, 2017 to 2022 5.3. Current and Future Market Size Value (US$ million) Analysis and Forecast By Application, 2023 to 2033 5.3.1. Anti-Pigmentation Therapy 5.3.2. Anti-Cellulite Treatment 5.3.3. Anti-Wrinkle Treatment 5.3.4. Acne Management 5.3.5. Scar Treatment 5.3.6. Other Applications 5.4. Y-o-Y Growth Trend Analysis By Application, 2017 to 2022 5.5. Absolute $ Opportunity Analysis By Application, 2023 to 2033 6. Global Market Analysis 2017 to 2022 and Forecast 2023 to 2033, By Product Type 6.1. Introduction / Key Findings 6.2. Historical Market Size Value (US$ million) Analysis By Product Type, 2017 to 2022 6.3. Current and Future Market Size Value (US$ million) Analysis and Forecast By Product Type, 2023 to 2033 6.3.1. Creams 6.3.2. Moisturizers 6.3.3. Retinols 6.3.4. Dermal Fillers 6.3.5. Botulinum Toxin 6.3.6. Chemical Peels 6.3.7. Cellulite Treatment 6.3.8. Non-Surgical Fat Reduction 6.3.9. Other Product Types 6.4. Y-o-Y Growth Trend Analysis By Product Type, 2017 to 2022 6.5. Absolute $ Opportunity Analysis By Product Type, 2023 to 2033 7. Global Market Analysis 2017 to 2022 and Forecast 2023 to 2033, By Distribution Channel 7.1. Introduction / Key Findings 7.2. Historical Market Size Value (US$ million) Analysis By Distribution Channel, 2017 to 2022 7.3. Current and Future Market Size Value (US$ million) Analysis and Forecast By Distribution Channel, 2023 to 2033 7.3.1. Dermatology Clinics 7.3.2. Hospitals, Pharmacies, Drugstores 7.3.3. Rejuvenation Centers 7.3.4. Other Channels 7.4. Y-o-Y Growth Trend Analysis By Distribution Channel, 2017 to 2022 7.5. Absolute $ Opportunity Analysis By Distribution Channel, 2023 to 2033 8. Global Market Analysis 2017 to 2022 and Forecast 2023 to 2033, By Region 8.1. Introduction 8.2. Historical Market Size Value (US$ million) Analysis By Region, 2017 to 2022 8.3. Current Market Size Value (US$ million) Analysis and Forecast By Region, 2023 to 2033 8.3.1. North America 8.3.2. Europe 8.3.3. Asia Pacific 8.3.4. Rest of the World 8.4. Market Attractiveness Analysis By Region 9. North America Market Analysis 2017 to 2022 and Forecast 2023 to 2033, By Country 9.1. Historical Market Size Value (US$ million) Trend Analysis By Market Taxonomy, 2017 to 2022 9.2. Market Size Value (US$ million) Forecast By Market Taxonomy, 2023 to 2033 9.2.1. By Country 9.2.1.1. The USA 9.2.1.2. Canada 9.2.2. By Application 9.2.3. By Product Type 9.2.4. By Distribution Channel 9.3. Market Attractiveness Analysis 9.3.1. By Country 9.3.2. By Application 9.3.3. By Product Type 9.3.4. By Distribution Channel 9.4. Key Takeaways 10. Europe Market Analysis 2017 to 2022 and Forecast 2023 to 2033, By Country 10.1. Historical Market Size Value (US$ million) Trend Analysis By Market Taxonomy, 2017 to 2022 10.2. Market Size Value (US$ million) Forecast By Market Taxonomy, 2023 to 2033 10.2.1. By Country 10.2.1.1. The United Kingdom 10.2.1.2. Germany 10.2.1.3. France 10.2.1.4. Spain 10.2.1.5. Italy 10.2.1.6. Nordic 10.2.1.7. Benelux 10.2.1.8. Rest of Europe 10.2.2. By Application 10.2.3. By Product Type 10.2.4. By Distribution Channel 10.3. Market Attractiveness Analysis 10.3.1. By Country 10.3.2. By Application 10.3.3. By Product Type 10.3.4. By Distribution Channel 10.4. Key Takeaways 11. Asia Pacific Market Analysis 2017 to 2022 and Forecast 2023 to 2033, By Country 11.1. Historical Market Size Value (US$ million) Trend Analysis By Market Taxonomy, 2017 to 2022 11.2. Market Size Value (US$ million) Forecast By Market Taxonomy, 2023 to 2033 11.2.1. By Country 11.2.1.1. China 11.2.1.2. India 11.2.1.3. ASEAN 11.2.1.4. Australia & New Zealand 11.2.1.5. Rest of Asia Pacific 11.2.2. By Application 11.2.3. By Product Type 11.2.4. By Distribution Channel 11.3. Market Attractiveness Analysis 11.3.1. By Country 11.3.2. By Application 11.3.3. By Product Type 11.3.4. By Distribution Channel 11.4. Key Takeaways 12. Rest of the World Market Analysis 2017 to 2022 and Forecast 2023 to 2033, By Country 12.1. Historical Market Size Value (US$ million) Trend Analysis By Market Taxonomy, 2017 to 2022 12.2. Market Size Value (US$ million) Forecast By Market Taxonomy, 2023 to 2033 12.2.1. By Country 12.2.2. By Application 12.2.3. By Product Type 12.2.4. By Distribution Channel 12.3. Market Attractiveness Analysis 12.3.1. By Country 12.3.2. By Application 12.3.3. By Product Type 12.3.4. By Distribution Channel 12.4. Key Takeaways 13. Key Countries Market Analysis 13.1. The USA 13.1.1. Pricing Analysis 13.1.2. Market Share Analysis, 2022 13.1.2.1. By Application 13.1.2.2. By Product Type 13.1.2.3. By Distribution Channel 13.2. Canada 13.2.1. Pricing Analysis 13.2.2. Market Share Analysis, 2022 13.2.2.1. By Application 13.2.2.2. By Product Type 13.2.2.3. By Distribution Channel 13.3. The United Kingdom 13.3.1. Pricing Analysis 13.3.2. Market Share Analysis, 2022 13.3.2.1. By Application 13.3.2.2. By Product Type 13.3.2.3. By Distribution Channel 13.4. Germany 13.4.1. Pricing Analysis 13.4.2. Market Share Analysis, 2022 13.4.2.1. By Application 13.4.2.2. By Product Type 13.4.2.3. By Distribution Channel 13.5. France 13.5.1. Pricing Analysis 13.5.2. Market Share Analysis, 2022 13.5.2.1. By Application 13.5.2.2. By Product Type 13.5.2.3. By Distribution Channel 13.6. Spain 13.6.1. Pricing Analysis 13.6.2. Market Share Analysis, 2022 13.6.2.1. By Application 13.6.2.2. By Product Type 13.6.2.3. By Distribution Channel 13.7. Italy 13.7.1. Pricing Analysis 13.7.2. Market Share Analysis, 2022 13.7.2.1. By Application 13.7.2.2. By Product Type 13.7.2.3. By Distribution Channel 13.8. Nordic 13.8.1. Pricing Analysis 13.8.2. Market Share Analysis, 2022 13.8.2.1. By Application 13.8.2.2. By Product Type 13.8.2.3. By Distribution Channel 13.9. Benelux 13.9.1. Pricing Analysis 13.9.2. Market Share Analysis, 2022 13.9.2.1. By Application 13.9.2.2. By Product Type 13.9.2.3. By Distribution Channel 13.10. China 13.10.1. Pricing Analysis 13.10.2. Market Share Analysis, 2022 13.10.2.1. By Application 13.10.2.2. By Product Type 13.10.2.3. By Distribution Channel 13.11. India 13.11.1. Pricing Analysis 13.11.2. Market Share Analysis, 2022 13.11.2.1. By Application 13.11.2.2. By Product Type 13.11.2.3. By Distribution Channel 13.12. ASEAN 13.12.1. Pricing Analysis 13.12.2. Market Share Analysis, 2022 13.12.2.1. By Application 13.12.2.2. By Product Type 13.12.2.3. By Distribution Channel 13.13. Australia & New Zealand 13.13.1. Pricing Analysis 13.13.2. Market Share Analysis, 2022 13.13.2.1. By Application 13.13.2.2. By Product Type 13.13.2.3. By Distribution Channel 14. Market Structure Analysis 14.1. Competition Dashboard 14.2. Competition Benchmarking 14.3. Market Share Analysis of Top Players 14.3.1. By Regional 14.3.2. By Application 14.3.3. By Product Type 14.3.4. By Distribution Channel 15. Competition Analysis 15.1. Competition Deep Dive 15.1.1. Allergan Inc. 15.1.1.1. Overview 15.1.1.2. Product Portfolio 15.1.1.3. Profitability by Market Segments 15.1.1.4. Sales Footprint 15.1.1.5. Strategy Overview 15.1.1.5.1. Marketing Strategy 15.1.2. Beiersdorf AG 15.1.2.1. Overview 15.1.2.2. Product Portfolio 15.1.2.3. Profitability by Market Segments 15.1.2.4. Sales Footprint 15.1.2.5. Strategy Overview 15.1.2.5.1. Marketing Strategy 15.1.3. L’Oreal SA 15.1.3.1. Overview 15.1.3.2. Product Portfolio 15.1.3.3. Profitability by Market Segments 15.1.3.4. Sales Footprint 15.1.3.5. Strategy Overview 15.1.3.5.1. Marketing Strategy 15.1.4. Coty Inc. 15.1.4.1. Overview 15.1.4.2. Product Portfolio 15.1.4.3. Profitability by Market Segments 15.1.4.4. Sales Footprint 15.1.4.5. Strategy Overview 15.1.4.5.1. Marketing Strategy 15.1.5. Cynosure Inc. 15.1.5.1. Overview 15.1.5.2. Product Portfolio 15.1.5.3. Profitability by Market Segments 15.1.5.4. Sales Footprint 15.1.5.5. Strategy Overview 15.1.5.5.1. Marketing Strategy 15.1.6. Personal Microderm (PMD) 15.1.6.1. Overview 15.1.6.2. Product Portfolio 15.1.6.3. Profitability by Market Segments 15.1.6.4. Sales Footprint 15.1.6.5. Strategy Overview 15.1.6.5.1. Marketing Strategy 15.1.7. Age Sciences Inc. 15.1.7.1. Overview 15.1.7.2. Product Portfolio 15.1.7.3. Profitability by Market Segments 15.1.7.4. Sales Footprint 15.1.7.5. Strategy Overview 15.1.7.5.1. Marketing Strategy 15.1.8. Lumenis Ltd. 15.1.8.1. Overview 15.1.8.2. Product Portfolio 15.1.8.3. Profitability by Market Segments 15.1.8.4. Sales Footprint 15.1.8.5. Strategy Overview 15.1.8.5.1. Marketing Strategy 15.1.9. Solta Medical Inc. 15.1.9.1. Overview 15.1.9.2. Product Portfolio 15.1.9.3. Profitability by Market Segments 15.1.9.4. Sales Footprint 15.1.9.5. Strategy Overview 15.1.9.5.1. Marketing Strategy 15.1.10. Nestle 15.1.10.1. Overview 15.1.10.2. Product Portfolio 15.1.10.3. Profitability by Market Segments 15.1.10.4. Sales Footprint 15.1.10.5. Strategy Overview 15.1.10.5.1. Marketing Strategy 16. Assumptions & Acronyms Used 17. Research Methodology
Don't pay for what you don't need
Customize your report by selecting specific countries or regions and save 30%!
List of Tables
Table 1: Global Market Value (US$ million) Forecast by Region, 2017 to 2033 Table 2: Global Market Value (US$ million) Forecast by Application, 2017 to 2033 Table 3: Global Market Value (US$ million) Forecast by Product Type, 2017 to 2033 Table 4: Global Market Value (US$ million) Forecast by Distribution Channel, 2017 to 2033 Table 5: North America Market Value (US$ million) Forecast by Country, 2017 to 2033 Table 6: North America Market Value (US$ million) Forecast by Application, 2017 to 2033 Table 7: North America Market Value (US$ million) Forecast by Product Type, 2017 to 2033 Table 8: North America Market Value (US$ million) Forecast by Distribution Channel, 2017 to 2033 Table 9: Europe Market Value (US$ million) Forecast by Country, 2017 to 2033 Table 10: Europe Market Value (US$ million) Forecast by Application, 2017 to 2033 Table 11: Europe Market Value (US$ million) Forecast by Product Type, 2017 to 2033 Table 12: Europe Market Value (US$ million) Forecast by Distribution Channel, 2017 to 2033 Table 13: Asia Pacific Market Value (US$ million) Forecast by Country, 2017 to 2033 Table 14: Asia Pacific Market Value (US$ million) Forecast by Application, 2017 to 2033 Table 15: Asia Pacific Market Value (US$ million) Forecast by Product Type, 2017 to 2033 Table 16: Asia Pacific Market Value (US$ million) Forecast by Distribution Channel, 2017 to 2033 Table 17: Rest of the World Market Value (US$ million) Forecast by Country, 2017 to 2033 Table 18: Rest of the World Market Value (US$ million) Forecast by Application, 2017 to 2033 Table 19: Rest of the World Market Value (US$ million) Forecast by Product Type, 2017 to 2033 Table 20: Rest of the World Market Value (US$ million) Forecast by Distribution Channel, 2017 to 2033
List of Charts
Figure 1: Global Market Value (US$ million) by Application, 2023 to 2033 Figure 2: Global Market Value (US$ million) by Product Type, 2023 to 2033 Figure 3: Global Market Value (US$ million) by Distribution Channel, 2023 to 2033 Figure 4: Global Market Value (US$ million) by Region, 2023 to 2033 Figure 5: Global Market Value (US$ million) Analysis by Region, 2017 to 2033 Figure 6: Global Market Value Share (%) and BPS Analysis by Region, 2023 to 2033 Figure 7: Global Market Y-o-Y Growth (%) Projections by Region, 2023 to 2033 Figure 8: Global Market Value (US$ million) Analysis by Application, 2017 to 2033 Figure 9: Global Market Value Share (%) and BPS Analysis by Application, 2023 to 2033 Figure 10: Global Market Y-o-Y Growth (%) Projections by Application, 2023 to 2033 Figure 11: Global Market Value (US$ million) Analysis by Product Type, 2017 to 2033 Figure 12: Global Market Value Share (%) and BPS Analysis by Product Type, 2023 to 2033 Figure 13: Global Market Y-o-Y Growth (%) Projections by Product Type, 2023 to 2033 Figure 14: Global Market Value (US$ million) Analysis by Distribution Channel, 2017 to 2033 Figure 15: Global Market Value Share (%) and BPS Analysis by Distribution Channel, 2023 to 2033 Figure 16: Global Market Y-o-Y Growth (%) Projections by Distribution Channel, 2023 to 2033 Figure 17: Global Market Attractiveness by Application, 2023 to 2033 Figure 18: Global Market Attractiveness by Product Type, 2023 to 2033 Figure 19: Global Market Attractiveness by Distribution Channel, 2023 to 2033 Figure 20: Global Market Attractiveness by Region, 2023 to 2033 Figure 21: North America Market Value (US$ million) by Application, 2023 to 2033 Figure 22: North America Market Value (US$ million) by Product Type, 2023 to 2033 Figure 23: North America Market Value (US$ million) by Distribution Channel, 2023 to 2033 Figure 24: North America Market Value (US$ million) by Country, 2023 to 2033 Figure 25: North America Market Value (US$ million) Analysis by Country, 2017 to 2033 Figure 26: North America Market Value Share (%) and BPS Analysis by Country, 2023 to 2033 Figure 27: North America Market Y-o-Y Growth (%) Projections by Country, 2023 to 2033 Figure 28: North America Market Value (US$ million) Analysis by Application, 2017 to 2033 Figure 29: North America Market Value Share (%) and BPS Analysis by Application, 2023 to 2033 Figure 30: North America Market Y-o-Y Growth (%) Projections by Application, 2023 to 2033 Figure 31: North America Market Value (US$ million) Analysis by Product Type, 2017 to 2033 Figure 32: North America Market Value Share (%) and BPS Analysis by Product Type, 2023 to 2033 Figure 33: North America Market Y-o-Y Growth (%) Projections by Product Type, 2023 to 2033 Figure 34: North America Market Value (US$ million) Analysis by Distribution Channel, 2017 to 2033 Figure 35: North America Market Value Share (%) and BPS Analysis by Distribution Channel, 2023 to 2033 Figure 36: North America Market Y-o-Y Growth (%) Projections by Distribution Channel, 2023 to 2033 Figure 37: North America Market Attractiveness by Application, 2023 to 2033 Figure 38: North America Market Attractiveness by Product Type, 2023 to 2033 Figure 39: North America Market Attractiveness by Distribution Channel, 2023 to 2033 Figure 40: North America Market Attractiveness by Country, 2023 to 2033 Figure 41: Europe Market Value (US$ million) by Application, 2023 to 2033 Figure 42: Europe Market Value (US$ million) by Product Type, 2023 to 2033 Figure 43: Europe Market Value (US$ million) by Distribution Channel, 2023 to 2033 Figure 44: Europe Market Value (US$ million) by Country, 2023 to 2033 Figure 45: Europe Market Value (US$ million) Analysis by Country, 2017 to 2033 Figure 46: Europe Market Value Share (%) and BPS Analysis by Country, 2023 to 2033 Figure 47: Europe Market Y-o-Y Growth (%) Projections by Country, 2023 to 2033 Figure 48: Europe Market Value (US$ million) Analysis by Application, 2017 to 2033 Figure 49: Europe Market Value Share (%) and BPS Analysis by Application, 2023 to 2033 Figure 50: Europe Market Y-o-Y Growth (%) Projections by Application, 2023 to 2033 Figure 51: Europe Market Value (US$ million) Analysis by Product Type, 2017 to 2033 Figure 52: Europe Market Value Share (%) and BPS Analysis by Product Type, 2023 to 2033 Figure 53: Europe Market Y-o-Y Growth (%) Projections by Product Type, 2023 to 2033 Figure 54: Europe Market Value (US$ million) Analysis by Distribution Channel, 2017 to 2033 Figure 55: Europe Market Value Share (%) and BPS Analysis by Distribution Channel, 2023 to 2033 Figure 56: Europe Market Y-o-Y Growth (%) Projections by Distribution Channel, 2023 to 2033 Figure 57: Europe Market Attractiveness by Application, 2023 to 2033 Figure 58: Europe Market Attractiveness by Product Type, 2023 to 2033 Figure 59: Europe Market Attractiveness by Distribution Channel, 2023 to 2033 Figure 60: Europe Market Attractiveness by Country, 2023 to 2033 Figure 61: Asia Pacific Market Value (US$ million) by Application, 2023 to 2033 Figure 62: Asia Pacific Market Value (US$ million) by Product Type, 2023 to 2033 Figure 63: Asia Pacific Market Value (US$ million) by Distribution Channel, 2023 to 2033 Figure 64: Asia Pacific Market Value (US$ million) by Country, 2023 to 2033 Figure 65: Asia Pacific Market Value (US$ million) Analysis by Country, 2017 to 2033 Figure 66: Asia Pacific Market Value Share (%) and BPS Analysis by Country, 2023 to 2033 Figure 67: Asia Pacific Market Y-o-Y Growth (%) Projections by Country, 2023 to 2033 Figure 68: Asia Pacific Market Value (US$ million) Analysis by Application, 2017 to 2033 Figure 69: Asia Pacific Market Value Share (%) and BPS Analysis by Application, 2023 to 2033 Figure 70: Asia Pacific Market Y-o-Y Growth (%) Projections by Application, 2023 to 2033 Figure 71: Asia Pacific Market Value (US$ million) Analysis by Product Type, 2017 to 2033 Figure 72: Asia Pacific Market Value Share (%) and BPS Analysis by Product Type, 2023 to 2033 Figure 73: Asia Pacific Market Y-o-Y Growth (%) Projections by Product Type, 2023 to 2033 Figure 74: Asia Pacific Market Value (US$ million) Analysis by Distribution Channel, 2017 to 2033 Figure 75: Asia Pacific Market Value Share (%) and BPS Analysis by Distribution Channel, 2023 to 2033 Figure 76: Asia Pacific Market Y-o-Y Growth (%) Projections by Distribution Channel, 2023 to 2033 Figure 77: Asia Pacific Market Attractiveness by Application, 2023 to 2033 Figure 78: Asia Pacific Market Attractiveness by Product Type, 2023 to 2033 Figure 79: Asia Pacific Market Attractiveness by Distribution Channel, 2023 to 2033 Figure 80: Asia Pacific Market Attractiveness by Country, 2023 to 2033 Figure 81: Rest of the World Market Value (US$ million) by Application, 2023 to 2033 Figure 82: Rest of the World Market Value (US$ million) by Product Type, 2023 to 2033 Figure 83: Rest of the World Market Value (US$ million) by Distribution Channel, 2023 to 2033 Figure 84: Rest of the World Market Value (US$ million) by Country, 2023 to 2033 Figure 85: Rest of the World Market Value (US$ million) Analysis by Country, 2017 to 2033 Figure 86: Rest of the World Market Value Share (%) and BPS Analysis by Country, 2023 to 2033 Figure 87: Rest of the World Market Y-o-Y Growth (%) Projections by Country, 2023 to 2033 Figure 88: Rest of the World Market Value (US$ million) Analysis by Application, 2017 to 2033 Figure 89: Rest of the World Market Value Share (%) and BPS Analysis by Application, 2023 to 2033 Figure 90: Rest of the World Market Y-o-Y Growth (%) Projections by Application, 2023 to 2033 Figure 91: Rest of the World Market Value (US$ million) Analysis by Product Type, 2017 to 2033 Figure 92: Rest of the World Market Value Share (%) and BPS Analysis by Product Type, 2023 to 2033 Figure 93: Rest of the World Market Y-o-Y Growth (%) Projections by Product Type, 2023 to 2033 Figure 94: Rest of the World Market Value (US$ million) Analysis by Distribution Channel, 2017 to 2033 Figure 95: Rest of the World Market Value Share (%) and BPS Analysis by Distribution Channel, 2023 to 2033 Figure 96: Rest of the World Market Y-o-Y Growth (%) Projections by Distribution Channel, 2023 to 2033 Figure 97: Rest of the World Market Attractiveness by Application, 2023 to 2033 Figure 98: Rest of the World Market Attractiveness by Product Type, 2023 to 2033 Figure 99: Rest of the World Market Attractiveness by Distribution Channel, 2023 to 2033 Figure 100: Rest of the World Market Attractiveness by Country, 2023 to 2033
Recommendations
Explore Healthcare Insights
View Reports