Soda Production Machine Market Outlook (2023 to 2033)

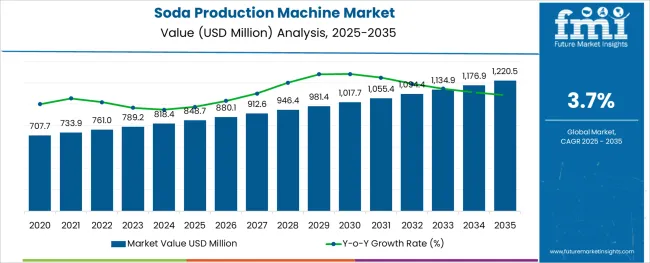
According to Future Market Insights' study, the soda production machine market is expected to grow at a CAGR of 3.7% over the estimated period. The industry value is expected to grow from US$ 789.2 million in 2023 to US$ 1,134.9 million in 2033. The Soda Production Machine Market was worth US$ 761.0 million by the end of 2022.

With regard to soda production machines, key players are focusing on designing premium home essentials engineered to uplift everyday routines. They claim that they aim to refine the home appliances industry, driven by their determination for design. They merge durable quality, superior materials, and a unique design approach in a category of products that may have been overlooked by the design community. This is expected to contribute to the global soda production machine market growth.

Sparkling water is a type of aerated drink that is favored by people all over the world. It combines the desirable bubbly texture of soda with the hydration one gets from drinking water. Hence, key players have manufactured unique sparkling water makers in stainless steel with sophisticated glass bottles. It offers a great carbonation experience which has primarily been made possible through great engineering. They are provided in eight stunning finishes to match and upgrade any countertop.

These factors are estimated to drive the demand for soda production machines. Moreover, they design, develop, and test all products in their workshop until everything from the first visual impression to the touch, feel, and interactive sensation of the product is of the highest quality. They aim to build products that last for years through a slow and mindful product development process.

Through their expertise in product development, these soda production machines can turn plain water into fresh sparkling water in seconds which is anticipated to generate creative opportunities and drive the sales of the soda production machine. They are essentially designed for the modern kitchen and feature the new Quick Connect technology for fat and easy CO2 cylinder insertion.

With a simple push of a lever, flat water can be turned into fresh sparkling water and customized to one’s liking. Soda production machines are growing in popularity since it saves the hassle of purchasing bottled soda and soft drinks. Therefore, the high adoption of the soda production machine is attributed to the easy transformation of water into soda or any sparkling beverage in a matter of seconds, without electricity or battery. In addition, key players provide the option to exchange empty refills for a full refill, at a fraction of the cost, from a nearby stockist.

The machines can be considered a healthy choice since it uses plain water and pure grade CO2 to turn it sparkling, without the use of sugar. Customers can also choose how fizzy they want their drinks to be by setting the machine to strong, medium, or light. Furthermore, these machines are also eco-friendly as it reduces the consumption of thousands of plastic bottles with a single machine which propels the sales of the soda production machine. As the ultimate combination of sustainability and design, the mild scent of wood elevates a unique aromatic experience.

Apart from stainless steel, certain soda machine manufacturers may use almost 100% renewable-based wood composite to develop the body of the device instead of using fossil-based plastic or non-biodegradable plastic. The elegant wood design of the device is offered in various colors. All have a unique finish with subtly visible wood fibers that give the device an extremely sophisticated look. Another way key players manufacture machines for carbonated drinks is by providing the world’s most sustainable sparkling water through local production, innovative materials, and the recycling of carbon cylinders. All these factors surge the product demand and are anticipated to expand the global soda production machine market size.

Attribute Details
Market Size Value in 2023 US$ 789.2 million
Market Forecast Value in 2033 US$ 1,134.9 million
Global Growth Rate (2023 to 2033) 3.7%
Forecast Period 2023 to 2033
Global Market Share of Australia, The USA, Japan, and Germany 69.2%

The rising demand for soft drinks and the growing preference for natural sweeteners are the major factors driving the growth of this market.

Don't pay for what you don't need

Customize your report by selecting specific countries or regions and save 30%!

Historical Outlook versus Future Projections for Soda Production Machine Market

The global market for soda production machinery increased from US$ 626.1 million to US$ 761.0 million between 2018 and 2022 with a CAGR of 5.0%.

The historical performance of the soda production machine market shows that the market has been growing at a steady pace over the last few years. However, future projections for the market show that growth is expected to accelerate in the future.

One of the key factors driving the growth of the soda production machine market is the increasing demand for carbonated drinks. Carbonated drinks are becoming increasingly popular, especially among young adults and teenagers. This is due to the fact that they are refreshing and have a wide range of flavors. In addition, carbonated drinks are also considered to be healthy as they contain less sugar than other types of drinks, such as juices and sodas.

During the forecast period, the global Soda Production Machine Market is anticipated to grow from US$ 789.2 billion in 2023 to US$ 1,134.9 billion by 2033 with a strong CAGR of 3.7%.

Soda Production Machine Market

Comparative Analysis of Adjacent Markets

Soda Production Machine Market:

Attributes Soda Production Machine Market
CAGR (2022 to 2033) 3.7%
Market Value (2033) US$ 1,134.9 million
Growth Factor Consumers opt for these soda machines as it is able quickly to carbonate regular water to the level of fizziness required.
Opportunity Manufacturers are integrating smart technologies to expand the features that are already available in these machines to further facilitate soda making.
Restraints The improbability of supplying high-speed broadband in remote areas of developing countries because of low penetration of the internet.

Beer Brewing Machine Market:

Attributes Beer Brewing Machine Market
CAGR (2022 to 2033) 3.4%
Market Value (2033) US$ 58.6 billion
Growth Factor Increasing demand for different flavored beers and draught beer, along with its easy installation process.
Opportunity Different facilities such as digital thermostats, displays, and connectivity functions like Wi-Fi are slowly being incorporated into these machines.
Restraints Negative images and taboos regarding alcohol intake, as well as restrictions on advertisements may retain market growth.

Commercial Slush Machine Market:

Attributes Commercial Slush Machine Market
CAGR (2022 to 2033) 4.5%
Market Value (2033) US$ 523.8 million
Growth Factor The rising number of institutional cafeterias and canteens and increased spending on dining out at HoReCa.
Opportunity Growing adoption of these machines in restaurants, cafés, lounges, etc. owing to meetings and conferences, as well as the rising travel & tourism industry.
Restraints The availability of other alternative beverages and strong reliance on imports. Moreover, most of these machines have a very high initial cost.
Nandini Roy Choudhury

Principal Consultant

Talk to Analyst

Find your sweet spots for generating winning opportunities in this market.

Category-wise Insights

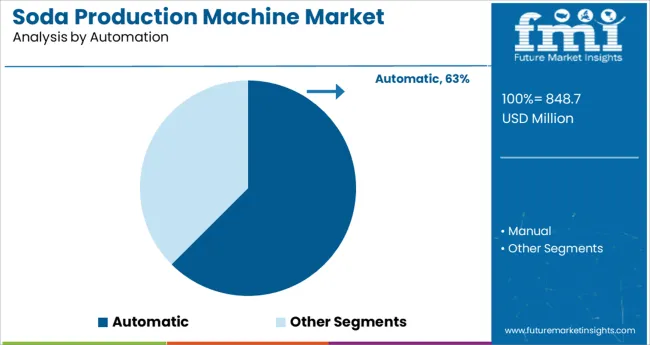
  • Automatic - By Automation Type

An automatic soda production machine offers many advantages over traditional methods of soda production. Perhaps the most significant advantage is increased efficiency. An automatic machine can produce a much higher volume of soda in a shorter period of time than a manual process. This increased efficiency can lead to lower production costs and faster turnaround times for new products.

In addition, an automatic soda production machine can offer greater accuracy and consistency in the finished product. This is due to the fact that the machine can control all aspects of the production process, from ingredient proportions to carbonation levels. This consistent quality can be especially important for large-scale production runs or for products that require strict adherence to regulatory standards.

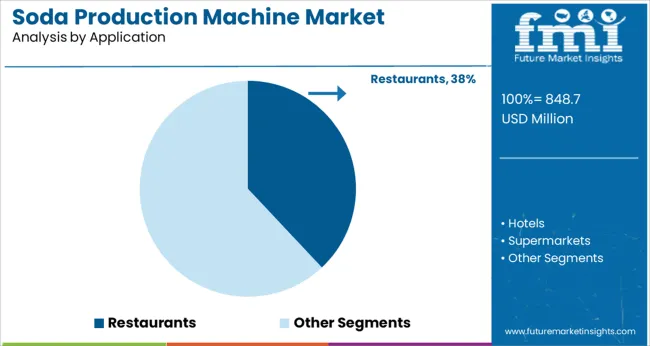
  • Restaurants - By Application Type

In the restaurant industry, soda production machines are used most often to provide customers with soft drinks. These machines typically use carbon dioxide and water to create the soda and can be programmed to make a variety of different flavors. The most common type of machine used in restaurants is the fountain soda machine, which is designed to dispense multiple drinks simultaneously.

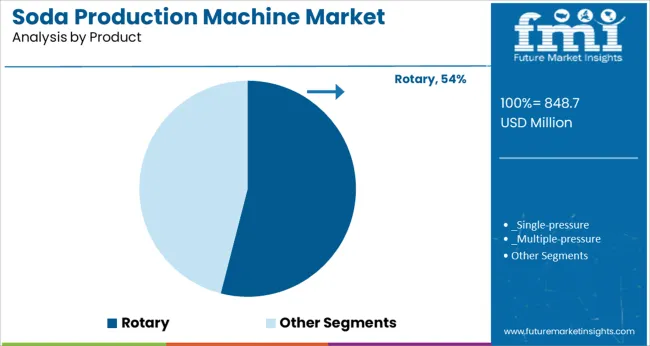
  • Rotary - By Product Type

There are two types of soda production machines: rotary and linear. Rotary machines are more common in small production facilities, while linear machines are used in large-scale operations. Both types of machines have their own advantages and disadvantages.

Rotary soda production machines are less expensive and easier to maintain than linear machines. However, they are not as efficient, and can only produce a limited amount of soda per hour. Linear soda production machines are more expensive, but they are much faster and can produce large quantities of soda per hour.

Adoption of Soda Production Machine can save the planet! - Key Aspects

Soda production machines reduce the cost of packaging and bottling and give higher profit margins to their owners. Furthermore, fine-dining restaurants, bars, and small-town diners have witnessed high adoption of soda production machines. In addition, most consumers consider it to be a fresh drink option, compared to the aerated drinks readily available in the market which are high in sugar.

By deploying soda production machines, the over manufacturing of plastic and glass containers is curbed which begets environmental protection. Moreover, the transportation cost for the delivery of bottle containers gets reduced by the incorporation of these soda production machines as well. Additionally, consumers are further attracted by the option to mix various flavors in a single drink.

Key players are focusing on innovative and attractive features that complement bars and kitchens such as manufacturing them using aluminum and stainless steel. In addition, the carbonated drinks made from these machines can be used as a sugar-free mixer option for cocktails. These factors are expected to drive the global soda production machine market growth.

How Demand for Soda Production Machine may Decline and What Manufacturers are Doing for the Future!

A lack of consumer awareness regarding the use or benefits of these machines is expected to restrain product demand. Moreover, the initial cost of these machines may be too high for people with limited disposable income, especially in developing economies. These factors are likely to be major challenges that impede the market growth.

On the contrary, manufacturers of soda production machines are focusing more on research and development (R&D) of the product, such as aiding the consumption of these carbonated drinks by blending them with certain food, which is anticipated to increase its demand in the culinary world. Moreover, they are also using lighter materials on these machines to make them more portable. These factors are anticipated to inspire creative opportunities in the market.
Country-wise Insights

Americans are shifting their soda preference towards sparkling water and seltzers!

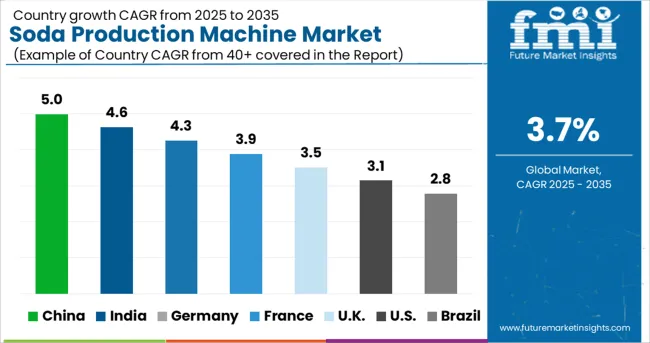
North America holds the largest share of the soda production machine market, with a revenue share of 34.4%. This is attributed to the growing number of health-conscious consumers who wish to reduce their intake of soft drinks and yet hydrate themselves. Moreover, most of these machines do not use sugar during processing which caters to their needs.

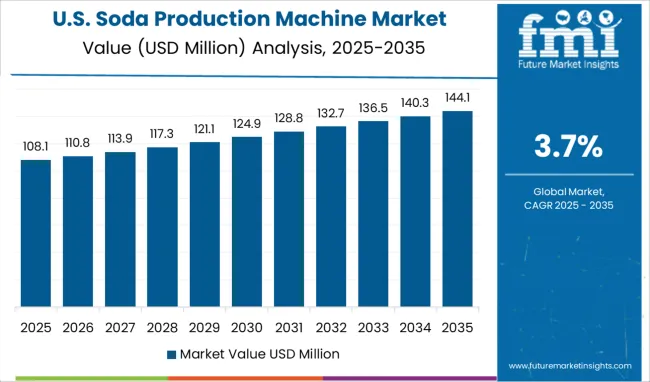
In the United States, the market has witnessed a shift from sugary soda drinks to healthier options like sparkling water and seltzer. Moreover, owing to the proliferation of smart kitchens across restaurants and households in the USA, the adoption of the soda production machine is likely to rise, especially among consumers with a reasonable per capita income.

Key players in the country produce compact soda production machines that are easily portable and can be packed into luggage for customers who travel around the year, especially for business. They are easy-to-use an appliance that can be utilized almost anywhere without the need for additional power. Furthermore, it saves customers the hassle of going for a bottled version of soda and soft drinks that are high in sugar content.

Owing to the rise in awareness regarding environmental sustainability, key players are manufacturing soda production machines using green materials. In addition, most of the machines are battery-operated, which makes them energy-efficient as well. These factors are estimated to surge the soda production machine market growth.

Integration of Innovative Features into Soda Machines by Market Players in the United Kingdom

Europe holds the second largest share of the air classifying mill market, with the United Kingdom being the most profitable market. Moreover, the United Kingdom holds a revenue share of 6.3% over the projection period. This is attributed to the growing demand for their strong manufacturing base and skilled workforce.

Owing to the presence of significant manufacturers in the United Kingdom, the key players are able to produce high-quality soda production machines at competitive prices. Additionally, the region has an extensive distribution network which ensures that products are available to consumers in all parts of the country.

Contrary to other countries, key players are in the United Kingdom. are known to incorporate smart technologies, such as the Smart Soda Sync, into the machines, which facilitates the process of making both carbonated and non-carbonated drinks. Moreover, these machines also have a small carbon footprint and customizable LED lighting patterns, which makes it simple kitchen vanity decor.

The demand for soda production machines is expected to increase, especially amongst the millennial population, as they are offered alternative beverage offerings, as well as multiple flavor options. In addition, they are available in different weight options that can either be permanently set on the kitchen vanity or carried along. These aspects contribute to the regional market share.

German manufacturers use robotic technology to manufacture soda production machines

Germany is a lucrative soda production machine market in Europe, owing to the use of flexible, cutting-edge robot technology used to develop these machines by the key manufacturers. This technology facilitates production through easy production, fully automatic product changeovers, exact reproducibility, and sustainability. Moreover, they aim to partner with small and medium-sized companies.

Key players in the country focus on using sustainable raw materials to reduce their carbon footprint. They ensure that the demand for soda production machines remains at an all-time high through the integration of various features such as a quick-lock bottle mechanism and low noise. These factors are estimated to expand the global market size.

Indians tend to follow the western culture which surges manufacturers to make high-quality devices

India is a growing soda production machine market with a revenue share of 6.1%. This is owing to the growth in the consumption of soda, coupled with the increasing awareness about environmental sustainability as well as the need for adequate hydration. Moreover, these machines are available at different prices for all kinds of customers.

High-quality soda machines are rising in demand as they make water intake more enjoyable, owing to the fizzy texture of the carbonated drinks they produce. Furthermore, key players manufacture these machines made from aluminum or stainless steel with attractive designs. Additionally, the machines can also be used to make seltzer water from taps, water filters, or any bottled water without harmful or sugar additives.

Consumers in India tend to be influenced by western culture, and owing to their changing lifestyle, the sales of soda production machine in the country is expected to increase in the forecast period. Furthermore, these machines are mostly battery-operated or require a simple plug-in and are built so they can fill any type of bottle or glass; and operates with a single push of a button. These factors are estimated to drive global market growth.

Get the data you need at a Fraction of the cost

Personalize your report by choosing insights you need
and save 40%!

New Entrants Revolutionizing the Start-up Economy

Somerville-based Hydration Labs - It launched an environmentally-friendly water cooler called Bevi, which dispenses flavoured water at offices, and has landed $1.56 million, according to a regulatory filing. It is estimated that they will develop a similar device that dispenses fizzy flavoured water. The equity investment, which appears to be the start-up's first, comes from about 30 undisclosed investors. Bevi is described as a machine that mixes still and sparkling drinks with healthy flavours and vitamins. The vending machines filter and bottle beverages at the point of use, instead of at a bottling plant. According to Greentown Labs, the start-up cuts the variable costs and carbon footprint of companies in the beverage vending industry by 80 per cent.
Competitive Landscape

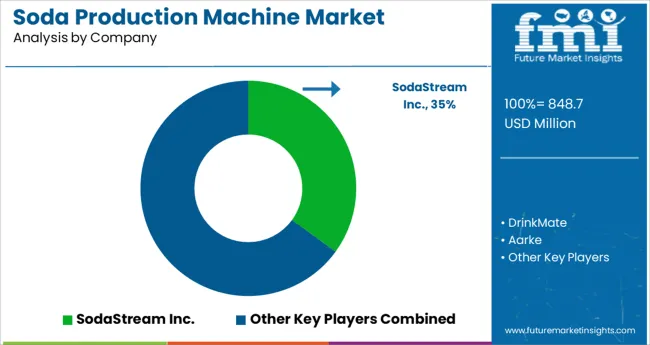
The global soda production machine market is highly competitive. The competition among these companies is intense as they constantly strive to gain market share through new product launches, innovative marketing campaigns, and expansion into new geographical regions.

  • In May 2018, The Coca-Cola Company launched a next-generation soda dispenser with a touch screen design for an easy and fast experience for the users.

Key players include

  • DrinkMate
  • Aarke
  • SodaStream Inc.
  • Drinkworks
  • Sparkel Beverage Systems
  • Mr. Butler
  • Nuvantee
  • Mysoda
  • Wild and Kind
  • iSi GmbH

Soda Production Machine Market Report Scope

Attribute Details
Forecast Period 2023 to 2033
Historical Data Available for 2018 to 2022
Market Analysis USD million for Value and Units for Volume
Key Regions Covered North America; Latin America; Europe; Asia Pacific; Oceania; Middle East and Africa (MEA)
Key Countries Covered The USA, Mexico, Canada, The United Kingdom, Germany, France, Italy, China, Spain, India, Japan, South Korea, Australia, Argentina, Brazil, South Africa, UAE
Key Segments Covered Product, Automation, Application, Region
Key Companies Profiled Aarke; DrinkMate; SodaStream Inc.; Drinkworks; Sparkel Beverage Systems; Mr. Butler; Nuvantee; Mysoda; Wild and Kind; iSi GmbH
Report Coverage Company Share Analysis, DROT Analysis, Market Dynamics and Challenges, Strategic Growth Initiatives, Market Forecast, Competitive Landscape,
Customization & Pricing Available upon Request

Soda Production Machine Market by Category

By Product, Soda Production Machine Market is segmented as:

  • Rotary
    • Single-pressure
    • Multiple-pressure
  • Linear
    • Single-stage
    • Two-stage

By Automation, Soda Production Machine Market is segmented as:

  • Automatic
  • Manual

By Application, Soda Production Machine Market is segmented as:

  • Hotels
  • Restaurants
  • Supermarkets
  • Convenience Stores

By Region, Soda Production Machine Market is segmented as:

  • North America
  • Latin America
  • Europe
  • Asia Pacific
  • Oceania
  • MEA

Frequently Asked Questions

How big is the Soda Production Machine Market?

The Soda Production Machine Market will reach nearly US$ 789.2 million by 2023.

At what rate Soda Production Machine Market is expected to grow?

The Soda Production Machine Market is expected to rise at a CAGR of 3.7%.

Which are the major countries driving the demand for Soda Production Machine Market?

the USA, the United Kingdom, China, and Germany are the major countries driving the demand for Soda Production Machines Market.

What is the Japan Soda Production Machine Market Outlook?

By the year 2023, Japan will account for 6.4% of the global market of Soda Production machines with a market value of US$ 50.5 Million.

What is the Australia Soda Production Machine Market Outlook?

By the year 2023, Australia will account for 3.6% of the global market of Soda Production machines with a market value of US$ 28.4 Million.

At what rate will Soda Production Machine Market grow in China?

The China Soda Production Machine Market will grow at 6.2% CAGR between 2023 and 2033.

Which companies dominate the market?

Aarke, DrinkMate, SodaStream Inc., Drinkworks, and Sparkel Beverage Systems are the companies dominating the Soda Production Machine Market.

What is the demand outlook forecast for the Soda Production Machine Market?

The global demand for Soda Production Machines Market is forecasted to surpass US$ 1,134.9 million by the year 2033.

Table of Content
1. Executive Summary | Soda Production Machine Market

    1.1. Global Market Outlook

    1.2. Demand-side Trends

    1.3. Supply-side Trends

    1.4. Technology Roadmap Analysis

    1.5. Analysis and Recommendations

2. Market Overview

    2.1. Market Coverage / Taxonomy

    2.2. Market Definition / Scope / Limitations

3. Market Background

    3.1. Market Dynamics

        3.1.1. Drivers

        3.1.2. Restraints

        3.1.3. Opportunity

        3.1.4. Trends

    3.2. Scenario Forecast

        3.2.1. Demand in Optimistic Scenario

        3.2.2. Demand in Likely Scenario

        3.2.3. Demand in Conservative Scenario

    3.3. Product launches & Recent Developments

    3.4. Product Life Cycle Analysis

    3.5. Value Chain Analysis

        3.5.1. Supply Side Participants and their Roles

            3.5.1.1. Producers

            3.5.1.2. Mid-Level Participants (Traders/ Agents/ Brokers)

            3.5.1.3. Wholesalers and Distributors

        3.5.2. % of Operating Margin Analysis

        3.5.3. List of Raw Material Suppliers

        3.5.4. List of Existing and Potential Buyers

    3.6. Global Market - Pricing Analysis

        3.6.1. Price Point Assessment by Region

        3.6.2. Price Point Assessment by Product Type

        3.6.3. Price Forecast till 2033

        3.6.4. Factors affecting pricing

    3.7. Forecast Factors - Relevance & Impact

    3.8. PESTLE and Porter’s Analysis

    3.9. Regulatory Landscape

        3.9.1. Packaging & Labelling Regulations

        3.9.2. Certifications and Certifying Agency Overview

        3.9.3. Import/Export Policies

    3.10. Regional Parent Market Outlook

    3.11. Production and Consumption Statistics

    3.12. Import and Export Statistics

    3.13. Consumers Survey Analysis

    3.14. Macro-Economic Factors

    3.15. Product Claims & Nutritional Information scanned by Buyers

4. Global Market Analysis 2018 to 2022 and Forecast, 2023 to 2033

    4.1. Historical Market Size Value (US$ million) & Volume (MT) Analysis, 2018 to 2022

    4.2. Current and Future Market Size Value (US$ million) & Volume (MT) Projections, 2023 to 2033

        4.2.1. Y-o-Y Growth Trend Analysis

        4.2.2. Absolute $ Opportunity Analysis

5. Global Market Analysis 2018 to 2022 and Forecast 2023 to 2033, By Product

    5.1. Introduction / Key Findings

    5.2. Historical Market Size Value (US$ million) & Volume (MT) Analysis By Product, 2018 to 2022

    5.3. Current and Future Market Size Value (US$ million) & Volume (MT) Analysis and Forecast By Product, 2023 to 2033

        5.3.1. Rotary

            5.3.1.1. Single-pressure

            5.3.1.2. Multiple-pressure

        5.3.2. Linear

            5.3.2.1. Single-stage

            5.3.2.2. Two-stage

    5.4. Y-o-Y Growth Trend Analysis By Product, 2018 to 2022

    5.5. Absolute $ Opportunity Analysis By Product, 2023 to 2033

6. Global Market Analysis 2018 to 2022 and Forecast 2023 to 2033, By Automation

    6.1. Introduction / Key Findings

    6.2. Historical Market Size Value (US$ million) & Volume (MT) Analysis By Automation, 2018 to 2022

    6.3. Current and Future Market Size Value (US$ million) & Volume (MT) Analysis and Forecast By Automation, 2023 to 2033

        6.3.1. Automatic

        6.3.2. Manual

    6.4. Y-o-Y Growth Trend Analysis By Automation, 2018 to 2022

    6.5. Absolute $ Opportunity Analysis By Automation, 2023 to 2033

7. Global Market Analysis 2018 to 2022 and Forecast 2023 to 2033, By Application

    7.1. Introduction / Key Findings

    7.2. Historical Market Size Value (US$ million) & Volume (MT) Analysis By Application, 2018 to 2022

    7.3. Current and Future Market Size Value (US$ million) & Volume (MT) Analysis and Forecast By Application, 2023 to 2033

        7.3.1. Hotels

        7.3.2. Restaurants

        7.3.3. Supermarkets

        7.3.4. Convenience Stores

    7.4. Y-o-Y Growth Trend Analysis By Application, 2018 to 2022

    7.5. Absolute $ Opportunity Analysis By Application, 2023 to 2033

8. Global Market Analysis 2018 to 2022 and Forecast 2023 to 2033, By Region

    8.1. Introduction

    8.2. Historical Market Size Value (US$ million) & Volume (MT) Analysis By Region, 2018 to 2022

    8.3. Current Market Size Value (US$ million) & Volume (MT) Analysis and Forecast By Region, 2023 to 2033

        8.3.1. North America

        8.3.2. Latin America

        8.3.3. Europe

        8.3.4. East Asia

        8.3.5. South Asia

        8.3.6. Oceania

        8.3.7. Middle East and Africa (MEA)

    8.4. Market Attractiveness Analysis By Region

9. North America Market Analysis 2018 to 2022 and Forecast 2023 to 2033, By Country

    9.1. Historical Market Size Value (US$ million) & Volume (MT) Trend Analysis By Market Taxonomy, 2018 to 2022

    9.2. Market Size Value (US$ million) & Volume (MT) Forecast By Market Taxonomy, 2023 to 2033

        9.2.1. By Country

            9.2.1.1. The USA

            9.2.1.2. Canada

        9.2.2. By Product

        9.2.3. By Automation

        9.2.4. By Application

    9.3. Market Attractiveness Analysis

        9.3.1. By Country

        9.3.2. By Product

        9.3.3. By Automation

        9.3.4. By Application

    9.4. Key Takeaways

10. Latin America Market Analysis 2018 to 2022 and Forecast 2023 to 2033, By Country

    10.1. Historical Market Size Value (US$ million) & Volume (MT) Trend Analysis By Market Taxonomy, 2018 to 2022

    10.2. Market Size Value (US$ million) & Volume (MT) Forecast By Market Taxonomy, 2023 to 2033

        10.2.1. By Country

            10.2.1.1. Brazil

            10.2.1.2. Mexico

            10.2.1.3. Argentina

            10.2.1.4. Chile

            10.2.1.5. Peru

            10.2.1.6. Rest of Latin America

        10.2.2. By Product

        10.2.3. By Automation

        10.2.4. By Application

    10.3. Market Attractiveness Analysis

        10.3.1. By Country

        10.3.2. By Product

        10.3.3. By Automation

        10.3.4. By Application

    10.4. Key Takeaways

11. Europe Market Analysis 2018 to 2022 and Forecast 2023 to 2033, By Country

    11.1. Historical Market Size Value (US$ million) & Volume (MT) Trend Analysis By Market Taxonomy, 2018 to 2022

    11.2. Market Size Value (US$ million) & Volume (MT) Forecast By Market Taxonomy, 2023 to 2033

        11.2.1. By Country

            11.2.1.1. Germany

            11.2.1.2. Italy

            11.2.1.3. France

            11.2.1.4. The United Kingdom

            11.2.1.5. Spain

            11.2.1.6. Russia

            11.2.1.7. BENELUX

            11.2.1.8. Poland

            11.2.1.9. Nordic Countries

            11.2.1.10. Rest of Europe

        11.2.2. By Product

        11.2.3. By Automation

        11.2.4. By Application

    11.3. Market Attractiveness Analysis

        11.3.1. By Country

        11.3.2. By Product

        11.3.3. By Automation

        11.3.4. By Application

    11.4. Key Takeaways

12. East Asia Market Analysis 2018 to 2022 and Forecast 2023 to 2033, By Country

    12.1. Historical Market Size Value (US$ million) & Volume (MT) Trend Analysis By Market Taxonomy, 2018 to 2022

    12.2. Market Size Value (US$ million) & Volume (MT) Forecast By Market Taxonomy, 2023 to 2033

        12.2.1. By Country

            12.2.1.1. China

            12.2.1.2. Japan

            12.2.1.3. South Korea

        12.2.2. By Product

        12.2.3. By Automation

        12.2.4. By Application

    12.3. Market Attractiveness Analysis

        12.3.1. By Country

        12.3.2. By Product

        12.3.3. By Automation

        12.3.4. By Application

    12.4. Key Takeaways

13. South Asia Market Analysis 2018 to 2022 and Forecast 2023 to 2033, By Country

    13.1. Historical Market Size Value (US$ million) & Volume (MT) Trend Analysis By Market Taxonomy, 2018 to 2022

    13.2. Market Size Value (US$ million) & Volume (MT) Forecast By Market Taxonomy, 2023 to 2033

        13.2.1. By Country

            13.2.1.1. India

            13.2.1.2. Thailand

            13.2.1.3. Malaysia

            13.2.1.4. Indonesia

            13.2.1.5. Singapore

            13.2.1.6. Rest of South Asia

        13.2.2. By Product

        13.2.3. By Automation

        13.2.4. By Application

    13.3. Market Attractiveness Analysis

        13.3.1. By Country

        13.3.2. By Product

        13.3.3. By Automation

        13.3.4. By Application

    13.4. Key Takeaways

14. Oceania Market Analysis 2018 to 2022 and Forecast 2023 to 2033, By Country

    14.1. Historical Market Size Value (US$ million) & Volume (MT) Trend Analysis By Market Taxonomy, 2018 to 2022

    14.2. Market Size Value (US$ million) & Volume (MT) Forecast By Market Taxonomy, 2023 to 2033

        14.2.1. By Country

            14.2.1.1. Australia

            14.2.1.2. New Zealand

        14.2.2. By Product

        14.2.3. By Automation

        14.2.4. By Application

    14.3. Market Attractiveness Analysis

        14.3.1. By Country

        14.3.2. By Product

        14.3.3. By Automation

        14.3.4. By Application

    14.4. Key Takeaways

15. MEA Market Analysis 2018 to 2022 and Forecast 2023 to 2033, By Country

    15.1. Historical Market Size Value (US$ million) & Volume (MT) Trend Analysis By Market Taxonomy, 2018 to 2022

    15.2. Market Size Value (US$ million) & Volume (MT) Forecast By Market Taxonomy, 2023 to 2033

        15.2.1. By Country

            15.2.1.1. GCC Countries

            15.2.1.2. South Africa

            15.2.1.3. Central Africa

            15.2.1.4. North Africa

        15.2.2. By Product

        15.2.3. By Automation

        15.2.4. By Application

    15.3. Market Attractiveness Analysis

        15.3.1. By Country

        15.3.2. By Product

        15.3.3. By Automation

        15.3.4. By Application

    15.4. Key Takeaways

16. Key Countries Market Analysis

    16.1. The USA

        16.1.1. Pricing Analysis

        16.1.2. Market Share Analysis, 2022

            16.1.2.1. By Product

            16.1.2.2. By Automation

            16.1.2.3. By Application

    16.2. Canada

        16.2.1. Pricing Analysis

        16.2.2. Market Share Analysis, 2022

            16.2.2.1. By Product

            16.2.2.2. By Automation

            16.2.2.3. By Application

    16.3. Brazil

        16.3.1. Pricing Analysis

        16.3.2. Market Share Analysis, 2022

            16.3.2.1. By Product

            16.3.2.2. By Automation

            16.3.2.3. By Application

    16.4. Mexico

        16.4.1. Pricing Analysis

        16.4.2. Market Share Analysis, 2022

            16.4.2.1. By Product

            16.4.2.2. By Automation

            16.4.2.3. By Application

    16.5. Argentina

        16.5.1. Pricing Analysis

        16.5.2. Market Share Analysis, 2022

            16.5.2.1. By Product

            16.5.2.2. By Automation

            16.5.2.3. By Application

    16.6. Chile

        16.6.1. Pricing Analysis

        16.6.2. Market Share Analysis, 2022

            16.6.2.1. By Product

            16.6.2.2. By Automation

            16.6.2.3. By Application

    16.7. Peru

        16.7.1. Pricing Analysis

        16.7.2. Market Share Analysis, 2022

            16.7.2.1. By Product

            16.7.2.2. By Automation

            16.7.2.3. By Application

    16.8. Germany

        16.8.1. Pricing Analysis

        16.8.2. Market Share Analysis, 2022

            16.8.2.1. By Product

            16.8.2.2. By Automation

            16.8.2.3. By Application

    16.9. Italy

        16.9.1. Pricing Analysis

        16.9.2. Market Share Analysis, 2022

            16.9.2.1. By Product

            16.9.2.2. By Automation

            16.9.2.3. By Application

    16.10. France

        16.10.1. Pricing Analysis

        16.10.2. Market Share Analysis, 2022

            16.10.2.1. By Product

            16.10.2.2. By Automation

            16.10.2.3. By Application

    16.11. Spain

        16.11.1. Pricing Analysis

        16.11.2. Market Share Analysis, 2022

            16.11.2.1. By Product

            16.11.2.2. By Automation

            16.11.2.3. By Application

    16.12. The United Kingdom

        16.12.1. Pricing Analysis

        16.12.2. Market Share Analysis, 2022

            16.12.2.1. By Product

            16.12.2.2. By Automation

            16.12.2.3. By Application

    16.13. Russia

        16.13.1. Pricing Analysis

        16.13.2. Market Share Analysis, 2022

            16.13.2.1. By Product

            16.13.2.2. By Automation

            16.13.2.3. By Application

    16.14. Poland

        16.14.1. Pricing Analysis

        16.14.2. Market Share Analysis, 2022

            16.14.2.1. By Product

            16.14.2.2. By Automation

            16.14.2.3. By Application

    16.15. BENELUX

        16.15.1. Pricing Analysis

        16.15.2. Market Share Analysis, 2022

            16.15.2.1. By Product

            16.15.2.2. By Automation

            16.15.2.3. By Application

    16.16. Nordic Countries

        16.16.1. Pricing Analysis

        16.16.2. Market Share Analysis, 2022

            16.16.2.1. By Product

            16.16.2.2. By Automation

            16.16.2.3. By Application

    16.17. China

        16.17.1. Pricing Analysis

        16.17.2. Market Share Analysis, 2022

            16.17.2.1. By Product

            16.17.2.2. By Automation

            16.17.2.3. By Application

    16.18. Japan

        16.18.1. Pricing Analysis

        16.18.2. Market Share Analysis, 2022

            16.18.2.1. By Product

            16.18.2.2. By Automation

            16.18.2.3. By Application

    16.19. South Korea

        16.19.1. Pricing Analysis

        16.19.2. Market Share Analysis, 2022

            16.19.2.1. By Product

            16.19.2.2. By Automation

            16.19.2.3. By Application

    16.20. India

        16.20.1. Pricing Analysis

        16.20.2. Market Share Analysis, 2022

            16.20.2.1. By Product

            16.20.2.2. By Automation

            16.20.2.3. By Application

    16.21. Thailand

        16.21.1. Pricing Analysis

        16.21.2. Market Share Analysis, 2022

            16.21.2.1. By Product

            16.21.2.2. By Automation

            16.21.2.3. By Application

    16.22. Indonesia

        16.22.1. Pricing Analysis

        16.22.2. Market Share Analysis, 2022

            16.22.2.1. By Product

            16.22.2.2. By Automation

            16.22.2.3. By Application

    16.23. Malaysia

        16.23.1. Pricing Analysis

        16.23.2. Market Share Analysis, 2022

            16.23.2.1. By Product

            16.23.2.2. By Automation

            16.23.2.3. By Application

    16.24. Singapore

        16.24.1. Pricing Analysis

        16.24.2. Market Share Analysis, 2022

            16.24.2.1. By Product

            16.24.2.2. By Automation

            16.24.2.3. By Application

    16.25. Australia

        16.25.1. Pricing Analysis

        16.25.2. Market Share Analysis, 2022

            16.25.2.1. By Product

            16.25.2.2. By Automation

            16.25.2.3. By Application

    16.26. New Zealand

        16.26.1. Pricing Analysis

        16.26.2. Market Share Analysis, 2022

            16.26.2.1. By Product

            16.26.2.2. By Automation

            16.26.2.3. By Application

    16.27. GCC Countries

        16.27.1. Pricing Analysis

        16.27.2. Market Share Analysis, 2022

            16.27.2.1. By Product

            16.27.2.2. By Automation

            16.27.2.3. By Application

    16.28. South Africa

        16.28.1. Pricing Analysis

        16.28.2. Market Share Analysis, 2022

            16.28.2.1. By Product

            16.28.2.2. By Automation

            16.28.2.3. By Application

    16.29. North Africa

        16.29.1. Pricing Analysis

        16.29.2. Market Share Analysis, 2022

            16.29.2.1. By Product

            16.29.2.2. By Automation

            16.29.2.3. By Application

    16.30. Central Africa

        16.30.1. Pricing Analysis

        16.30.2. Market Share Analysis, 2022

            16.30.2.1. By Product

            16.30.2.2. By Automation

            16.30.2.3. By Application

17. Market Structure Analysis

    17.1. Competition Dashboard

    17.2. Competition Benchmarking

    17.3. Market Share Analysis of Top Players

        17.3.1. By Regional

        17.3.2. By Product

        17.3.3. By Automation

        17.3.4. By Application

18. Competition Analysis

    18.1. Competition Deep Dive

        18.1.1. Aarke

            18.1.1.1. Overview

            18.1.1.2. Product Portfolio

            18.1.1.3. Profitability by Market Segments (Product/Automation/Application/Region)

            18.1.1.4. Sales Footprint

            18.1.1.5. Strategy Overview

                18.1.1.5.1. Marketing Strategy

                18.1.1.5.2. Product Strategy

                18.1.1.5.3. Channel Strategy

        18.1.2. DrinkMate

            18.1.2.1. Overview

            18.1.2.2. Product Portfolio

            18.1.2.3. Profitability by Market Segments (Product/Automation/Application/Region)

            18.1.2.4. Sales Footprint

            18.1.2.5. Strategy Overview

                18.1.2.5.1. Marketing Strategy

                18.1.2.5.2. Product Strategy

                18.1.2.5.3. Channel Strategy

        18.1.3. SodaStream Inc.

            18.1.3.1. Overview

            18.1.3.2. Product Portfolio

            18.1.3.3. Profitability by Market Segments (Product/Automation/Application/Region)

            18.1.3.4. Sales Footprint

            18.1.3.5. Strategy Overview

                18.1.3.5.1. Marketing Strategy

                18.1.3.5.2. Product Strategy

                18.1.3.5.3. Channel Strategy

        18.1.4. Drinkworks

            18.1.4.1. Overview

            18.1.4.2. Product Portfolio

            18.1.4.3. Profitability by Market Segments (Product/Automation/Application/Region)

            18.1.4.4. Sales Footprint

            18.1.4.5. Strategy Overview

                18.1.4.5.1. Marketing Strategy

                18.1.4.5.2. Product Strategy

                18.1.4.5.3. Channel Strategy

        18.1.5. Sparkel Beverage Systems

            18.1.5.1. Overview

            18.1.5.2. Product Portfolio

            18.1.5.3. Profitability by Market Segments (Product/Automation/Application/Region)

            18.1.5.4. Sales Footprint

            18.1.5.5. Strategy Overview

                18.1.5.5.1. Marketing Strategy

                18.1.5.5.2. Product Strategy

                18.1.5.5.3. Channel Strategy

        18.1.6. Mr. Butler

            18.1.6.1. Overview

            18.1.6.2. Product Portfolio

            18.1.6.3. Profitability by Market Segments (Product/Automation/Application/Region)

            18.1.6.4. Sales Footprint

            18.1.6.5. Strategy Overview

                18.1.6.5.1. Marketing Strategy

                18.1.6.5.2. Product Strategy

                18.1.6.5.3. Channel Strategy

        18.1.7. Nuvantee

            18.1.7.1. Overview

            18.1.7.2. Product Portfolio

            18.1.7.3. Profitability by Market Segments (Product/Automation/Application/Region)

            18.1.7.4. Sales Footprint

            18.1.7.5. Strategy Overview

                18.1.7.5.1. Marketing Strategy

                18.1.7.5.2. Product Strategy

                18.1.7.5.3. Channel Strategy

        18.1.8. Mysoda

            18.1.8.1. Overview

            18.1.8.2. Product Portfolio

            18.1.8.3. Profitability by Market Segments (Product/Automation/Application/Region)

            18.1.8.4. Sales Footprint

            18.1.8.5. Strategy Overview

                18.1.8.5.1. Marketing Strategy

                18.1.8.5.2. Product Strategy

                18.1.8.5.3. Channel Strategy

        18.1.9. Wild and Kind

            18.1.9.1. Overview

            18.1.9.2. Product Portfolio

            18.1.9.3. Profitability by Market Segments (Product/Automation/Application/Region)

            18.1.9.4. Sales Footprint

            18.1.9.5. Strategy Overview

                18.1.9.5.1. Marketing Strategy

                18.1.9.5.2. Product Strategy

                18.1.9.5.3. Channel Strategy

        18.1.10. iSi GmbH

            18.1.10.1. Overview

            18.1.10.2. Product Portfolio

            18.1.10.3. Profitability by Market Segments (Product/Automation/Application/Region)

            18.1.10.4. Sales Footprint

            18.1.10.5. Strategy Overview

                18.1.10.5.1. Marketing Strategy

                18.1.10.5.2. Product Strategy

                18.1.10.5.3. Channel Strategy

19. Assumptions & Acronyms Used

20. Research Methodology

Explore Process Automation Insights

View Reports
Future Market Insights

Soda Production Machine Market