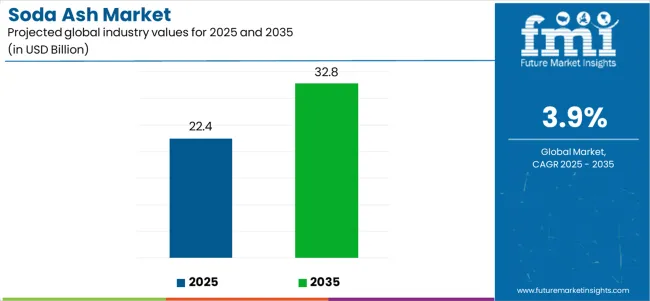
The soda ash market is expected to grow from USD 22.4 billion in 2025 to USD 32.8 billion by 2035, representing substantial growth, demonstrating the accelerating demand for industrial alkali chemicals and glass production materials across container glass, flat glass, and specialty manufacturing sectors.
The first half of the decade (2025-2030) will see the market increase from USD 22.4 billion to approximately USD 27.1 billion, adding USD 4.7 billion in value, which constitutes 45.6% of the total forecasted growth period. This phase will be characterized by the expansion of natural soda ash production capacity, driven by increasing glass manufacturing volumes and the growing need for sustainable chemical production processes worldwide. Natural trona-based production methods and low-carbon manufacturing capabilities will become standard expectations rather than premium options.
The latter half (2030-2035) will witness sustained growth from USD 27.1 billion to USD 32.8 billion, representing an addition of USD 5.6 billion or 54.4% of the decade's expansion. This period will be defined by mass market penetration of sustainable soda ash production technologies, integration with comprehensive glass manufacturing platforms, and seamless compatibility with environmental compliance infrastructure. The market trajectory signals fundamental shifts in how glass manufacturers and chemical processors approach raw material sourcing optimization and production sustainability management, with participants positioned to benefit from sustained demand across multiple production routes and application segments.
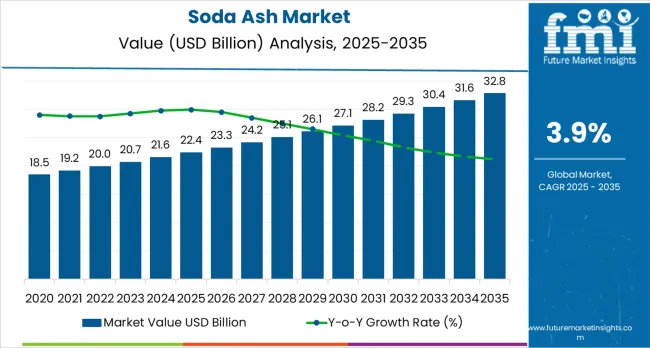
The soda ash market demonstrates distinct growth phases with varying market characteristics and competitive dynamics. Between 2025 and 2030, the market progresses through its capacity expansion phase, growing from USD 22.4 billion to USD 27.1 billion with steady annual increments averaging 3.9% growth. This period showcases the transition from traditional Solvay process production to advanced natural soda ash systems with enhanced environmental performance and integrated sustainability features becoming mainstream characteristics.
The 2025-2030 phase adds USD 4.7 billion to market value, representing 45.6% of total decade expansion. Market maturation factors include the standardization of glass manufacturing protocols, the expansion of natural trona production capacity, and an increasing industrial awareness of the cost advantages, resulting in 30-37% lower greenhouse gas emissions in natural production compared to synthetic methods. The competitive landscape during this period features established chemical companies, such as Solvay and Ciner Group, expanding their production portfolios, while natural soda ash producers focus on capacity development and enhanced sustainability capabilities.
From 2030 to 2035, market dynamics shift toward advanced environmental integration and global glass production expansion, with growth continuing from USD 27.1 billion to USD 32.8 billion, representing an addition of USD 5.6 billion, or 54.4% of the total expansion. This phase transition focuses on low-carbon production systems, integration with renewable energy manufacturing networks, and deployment across diverse glass and chemical production scenarios, making them standard rather than specialized applications. The competitive environment matures with focus shifting from basic production capability to comprehensive sustainability optimization systems and integration with circular economy platforms.
At-a-Glance Metrics
| Metric | Value |
|---|---|
| Market Value (2025) | USD 22.4 billion |
|
Market Forecast (2035) |
USD 32.8 billion |
| Growth Rate | 3.9% CAGR |
| Leading Production Route | Natural (Trona-based) |
| Primary End Use | Glass &Ceramics Segment |
The market demonstrates strong fundamentals with natural soda ash systems capturing a dominant share through lower-cost production and environmental sustainability capabilities. Glass &ceramics applications drive primary demand, supported by increasing construction activity and automotive glass manufacturing requirements. Geographic expansion remains concentrated in regions with natural trona deposits, while emerging economies show accelerating adoption rates driven by glass manufacturing expansion and rising industrial chemical standards.
Market expansion rests on three fundamental shifts driving adoption across the glass manufacturing and industrial chemicals sectors. First, glass production demand creates compelling operational advantages through soda ash that provides immediate melting temperature reduction without production delays, enabling glass manufacturers to meet quality standards while maintaining manufacturing productivity and reducing energy costs. Second, detergent manufacturing modernization accelerates as production facilities worldwide seek efficient alkali sources that complement formulation processes, enabling precise pH control and cleaning efficacy that align with consumer product standards and environmental regulations. Third, water treatment infrastructure enhancement drives adoption from municipal utilities and industrial facilities requiring effective pH adjustment solutions that minimize chemical consumption while maintaining operational productivity during treatment operations.
However, growth faces headwinds from production cost challenges that vary across regions regarding the availability of natural trona deposits versus synthetic production infrastructure, which may limit cost advantages in markets dependent on Solvay process facilities. Environmental considerations also persist regarding carbon dioxide emissions from synthetic production that may reduce competitiveness compared to natural soda ash alternatives, affecting market share distribution and regional supply dynamics.
The soda ash market represents a critical industrial chemical opportunity driven by expanding global glass manufacturing, construction sector growth, and the need for cost-effective alkali supply in diverse manufacturing processes. As glass manufacturers worldwide seek to achieve optimal melting efficiency, reduce production costs, and integrate sustainable production technologies, soda ash is evolving from a basic commodity chemical to a strategic raw material that ensures production quality and operational efficiency. The market's growth trajectory is projected to increase from USD 22.4 billion in 2025 to USD 32.8 billion by 2035 at a 3.9% CAGR reflects fundamental shifts in glass manufacturing requirements and sustainable chemical production optimization. Geographic expansion opportunities are particularly pronounced in Asia-Pacific markets, where China (5.1% CAGR) and India (4.5% CAGR) lead the way through aggressive flat glass capacity expansion and infrastructure development. The dominance of glass &ceramics applications (52.0% market share) and natural trona-based production (61.0% share) provides clear strategic focus areas.
Strengthening the dominant glass &ceramics segment (52.0% market share) through enhanced supply reliability, superior quality specifications, and sustainable sourcing integration with flat glass and container glass manufacturing infrastructure. Market leadership consolidation through long-term supply agreements and quality consistency enables premium positioning while defending competitive advantages against alternative flux agents. Expected revenue pool: USD 170-250 million
Rapid natural soda ash production growth through trona deposit exploitation in Wyoming, Turkey, and emerging regions creates substantial opportunities through capacity additions and solution mining optimization. Growing environmental consciousness and carbon footprint reduction mandates drive sustained demand for low-carbon natural soda ash systems, with 37% lower greenhouse gas emissions than synthetic alternatives. Expected revenue pool: USD 140-210 million
Expansion within the high-growth Asia-Pacific market through localized production capabilities, logistics optimization, and comprehensive technical support for Chinese and Indian glass manufacturers. Strategic positioning reflects an understanding of regional requirements and consistent delivery performance. Expected revenue pool: USD 130-190 million
Strategic expansion into environmentally superior production methods requires carbon footprint reduction, renewable energy integration, and specialized technologies addressing sustainability requirements. Premium positioning reflects specialized environmental credentials and comprehensive sustainability documentation necessary for green building applications. Expected revenue pool: USD 100-160 million
Development of specialized dense soda ash grades addressing flat glass manufacturing requirements (35.0% segment share) and container glass specifications (19.0%). Technology differentiation through proprietary processing methods and application-specific optimization enables diversified revenue streams. Expected revenue pool: USD 95-150 million
Integration of light soda ash systems (38.0% density share) with detergent manufacturing platforms and household cleaning applications, enabling consistent alkalinity supply and cost optimization. Strategic positioning through application expertise creates opportunities for long-term supply agreements. Expected revenue pool: USD 85-140 million
Development of soda ash systems addressing water treatment requirements (6.0% end-use share), pH adjustment applications, and environmental compliance across municipal utilities and industrial wastewater processing. Premium positioning reflects regulatory expertise and reliable supply performance. Expected revenue pool: USD 65-110 million
Primary Classification: The market segments by end use into Glass &Ceramics, Soaps &Detergents, Chemicals, Water Treatment, and Metallurgy &Other sectors, representing the evolution from traditional glass manufacturing applications to diversified industrial chemical solutions for comprehensive processing optimization.
Secondary Classification: Production route segmentation divides the market into Natural (Trona-based) and Synthetic (Solvay/Other) categories, reflecting distinct requirements for cost efficiency, environmental impact, and regional production capacity.
Tertiary Classification: Density segmentation covers Dense Soda Ash and Light Soda Ash, with dense grades primarily serving glass manufacturing while light grades target detergent and chemical applications.
The segmentation structure reveals market evolution from basic alkali chemical supply toward specialized production systems with enhanced sustainability and cost optimization capabilities, while application diversity spans from glass production to water treatment requiring precise chemical specifications.
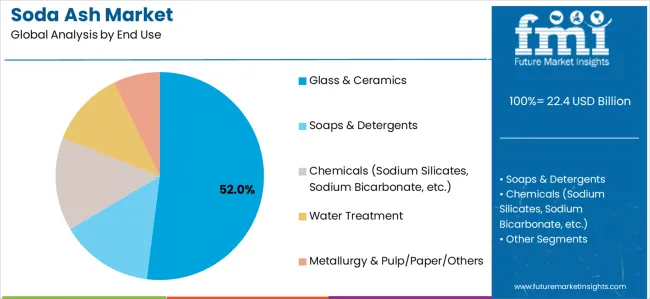
Market Position: Glass &ceramics applications command the leading position in the soda ash market with approximately 52.0% market share through essential glass manufacturing features, including melting temperature reduction, chemical stability provision, and production optimization that enable manufacturers to achieve optimal glass formation across diverse automotive, construction, and container glass manufacturing environments.
Value Drivers: The segment benefits from glass manufacturer preference for reliable chemical systems that provide consistent melting flux action, reduced energy consumption, and manufacturing efficiency optimization without requiring significant process modifications. Soda ash acts as the essential fluxing agent in soda-lime silica glass production, enabling furnace temperature reduction and integration with existing glass manufacturing equipment, where chemical performance and thermal efficiency represent critical operational requirements.
Competitive Advantages: Soda ash differentiates through proven melting point reduction capability, consistent alkali supply characteristics, and integration with automated glass manufacturing systems that enhance operational effectiveness while maintaining optimal glass quality suitable for diverse automotive and construction applications.
Key market characteristics:
Soaps &detergents applications maintain a significant 19.0% market share in the soda ash market due to their essential role in providing alkalinity and cleaning effectiveness. These applications appeal to detergent manufacturers requiring pH adjustment capabilities with cost-effective formulation advantages for high-volume consumer product production. Market growth is driven by household cleaning product expansion, emphasizing effective alkaline solutions and operational efficiency through optimized chemical formulation systems.
Chemicals applications hold approximately 12.0% market share, focusing on sodium silicate production, sodium bicarbonate manufacturing, and specialty chemical synthesis. These formulations demand reliable alkali sources for diverse industrial processes and chemical synthesis scenarios requiring superior chemical purity characteristics.
Water treatment systems account for approximately 6.0% market share through pH adjustment applications in municipal utilities and industrial wastewater processing. The segment focuses on cost-effective alkalinity supply and regulatory compliance requirements for water quality management.
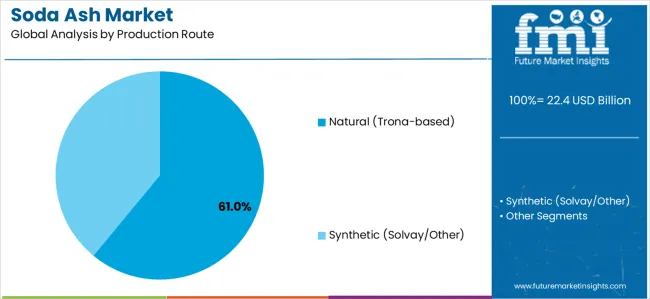
Market Context: Natural soda ash production dominates the soda ash market with approximately 61.0% market share due to widespread adoption of trona-based systems and increasing focus on cost optimization, environmental performance management, and sustainable production applications that minimize carbon emissions while maintaining chemical quality standards.
Appeal Factors: Natural soda ash producers prioritize cost competitiveness, lower carbon footprint, and integration with existing glass manufacturing infrastructure that enables coordinated chemical supply across multiple production regions. The segment benefits from substantial resource availability in Wyoming, USA and Turkey regions that emphasize the extraction of high-purity trona deposits for environmental and cost efficiency applications.
Growth Drivers: Natural trona extraction programs incorporate sustainable solution mining technologies as standard methods for mineral production operations, while glass manufacturing industry growth increases demand for low-carbon soda ash capabilities that comply with environmental standards and minimize greenhouse gas emissions.
Market Characteristics: Wyoming's Green River Basin supplies approximately 90% of North American soda ash production, representing 36.0% of global natural soda ash market share. Turkey and Central Asia natural production accounts for 20.0% global share, with other natural deposits contributing 5.0%.
Application dynamics include:
Synthetic soda ash production captures approximately 39.0% market share through established Solvay process facilities in regions lacking natural trona deposits, including European and Asian manufacturing centers. These facilities demand comprehensive chemical engineering capabilities capable of operating in integrated production environments while providing consistent soda ash quality and regional supply security.
Growth Accelerators: Glass manufacturing expansion drives primary adoption as soda ash provides melting temperature reduction capabilities that enable glass producers to achieve optimal furnace efficiency without excessive energy consumption, supporting manufacturing operations and construction industry missions that require precise glass formation applications. Container glass demand accelerates market expansion as packaging manufacturers seek sustainable materials that minimize environmental impact while maintaining product protection effectiveness during storage and distribution scenarios. Industrial chemical spending increases worldwide, creating sustained demand for alkali systems that support diverse manufacturing processes and provide operational flexibility in complex chemical production environments.
Growth Inhibitors: Production cost challenges vary across regions regarding the availability of natural trona deposits versus synthetic production infrastructure, which may limit operational flexibility and market penetration in areas with established Solvay process facilities or cost-sensitive manufacturing operations. Environmental performance considerations persist regarding carbon dioxide emissions from synthetic production that may reduce competitiveness compared to natural alternatives, affecting market share distribution and regional supply dynamics. Market fragmentation across multiple quality specifications and density requirements creates compatibility concerns between different production methods and existing manufacturing infrastructure.
Market Evolution Patterns: Adoption accelerates in glass manufacturing and detergent production sectors where cost advantages justify raw material selection, with geographic concentration in natural trona regions transitioning toward sustainable production adoption in emerging economies driven by environmental regulations and manufacturing development. Technology development focuses on low-carbon production processes, improved solution mining techniques, and integration with renewable energy systems that optimize resource extraction and operational sustainability. The market could face disruption if alternative glass manufacturing technologies or environmental regulations significantly limit the deployment of high-carbon synthetic production in chemical or glass manufacturing applications.
The soda ash market demonstrates varied regional dynamics with Growth Leaders including China (5.1% CAGR) and India (4.5% CAGR) driving expansion through flat glass capacity additions and detergent manufacturing development. Steady Performers encompass Turkey (3.8% CAGR), United States (2.6% CAGR), and Germany (2.4% CAGR), benefiting from established natural production capabilities and advanced glass manufacturing adoption. Mature Markets feature Poland (2.9% CAGR) and the United Kingdom (2.1% CAGR), where specialized construction glass applications and water treatment infrastructure integration support consistent growth patterns.
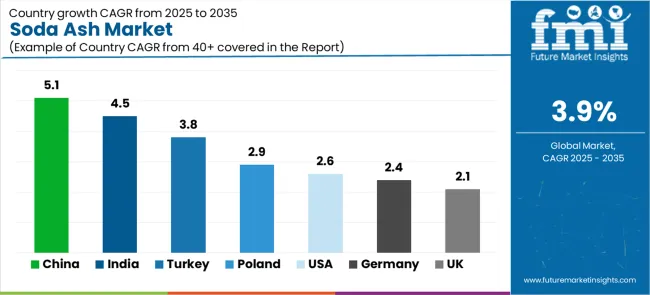
| Country | CAGR (2025-2035) |
|---|---|
| China | 5.1% |
| India | 4.5% |
| Turkey | 3.8% |
| United States | 2.6% |
| Germany | 2.4% |
| Poland | 2.9% |
| United Kingdom | 2.1% |
Regional synthesis reveals Asia-Pacific markets leading adoption through glass manufacturing expansion and construction activity development, while North American countries maintain steady expansion supported by natural soda ash production capabilities and manufacturing standardization requirements. European markets show moderate growth driven by industrial chemical applications and environmental technology integration trends.
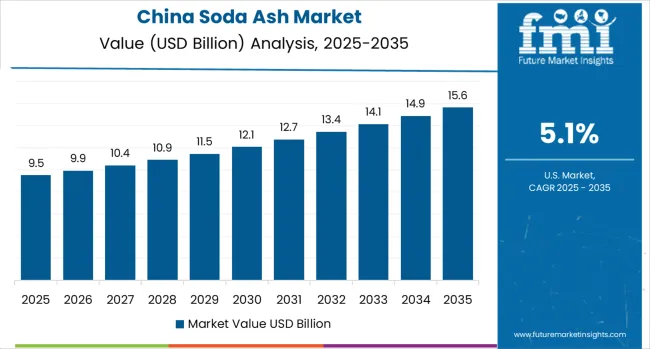
China establishes market leadership through aggressive flat glass and solar glass capacity programs and comprehensive construction infrastructure development, integrating soda ash as standard raw material in automotive glass production and container glass manufacturing installations. The country's 5.1% CAGR reflects government initiatives promoting manufacturing capabilities and domestic industrial development that mandate the use of cost-effective chemical systems in glass manufacturing and construction material production facilities. Growth concentrates in major industrial centers where glass manufacturing technology development showcases integrated soda ash procurement that appeals to domestic producers seeking advanced production optimization capabilities and manufacturing efficiency applications.
Chinese glass manufacturers are developing large-scale production capacity that combines domestic soda ash supply advantages with advanced melting features, including automated batch preparation systems and enhanced energy efficiency capabilities. Distribution channels through industrial chemical suppliers and glass manufacturing distributors expand market access, while government support for construction development supports adoption across diverse flat glass and container glass manufacturing segments.
Strategic Market Indicators:
In Mumbai, Surat, and Ahmedabad, glass manufacturing facilities and detergent production plants are implementing soda ash procurement as standard raw material for production optimization and cost management applications, driven by increasing industrial investment and manufacturing modernization programs that emphasize the importance of reliable alkali chemical capabilities. The market demonstrates a 4.5% CAGR, supported by government manufacturing initiatives and infrastructure development programs that promote domestic chemical production for glass manufacturing and detergent production facilities. Indian manufacturers are adopting soda ash systems that provide consistent chemical quality and cost-effective pricing, particularly appealing in industrial regions where manufacturing efficiency and raw material costs represent critical operational requirements.
Market expansion benefits from growing domestic production capabilities through GHCL's new 0.5 MTPA greenfield facility near Mandvi, Kutch (Gujarat) and Tata Chemicals'established operations that enable local supply of advanced soda ash products for manufacturing applications. Technology adoption follows patterns established in industrial chemicals, where quality and cost-effectiveness drive procurement decisions and operational deployment.
Market Intelligence Brief:
Turkey's natural soda ash market demonstrates sophisticated production capabilities with documented operational effectiveness in trona extraction and processing operations through integration with existing solution mining systems and production infrastructure. The country leverages geological advantages in Ankara's Kazan region to maintain a 3.8% CAGR through natural resource availability. Kazan Soda operates one of the world's largest natural soda ash facilities with 2.9 million tonnes annual production capacity producing 99.8% purity soda ash, the purest globally. Industrial centers showcase premium installations where soda ash production integrates with comprehensive glass manufacturing export platforms and regional chemical distribution systems to optimize market access and supply effectiveness.
Turkish producers prioritize solution mining sustainability and regional export integration in production development, creating supply capabilities for premium natural soda ash with advanced purity features, including automated processing systems and environmental compliance capabilities. The market benefits from established trona deposit infrastructure and competitive positioning in European and Middle Eastern glass manufacturing markets that provide long-term supply advantages.
Market Intelligence Brief:
The USA market emphasizes natural trona extraction leadership, including comprehensive solution mining capabilities and integration with established glass manufacturing platforms that manage production capacity, quality optimization, and cost control applications through unified supply systems. The country maintains a 2.6% CAGR, driven by Wyoming's Green River Basin production and stable flat glass demand that support natural soda ash integration. American producers prioritize operational reliability with soda ash systems delivering consistent chemical specifications through advanced solution mining technologies and production optimization capabilities.
Wyoming's trona deposits supply approximately 90% of USA soda ash production from the world's largest known resource of 127 billion tons, with 40 billion tons estimated recoverable. Genesis Alkali (now part of WE Soda following February 2025 acquisition) operates Westvaco underground mine and Granger solution mining facility with combined 4.35 million mtpa capacity, producing Ecosoda™ low-carbon natural soda ash with 37% lower greenhouse gas emissions than synthetic alternatives.
Performance Metrics:
Germany demonstrates steady market development with a 2.4% CAGR, distinguished by glass manufacturing facilities'preference for high-quality soda ash systems that integrate seamlessly with automotive glass production and provide reliable long-term supply in specialized flat glass manufacturing applications. The market prioritizes advanced applications, including high-value automotive laminated glass, insulation glass production, and integration with comprehensive chemical platforms that reflect German industrial expectations for quality standards and operational excellence.
In Poland, industrial facilities and glass manufacturing plants are implementing soda ash procurement to enhance production optimization capabilities and support container glass operations that align with regional manufacturing development and EU quality standards. The Polish market demonstrates a 2.9% CAGR, driven by regional glass manufacturing expansion and chemical production equipment upgrades that emphasize soda ash systems for container production and soda silicate manufacturing applications. Polish manufacturers are prioritizing soda ash procurement that provides consistent chemical quality while maintaining EU compliance and minimizing production costs, particularly important in glass manufacturing operations and chemical synthesis facilities.
CIECH SA serves as Europe's largest sodium silicate provider and leading Polish soda ash producer with comprehensive chemical portfolios including light and dense grades serving glass, detergent, and industrial markets. Market expansion benefits from EU chemical procurement programs that support production quality capabilities in manufacturing equipment specifications, creating sustained demand across Poland's glass manufacturing and chemical sectors.
Strategic Market Indicators:
In Birmingham, Manchester, and other manufacturing centers, British glass production facilities and water treatment operations are implementing soda ash procurement to enhance manufacturing capabilities and support container glass operations that align with environmental regulations and sustainability standards. The UK market maintains a 2.1% CAGR, driven by construction glass modernization programs and water utility upgrades that emphasize soda ash systems for pH control and glass production applications. British manufacturers are prioritizing soda ash procurement that provides consistent chemical performance while maintaining regulatory compliance and supporting sustainability objectives, particularly important in water treatment operations and glass manufacturing facilities.
Market expansion benefits from environmental management programs that mandate chemical performance capabilities in utility specifications, creating sustained demand across the UK's water treatment and glass manufacturing sectors, where operational flexibility and chemical reliability represent critical requirements. The regulatory framework supports soda ash adoption through water quality standards and construction material requirements that promote reliable chemical systems aligned with production quality management capabilities.
Strategic Market Indicators:
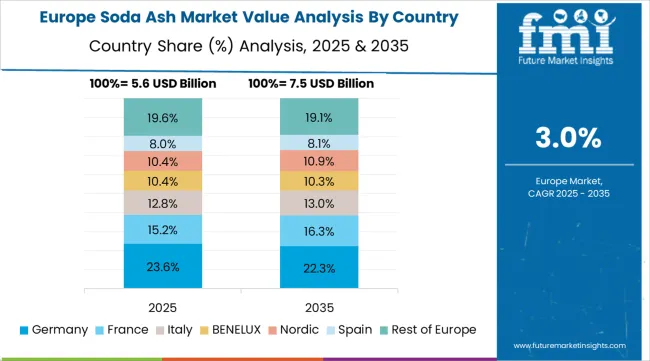
The European soda ash market is projected to grow from USD 5.6 billion in 2025 to USD 7.7 billion by 2035, registering a CAGR of 3.3% over the forecast period. Germany is expected to maintain its leadership position with a 21.4% market share in 2025, supported by its advanced glass manufacturing infrastructure and major automotive production centers.
France follows with a 14.3% share in 2025, driven by comprehensive construction programs and chemical production initiatives. The United Kingdom holds a 12.5% share in 2025 through specialized construction glass applications and water treatment requirements. Italy commands a 12.5% share, while Spain accounts for 8.9% in 2025. Poland maintains a 7.1% share driven by regional glass manufacturing and chemical production capabilities. The Netherlands holds 5.4%, Belgium 3.6%, and Sweden 3.6% in 2025. The Rest of Europe region is anticipated to maintain its collective share at 10.7% through 2035, attributed to increasing manufacturing adoption in Nordic countries and emerging Eastern European glass production facilities implementing modernization programs.
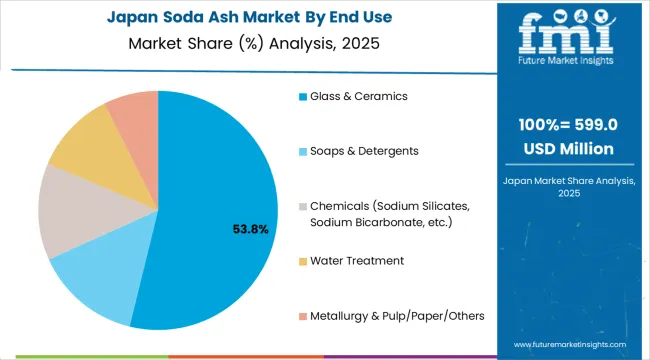
In Japan, the soda ash market prioritizes dense soda ash specifications, which capture the dominant share of glass manufacturing and industrial chemical installations due to their advanced features, including high-purity characteristics and seamless integration with existing glass production infrastructure. Japanese glass manufacturers emphasize quality, precision, and long-term operational excellence, creating demand for dense soda ash systems that provide consistent chemical performance and adaptive applications based on production requirements and manufacturing standards. The market demonstrates sophisticated implementation focused on glass industry applications, with documented demand growth of 6.28% CAGR through 2033, supported by expanding automotive glass production and construction sector requirements. Light soda ash formulations maintain secondary positions primarily in specialized detergent applications and chemical synthesis installations where comprehensive cleaning functionality meets operational requirements without compromising production efficiency.
Market Characteristics:
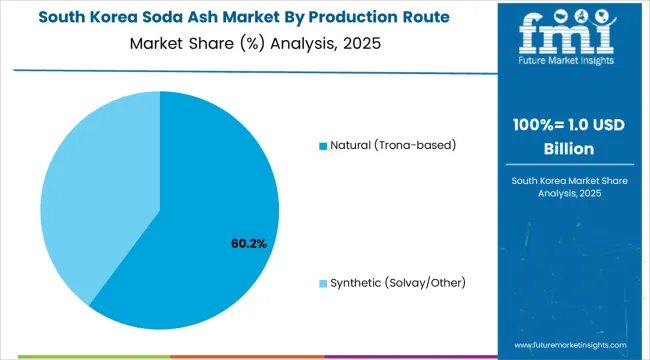
In South Korea, the market structure favors imported natural soda ash from North American and Turkish producers, which maintain dominant positions through comprehensive supply networks and established glass manufacturing industry partnerships supporting both container glass and flat glass production installations. These suppliers offer integrated solutions combining cost-competitive natural soda ash with professional logistics services and technical support, appealing to Korean glass manufacturers seeking reliable chemical supply and operational efficiency. Local chemical distributors and regional specialty suppliers complement international producers through specialized services including Korean market logistics and technical support programs for glass manufacturing applications. The competitive landscape shows increasing collaboration between international natural soda ash producers and Korean industrial customers, creating supply relationships that combine global production scale with local market knowledge and quality management systems.
Market Characteristics:
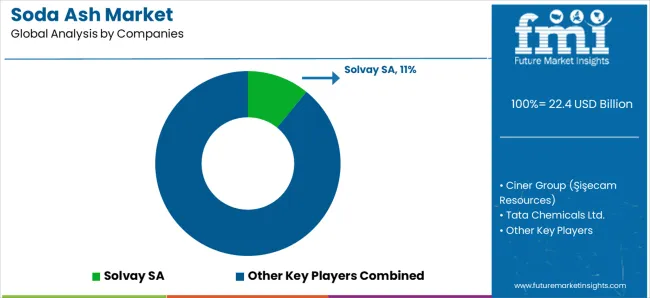
The soda ash market operates with moderate concentration, featuring approximately 15-20 meaningful participants, where leading companies control roughly 45-52% of the global market share through established natural trona resources and comprehensive production networks. Competition emphasizes production cost efficiency, resource access, and regional supply positioning rather than price-based rivalry alone.
Market Leaders encompass Solvay SA, WE Soda (including Genesis Alkali), and Ciner Group, which maintain competitive advantages through extensive natural trona deposits, global glass manufacturing customer networks, and comprehensive production integration capabilities that create supply security and support competitive pricing. These companies leverage decades of chemical production experience and ongoing sustainability investments to develop low-carbon soda ash systems with enhanced environmental performance and cost optimization features.
Regional Champions include Tata Chemicals Ltd., GHCL Ltd., and CIECH SA, which compete through established domestic market positions and regional production capabilities that appeal to glass manufacturers seeking reliable local supply and technical support. These companies differentiate through vertical integration strategies and specialized regional market knowledge. Emerging Producers feature companies like Şişecam Soda Sanayii, Nirma Ltd., and Bashkir Soda Company, which focus on specific geographic markets and specialized applications, including integrated glass production systems and regional chemical solutions.
| Item | Value |
|---|---|
| Quantitative Units | USD 22.4 billion |
| End Use | Glass &Ceramics (Flat Glass, Container Glass, Glass Fiber), Soaps &Detergents, Chemicals, Water Treatment, Metallurgy &Other |
| Production Route | Natural (Trona-based: North America, Turkey &Central Asia, Other), Synthetic (Solvay/Other: EU, Asia, Other) |
| Density | Dense Soda Ash (Flat-glass Grade, Container-glass Grade, Other), Light Soda Ash (Detergents, Chemicals/Blends) |
| Regions Covered | Asia Pacific, Europe, North America, Latin America, Middle East &Africa |
| Countries Covered | China, India, Turkey, the USA, Germany, Poland, the UK, and 25+ additional countries |
| Key Companies Profiled | Solvay SA, Ciner Group, Tata Chemicals Ltd., CIECH SA, Genesis Alkali, GHCL Ltd., Nirma Ltd. |
| Additional Attributes | Dollar sales by end-use and production route categories, regional adoption trends across Asia-Pacific, Europe, and North America, competitive landscape with integrated producers and regional manufacturers, glass manufacturer preferences for cost-effective raw materials and environmental performance, integration with sustainable production platforms and carbon reduction systems, innovations in natural extraction methods and low-carbon processing, and development of solution mining technologies with enhanced sustainability and resource optimization capabilities. |
The global soda ash market is estimated to be valued at USD 22.4 billion in 2025.
The market size for the soda ash market is projected to reach USD 32.8 billion by 2035.
The soda ash market is expected to grow at a 3.9% CAGR between 2025 and 2035.
The key product types in soda ash market are glass & ceramics, soaps & detergents, chemicals (sodium silicates, sodium bicarbonate, etc.), water treatment and metallurgy & pulp/paper/others.
In terms of production route, natural (trona-based) segment to command 61.0% share in the soda ash market in 2025.


Our Research Products

The "Full Research Suite" delivers actionable market intel, deep dives on markets or technologies, so clients act faster, cut risk, and unlock growth.

The Leaderboard benchmarks and ranks top vendors, classifying them as Established Leaders, Leading Challengers, or Disruptors & Challengers.

Locates where complements amplify value and substitutes erode it, forecasting net impact by horizon

We deliver granular, decision-grade intel: market sizing, 5-year forecasts, pricing, adoption, usage, revenue, and operational KPIs—plus competitor tracking, regulation, and value chains—across 60 countries broadly.

Spot the shifts before they hit your P&L. We track inflection points, adoption curves, pricing moves, and ecosystem plays to show where demand is heading, why it is changing, and what to do next across high-growth markets and disruptive tech

Real-time reads of user behavior. We track shifting priorities, perceptions of today’s and next-gen services, and provider experience, then pace how fast tech moves from trial to adoption, blending buyer, consumer, and channel inputs with social signals (#WhySwitch, #UX).

Partner with our analyst team to build a custom report designed around your business priorities. From analysing market trends to assessing competitors or crafting bespoke datasets, we tailor insights to your needs.
Supplier Intelligence
Discovery & Profiling
Capacity & Footprint
Performance & Risk
Compliance & Governance
Commercial Readiness
Who Supplies Whom
Scorecards & Shortlists
Playbooks & Docs
Category Intelligence
Definition & Scope
Demand & Use Cases
Cost Drivers
Market Structure
Supply Chain Map
Trade & Policy
Operating Norms
Deliverables
Buyer Intelligence
Account Basics
Spend & Scope
Procurement Model
Vendor Requirements
Terms & Policies
Entry Strategy
Pain Points & Triggers
Outputs
Pricing Analysis
Benchmarks
Trends
Should-Cost
Indexation
Landed Cost
Commercial Terms
Deliverables
Brand Analysis
Positioning & Value Prop
Share & Presence
Customer Evidence
Go-to-Market
Digital & Reputation
Compliance & Trust
KPIs & Gaps
Outputs
Full Research Suite comprises of:
Market outlook & trends analysis
Interviews & case studies
Strategic recommendations
Vendor profiles & capabilities analysis
5-year forecasts
8 regions and 60+ country-level data splits
Market segment data splits
12 months of continuous data updates
DELIVERED AS:
PDF EXCEL ONLINE
Soda Maker Market Size and Share Forecast Outlook 2025 to 2035
Soda Production Machine Market Size and Share Forecast Outlook 2025 to 2035
Ashwagandha Extract Market Analysis by Form, Application, Sales Channel and Region through 2035
Cashew Nutshell Liquid Market Size and Share Forecast Outlook 2025 to 2035
Cash Management Supplies Packaging Market Size and Share Forecast Outlook 2025 to 2035
Washable Flexographic Printing Plate Market Size and Share Forecast Outlook 2025 to 2035
Wash-Off Label Market Analysis - Size and Share Forecast Outlook 2025 to 2035
Washi Tapes Market Size and Share Forecast Outlook 2025 to 2035
Cash Logistics Market Size and Share Forecast Outlook 2025 to 2035
Washing Capsules Market Size and Share Forecast Outlook 2025 to 2035
Lash Extension Market Size and Share Forecast Outlook 2025 to 2035
Cashew Roasting Machine Market Size and Share Forecast Outlook 2025 to 2035
Cashew Processing Machine Market Size and Share Forecast Outlook 2025 to 2035
Hashimoto's Thyroiditis Therapeutics Market Size and Share Forecast Outlook 2025 to 2035
Fashion Accessories Packaging Market Size and Share Forecast Outlook 2025 to 2035
Analysis and Growth Projections for mashed potato market
Washing Machine Cleaner Market Analysis - Trends, Growth & Forecast 2025 to 2035
Cashew Milk Market Analysis by Form, End Use, Sales Channel, Packaging, and Product Type Through 2035
Cash Management Services Market – Trends & Forecast 2025 to 2035
Washing Machine Market Analysis by Various Materials, Thickness Capacity Type Through 2035

Thank you!
You will receive an email from our Business Development Manager. Please be sure to check your SPAM/JUNK folder too.
Chat With
MaRIA