Cashew Nutshell Liquid Market Size and Share Forecast Outlook From 2024 to 2034

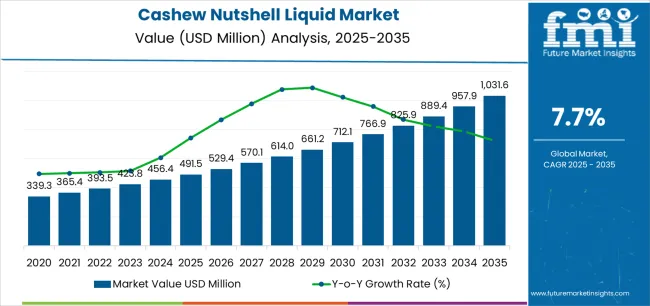
The cashew nutshell liquid market is projected to be worth USD 454.7 million in 2024. The market is anticipated to reach USD 995.0 million by 2034. The market is further expected to surge at a CAGR of 8.1% during the forecast period 2024 to 2034.

Key Market Trends and Highlights

Research and development efforts aimed at exploring new applications and improving the properties of cashew nutshell liquid market derivatives drive innovation in the market. New formulations and product developments expand the potential uses of cashew nutshell liquid market, creating opportunities for market growth.

  • Cashew nutshell liquid market contains compounds that have potential health benefits, such as antioxidants and antimicrobial properties. There is increasing interest in natural products like cashew nutshell liquid market for their potential health promoting properties, as health and wellness trends continue to rise, which can drive market growth.
  • The globalization of trade and expanding market reach enable cashew nutshell liquid market producers to access new geographical markets. Emerging economies with growing industrial sectors offer lucrative opportunities for market expansion and growth.
  • Supportive government policies, incentives, and regulations promoting the use of renewable resources and sustainable practices can positively impact the cashew nutshell liquid market by creating a conducive environment for its growth and adoption.
Attributes Key Insights
Cashew Nutshell Liquid Market Estimated Size in 2024 USD 454.7 million
Projected Market Value in 2034 USD 995.0 million
Value-based CAGR from 2024 to 2034 8.1%

Sales Trend Analysis from 2019 to 2023 Compared to Market Outlook for 2024 to 2034

The scope for cashew nutshell liquid rose at a 10.7% CAGR between 2019 and 2023. The global market is anticipated to grow at a moderate CAGR of 8.1% over the forecast period 2024 to 2034.

The market experienced steady growth during the historical period from 2019 to 2023, driven by advancements in extraction and processing technologies, which improved the efficiency and yield of cashew nutshell liquid production, which led to the development of high quality cashew nutshell liquid derivatives with enhanced properties, expanding their applications and market potential.

Supportive regulatory frameworks and policies promoting the use of bio based products further stimulated market growth. Alignment with sustainability goals and environmental regulations enhanced the acceptance and adoption of cashew nutshell liquid derivatives.

Looking ahead to the forecast period from 2024 to 2034, the market is expected to witness significant growth. Market forecast projections anticipate continued expansion of end use industries such as automotive, construction, and packaging. The industries are expected to drive sustained demand for cashew nutshell liquid derived products, contributing to market growth.

Increasing globalization and trade liberalization are expected to facilitate market access and penetration into new geographical regions. Emerging markets with burgeoning industrial sectors offer lucrative opportunities for cashew nutshell liquid manufacturers to expand their market presence.

Key Growth Drivers for the Cashew Nutshell Liquid Market

Cashew nutshell liquid is widely used in various industries such as automotive, coatings, adhesives, polymers, and lubricants due to its unique chemical properties. The growing demand for these industrial applications is a significant driver of the cashew nutshell liquid market.

  • There is a growing demand for eco-friendly and sustainable products, with increasing environmental concerns. Cashew nutshell liquid, being a natural and renewable resource, is gaining popularity as a green alternative in various industries, thereby boosting its market growth.
  • The expansion and development of end use industries such as automotive, construction, and packaging, especially in emerging economies, provide opportunities for the market to grow as these industries require cashew nutshell liquid derived products for various applications.
  • Advances in extraction and processing technologies enable the production of high quality cashew nutshell liquid derivatives, making them more suitable for a wide range of applications. The technological advancements enhance the market prospects for cashew nutshell liquid products.

Factors Restraining the Demand for Cashew Nutshell Liquid Products

Fluctuations in cashew nut prices, influenced by factors such as weather conditions, crop yields, and geopolitical events, can impact the cost of raw materials for cashew nutshell liquid production. Volatility in raw material prices can affect profit margins and investment decisions in the cashew nutshell liquid market.

  • The availability of cashew nut shells, the primary raw material for cashew nutshell liquid extraction, may be limited by factors such as seasonal variations in cashew nut production and competition from other industries utilizing cashew nut byproducts. Limited supply can constrain production capacity and hinder market growth.
  • cashew nutshell liquid faces competition from synthetic chemicals and petroleum based derivatives used in similar applications. The availability of cheaper synthetic alternatives with comparable properties may pose a challenge to the adoption of cashew nutshell liquid derived products in certain market segments.
  • Despite advancements in extraction and processing technologies, challenges such as low extraction efficiency, variability in cashew nutshell liquid composition, and processing complexities may persist. Addressing these technological and processing challenges is crucial to improving product quality and cost effectiveness in the cashew nutshell liquid market.

Analysis of Top Countries Producing, Certifying, and Utilizing Cashew Nutshell Liquid

The below table showcases revenues in terms of the top 5 leading countries, spearheaded by Korea and Japan. The countries are expected to lead the market through 2034.

Countries Forecast CAGRs from 2024 to 2034
The United States 8.4%
China 8.9%
The United Kingdom 9.3%
Japan 9.8%
Korea 10.2%

Regulatory Support for Bio Based Materials Driving the Market in the United States

The cashew nutshell liquid market in the United States expected to expand at a CAGR of 8.4% through 2034. The government in the country has implemented policies and initiatives to promote the use of bio based materials and reduce dependence on fossil fuels. Supportive regulations and incentives encourage investment in bio based industries, including the cashew nutshell liquid market.

The United States is home to diverse industries such as automotive, construction, coatings, adhesives, and polymers, which are major consumers of cashew nutshell liquid derived products. The expansion of these industries drives demand for cashew nutshell liquid based solutions, boosting market growth.

Preference for Natural Products to Accelerate Market Growth in the United Kingdom

The cashew nutshell liquid market in the United Kingdom is anticipated to expand at a CAGR of 9.3% through 2034. The consumers in the country are increasingly conscious of the environmental and health impacts of products they purchase.

There is a growing preference for natural and nontoxic alternatives in household and personal care products. Cashew nutshell liquid derived products, with their natural origin and eco-friendly properties, resonate with the consumers in the United Kingdom, driving market demand.

The country is known for its innovation and research capabilities across various industries. Investment in research and development activities aimed at improving cashew nutshell liquid extraction methods, refining processes, and developing new applications enhances the market potential of cashew nutshell liquid derived products, driving market growth.

Large Agricultural Sector Spearhead the Market in China

Cashew nutshell liquid trends in China are taking a turn for the better. An 8.9% CAGR is forecast for the country from 2024 to 2034. China has a large agricultural sector, including significant cashew nut production in regions like Hainan Province.

The availability of cashew nut shells as a byproduct of the cashew nut processing industry provides a ready source of raw material for cashew nutshell liquid extraction, supporting the growth of the market in China.

The diverse manufacturing sector in the country spans industries such as automotive, electronics, construction, textiles, and packaging, all of which utilize cashew nutshell liquid derived products in various applications. The expansion of these industries and the increasing adoption of cashew nutshell liquid based solutions drive market growth in China.

International Trade and Market Access Fueling the Market in Japan

The cashew nutshell liquid market in Japan is poised to expand at a CAGR of 9.8% through 2034. The participation of Japan in global trade networks provides opportunities for market expansion and access to international markets for cashew nutshell liquid derived products. Export of cashew nutshell liquid based products to other countries and partnerships with international stakeholders drive growth and revenue generation in cashew nutshell liquid sector in Japan.

The focus of the country on disaster resilience and safety drives demand for durable and high performance materials in construction and infrastructure projects. Cashew nutshell liquid derived products, known for their excellent adhesion, corrosion resistance, and weatherability, are preferred choices in such applications, driving market growth.

Investment in Green Technology Driving the Demand in Korea

The cashew nutshell liquid market in Korea is anticipated to expand at a CAGR of 10.2% through 2034. Korean companies are investing in green technology and sustainable practices to reduce environmental impact and comply with regulations. Cashew nutshell liquid derived products, with their eco-friendly properties, are integral to green technology initiatives, driving market growth in green technology sector in the country.

The Korean government provides incentives and support for companies engaged in innovation and technology development. Cashew nutshell liquid based innovations, such as new formulations and applications, benefit from government support, driving market growth through increased investment in research and development.

Cashew Nutshell Liquid Industry Analysis by Top Investment Segments

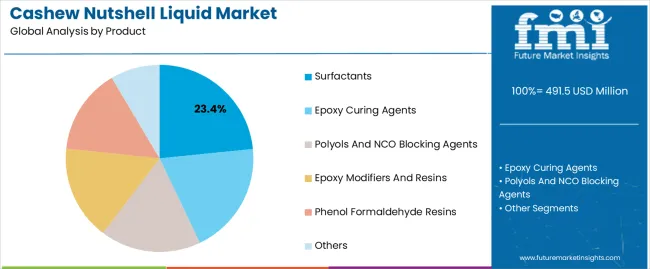
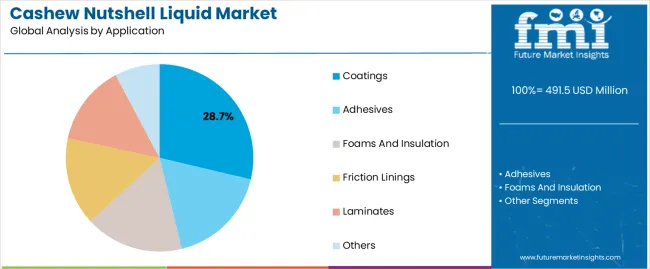
The below table highlights how surfactants segment is projected to lead the market in terms of product, and is expected to account for a CAGR of 7.8% through 2034. Based on application, the coatings segment is expected to account for a CAGR of 7.6% through 2034.

Category CAGR from 2024 to 2034
Surfactants 7.8%
Coatings 7.6%

Surfactants Claims High Demand for Cashew Nutshell Liquid

Based on product, the surfactants segment is expected to continue dominating the cashew nutshell liquid market. The liquid contains phenolic compounds, which make it suitable for use as a raw material in the production of surfactants. Surfactants derived from cashew nutshell liquid offer excellent surface active properties, making them suitable for use in a wide range of applications, including detergents, cleaners, emulsifiers, and foaming agents.

Regulatory agencies in many regions are implementing policies and guidelines to promote the use of biobased and environmentally friendly products. Cashew nutshell liquid derived surfactants, being natural and renewable, receive favorable consideration under such regulatory frameworks, driving market growth for this segment.

Coatings Segment to Hold High Demand for Cashew Nutshell Liquid

In terms of application, the coatings segment is expected to continue dominating the cashew nutshell liquid market. The liquid contains phenolic compounds that impart excellent chemical properties, making it suitable for use in coatings formulations. Cashew nutshell liquid based coatings offer superior adhesion, corrosion resistance, and weatherability, driving demand for cashew nutshell liquid in the coatings segment.

Cashew nutshell liquid based coatings exhibit enhanced performance characteristics compared to traditional coatings. They offer excellent resistance to chemicals, abrasion, and UV degradation, making them suitable for a wide range of applications in industries such as automotive, aerospace, marine, and construction, driving demand for cashew nutshell liquid in the coatings segment.
Leading Suppliers in the Cashew Nutshell Liquid Sector

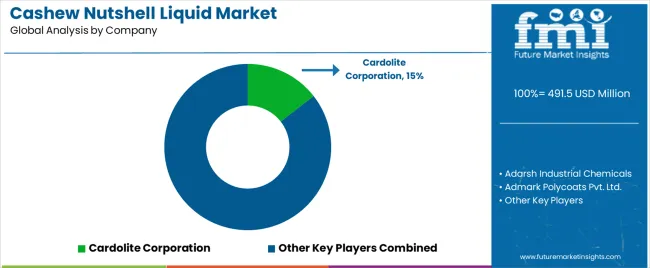
The competitive landscape of the cashew nutshell liquid market is characterized by several key players operating globally and regionally. The companies are involved in the extraction, processing, production, and distribution of cashew nutshell liquid derived products, catering to various industries such as coatings, friction linings, polymers, surfactants, and resin formulations.

Company Portfolio

  • Cardolite Corporation is a leading player in the cashew nutshell liquid market, offering a wide range of cashew nutshell liquid based products including friction modifiers, modifiers for coatings, resins, and epoxy curing agents. The company focuses on innovation and sustainability to maintain its competitive edge.
  • Cashew Industries is a prominent supplier of cashew nutshell liquid and its derivatives, serving industries such as coatings, automotive, and construction. The company emphasizes quality control and customer satisfaction to maintain its market position.

Scope and Coverage of the Cashew Nutshell Liquid Market Report

Attribute Details
Estimated Market Size in 2024 USD 454.7 million
Projected Market Valuation in 2034 USD 995.0 million
Value-based CAGR 2024 to 2034 8.1%
Forecast Period 2024 to 2034
Historical Data Available for 2019 to 2023
Market Analysis Value in USD million
Key Regions Covered North America; Latin America; Western Europe; Eastern Europe; South Asia and Pacific; East Asia; The Middle East & Africa
Key Market Segments Covered Product, Application, Region
Key Countries Profiled The United States, Canada, Brazil, Mexico, Germany, France, France, Spain, Italy, Russia, Poland, Czech Republic, Romania, India, Bangladesh, Australia, New Zealand, China, Japan, South Korea, GCC countries, South Africa, Israel
Key Companies Profiled Adarsh Industrial Chemicals; Admark Polycoats Pvt. Ltd; Cardolite Corporation; Cashew Chem India; Cat Loi Cashew Oil Production & Export JSC; Equilex Chemicals B.V; Golden Cashew Products Pvt. Ltd; K2P Chemicals; LC Buffalo Co. Ltd.; Muskaan Group

Top Segments Studied in the Cashew Nutshell Liquid Market

Product:

  • Surfactants
  • Epoxy Curing Agents
  • Polyols and NCO Blocking Agents
  • Epoxy Modifiers and Resins
  • Phenol Formaldehyde Resins
  • Others

Application:

  • Coatings
  • Adhesives
  • Foams and Insulation
  • Friction Linings
  • Laminates
  • Others

Region:

  • North America
  • Latin America
  • Western Europe
  • Eastern Europe
  • South Asia and Pacific
  • East Asia
  • The Middle East and Africa

Table of Content

  • 1. Executive Summary
  • 2. Market Overview
  • 3. Market Background
  • 4. Global Market Analysis 2019 to 2023 and Forecast, 2024 to 2034
  • 5. Global Market Analysis 2019 to 2023 and Forecast 2024 to 2034, By Product
    • 5.1. Surfactants
    • 5.2. Epoxy Curing Agents
    • 5.3. Polyols & NCO Blocking Agents
    • 5.4. Epoxy Modifiers & Resins
    • 5.5. Phenol-Formaldehyde Resins
    • 5.6. Others
  • 6. Global Market Analysis 2019 to 2023 and Forecast 2024 to 2034, By Application
    • 6.1. Coatings
    • 6.2. Adhesives
    • 6.3. Foams and Insulation
    • 6.4. Friction Linings
    • 6.5. Laminates
    • 6.6. Others
  • 7. Global Market Analysis 2019 to 2023 and Forecast 2024 to 2034, By Region
    • 7.1. North America
    • 7.2. Latin America
    • 7.3. Europe
    • 7.4. East Asia
    • 7.5. South Asia
    • 7.6. Oceania
    • 7.7. MEA
  • 8. North America Market Analysis 2019 to 2023 and Forecast 2024 to 2034, By Country
  • 9. Latin America Market Analysis 2019 to 2023 and Forecast 2024 to 2034, By Country
  • 10. Europe Market Analysis 2019 to 2023 and Forecast 2024 to 2034, By Country
  • 11. East Asia Market Analysis 2019 to 2023 and Forecast 2024 to 2034, By Country
  • 12. South Asia Market Analysis 2019 to 2023 and Forecast 2024 to 2034, By Country
  • 13. Oceania Market Analysis 2019 to 2023 and Forecast 2024 to 2034, By Country
  • 14. MEA Market Analysis 2019 to 2023 and Forecast 2024 to 2034, By Country
  • 15. Key Countries Market Analysis
  • 16. Market Structure Analysis
  • 17. Competition Analysis
    • 17.1. Adarsh Industrial Chemicals
    • 17.2. Admark Polycoats Pvt. Ltd
    • 17.3. Cardolite Corporation
    • 17.4. Cashew Chem India
    • 17.5. Cat Loi Cashew Oil Production & Export JSC
    • 17.6. Equilex Chemicals B.V
    • 17.7. Golden Cashew Products Pvt. Ltd
    • 17.8. K2P Chemicals
    • 17.9. LC Buffalo Co. Ltd
    • 17.10. Muskaan Group
  • 18. Assumptions & Acronyms Used
  • 19. Research Methodology

List of Tables

Table 1: Global Market Value (US$ Million) Forecast by Region, 2019 to 2034

Table 2: Global Market Volume (Tons) Forecast by Region, 2019 to 2034

Table 3: Global Market Value (US$ Million) Forecast by Product, 2019 to 2034

Table 4: Global Market Volume (Tons) Forecast by Product, 2019 to 2034

Table 5: Global Market Value (US$ Million) Forecast by Application, 2019 to 2034

Table 6: Global Market Volume (Tons) Forecast by Application, 2019 to 2034

Table 7: North America Market Value (US$ Million) Forecast by Country, 2019 to 2034

Table 8: North America Market Volume (Tons) Forecast by Country, 2019 to 2034

Table 9: North America Market Value (US$ Million) Forecast by Product, 2019 to 2034

Table 10: North America Market Volume (Tons) Forecast by Product, 2019 to 2034

Table 11: North America Market Value (US$ Million) Forecast by Application, 2019 to 2034

Table 12: North America Market Volume (Tons) Forecast by Application, 2019 to 2034

Table 13: Latin America Market Value (US$ Million) Forecast by Country, 2019 to 2034

Table 14: Latin America Market Volume (Tons) Forecast by Country, 2019 to 2034

Table 15: Latin America Market Value (US$ Million) Forecast by Product, 2019 to 2034

Table 16: Latin America Market Volume (Tons) Forecast by Product, 2019 to 2034

Table 17: Latin America Market Value (US$ Million) Forecast by Application, 2019 to 2034

Table 18: Latin America Market Volume (Tons) Forecast by Application, 2019 to 2034

Table 19: Europe Market Value (US$ Million) Forecast by Country, 2019 to 2034

Table 20: Europe Market Volume (Tons) Forecast by Country, 2019 to 2034

Table 21: Europe Market Value (US$ Million) Forecast by Product, 2019 to 2034

Table 22: Europe Market Volume (Tons) Forecast by Product, 2019 to 2034

Table 23: Europe Market Value (US$ Million) Forecast by Application, 2019 to 2034

Table 24: Europe Market Volume (Tons) Forecast by Application, 2019 to 2034

Table 25: East Asia Market Value (US$ Million) Forecast by Country, 2019 to 2034

Table 26: East Asia Market Volume (Tons) Forecast by Country, 2019 to 2034

Table 27: East Asia Market Value (US$ Million) Forecast by Product, 2019 to 2034

Table 28: East Asia Market Volume (Tons) Forecast by Product, 2019 to 2034

Table 29: East Asia Market Value (US$ Million) Forecast by Application, 2019 to 2034

Table 30: East Asia Market Volume (Tons) Forecast by Application, 2019 to 2034

Table 31: South Asia Market Value (US$ Million) Forecast by Country, 2019 to 2034

Table 32: South Asia Market Volume (Tons) Forecast by Country, 2019 to 2034

Table 33: South Asia Market Value (US$ Million) Forecast by Product, 2019 to 2034

Table 34: South Asia Market Volume (Tons) Forecast by Product, 2019 to 2034

Table 35: South Asia Market Value (US$ Million) Forecast by Application, 2019 to 2034

Table 36: South Asia Market Volume (Tons) Forecast by Application, 2019 to 2034

Table 37: Oceania Market Value (US$ Million) Forecast by Country, 2019 to 2034

Table 38: Oceania Market Volume (Tons) Forecast by Country, 2019 to 2034

Table 39: Oceania Market Value (US$ Million) Forecast by Product, 2019 to 2034

Table 40: Oceania Market Volume (Tons) Forecast by Product, 2019 to 2034

Table 41: Oceania Market Value (US$ Million) Forecast by Application, 2019 to 2034

Table 42: Oceania Market Volume (Tons) Forecast by Application, 2019 to 2034

Table 43: MEA Market Value (US$ Million) Forecast by Country, 2019 to 2034

Table 44: MEA Market Volume (Tons) Forecast by Country, 2019 to 2034

Table 45: MEA Market Value (US$ Million) Forecast by Product, 2019 to 2034

Table 46: MEA Market Volume (Tons) Forecast by Product, 2019 to 2034

Table 47: MEA Market Value (US$ Million) Forecast by Application, 2019 to 2034

Table 48: MEA Market Volume (Tons) Forecast by Application, 2019 to 2034

List of Figures

Figure 1: Global Market Value (US$ Million) by Product, 2024 to 2034

Figure 2: Global Market Value (US$ Million) by Application, 2024 to 2034

Figure 3: Global Market Value (US$ Million) by Region, 2024 to 2034

Figure 4: Global Market Value (US$ Million) Analysis by Region, 2019 to 2034

Figure 5: Global Market Volume (Tons) Analysis by Region, 2019 to 2034

Figure 6: Global Market Value Share (%) and BPS Analysis by Region, 2024 to 2034

Figure 7: Global Market Y-o-Y Growth (%) Projections by Region, 2024 to 2034

Figure 8: Global Market Value (US$ Million) Analysis by Product, 2019 to 2034

Figure 9: Global Market Volume (Tons) Analysis by Product, 2019 to 2034

Figure 10: Global Market Value Share (%) and BPS Analysis by Product, 2024 to 2034

Figure 11: Global Market Y-o-Y Growth (%) Projections by Product, 2024 to 2034

Figure 12: Global Market Value (US$ Million) Analysis by Application, 2019 to 2034

Figure 13: Global Market Volume (Tons) Analysis by Application, 2019 to 2034

Figure 14: Global Market Value Share (%) and BPS Analysis by Application, 2024 to 2034

Figure 15: Global Market Y-o-Y Growth (%) Projections by Application, 2024 to 2034

Figure 16: Global Market Attractiveness by Product, 2024 to 2034

Figure 17: Global Market Attractiveness by Application, 2024 to 2034

Figure 18: Global Market Attractiveness by Region, 2024 to 2034

Figure 19: North America Market Value (US$ Million) by Product, 2024 to 2034

Figure 20: North America Market Value (US$ Million) by Application, 2024 to 2034

Figure 21: North America Market Value (US$ Million) by Country, 2024 to 2034

Figure 22: North America Market Value (US$ Million) Analysis by Country, 2019 to 2034

Figure 23: North America Market Volume (Tons) Analysis by Country, 2019 to 2034

Figure 24: North America Market Value Share (%) and BPS Analysis by Country, 2024 to 2034

Figure 25: North America Market Y-o-Y Growth (%) Projections by Country, 2024 to 2034

Figure 26: North America Market Value (US$ Million) Analysis by Product, 2019 to 2034

Figure 27: North America Market Volume (Tons) Analysis by Product, 2019 to 2034

Figure 28: North America Market Value Share (%) and BPS Analysis by Product, 2024 to 2034

Figure 29: North America Market Y-o-Y Growth (%) Projections by Product, 2024 to 2034

Figure 30: North America Market Value (US$ Million) Analysis by Application, 2019 to 2034

Figure 31: North America Market Volume (Tons) Analysis by Application, 2019 to 2034

Figure 32: North America Market Value Share (%) and BPS Analysis by Application, 2024 to 2034

Figure 33: North America Market Y-o-Y Growth (%) Projections by Application, 2024 to 2034

Figure 34: North America Market Attractiveness by Product, 2024 to 2034

Figure 35: North America Market Attractiveness by Application, 2024 to 2034

Figure 36: North America Market Attractiveness by Country, 2024 to 2034

Figure 37: Latin America Market Value (US$ Million) by Product, 2024 to 2034

Figure 38: Latin America Market Value (US$ Million) by Application, 2024 to 2034

Figure 39: Latin America Market Value (US$ Million) by Country, 2024 to 2034

Figure 40: Latin America Market Value (US$ Million) Analysis by Country, 2019 to 2034

Figure 41: Latin America Market Volume (Tons) Analysis by Country, 2019 to 2034

Figure 42: Latin America Market Value Share (%) and BPS Analysis by Country, 2024 to 2034

Figure 43: Latin America Market Y-o-Y Growth (%) Projections by Country, 2024 to 2034

Figure 44: Latin America Market Value (US$ Million) Analysis by Product, 2019 to 2034

Figure 45: Latin America Market Volume (Tons) Analysis by Product, 2019 to 2034

Figure 46: Latin America Market Value Share (%) and BPS Analysis by Product, 2024 to 2034

Figure 47: Latin America Market Y-o-Y Growth (%) Projections by Product, 2024 to 2034

Figure 48: Latin America Market Value (US$ Million) Analysis by Application, 2019 to 2034

Figure 49: Latin America Market Volume (Tons) Analysis by Application, 2019 to 2034

Figure 50: Latin America Market Value Share (%) and BPS Analysis by Application, 2024 to 2034

Figure 51: Latin America Market Y-o-Y Growth (%) Projections by Application, 2024 to 2034

Figure 52: Latin America Market Attractiveness by Product, 2024 to 2034

Figure 53: Latin America Market Attractiveness by Application, 2024 to 2034

Figure 54: Latin America Market Attractiveness by Country, 2024 to 2034

Figure 55: Europe Market Value (US$ Million) by Product, 2024 to 2034

Figure 56: Europe Market Value (US$ Million) by Application, 2024 to 2034

Figure 57: Europe Market Value (US$ Million) by Country, 2024 to 2034

Figure 58: Europe Market Value (US$ Million) Analysis by Country, 2019 to 2034

Figure 59: Europe Market Volume (Tons) Analysis by Country, 2019 to 2034

Figure 60: Europe Market Value Share (%) and BPS Analysis by Country, 2024 to 2034

Figure 61: Europe Market Y-o-Y Growth (%) Projections by Country, 2024 to 2034

Figure 62: Europe Market Value (US$ Million) Analysis by Product, 2019 to 2034

Figure 63: Europe Market Volume (Tons) Analysis by Product, 2019 to 2034

Figure 64: Europe Market Value Share (%) and BPS Analysis by Product, 2024 to 2034

Figure 65: Europe Market Y-o-Y Growth (%) Projections by Product, 2024 to 2034

Figure 66: Europe Market Value (US$ Million) Analysis by Application, 2019 to 2034

Figure 67: Europe Market Volume (Tons) Analysis by Application, 2019 to 2034

Figure 68: Europe Market Value Share (%) and BPS Analysis by Application, 2024 to 2034

Figure 69: Europe Market Y-o-Y Growth (%) Projections by Application, 2024 to 2034

Figure 70: Europe Market Attractiveness by Product, 2024 to 2034

Figure 71: Europe Market Attractiveness by Application, 2024 to 2034

Figure 72: Europe Market Attractiveness by Country, 2024 to 2034

Figure 73: East Asia Market Value (US$ Million) by Product, 2024 to 2034

Figure 74: East Asia Market Value (US$ Million) by Application, 2024 to 2034

Figure 75: East Asia Market Value (US$ Million) by Country, 2024 to 2034

Figure 76: East Asia Market Value (US$ Million) Analysis by Country, 2019 to 2034

Figure 77: East Asia Market Volume (Tons) Analysis by Country, 2019 to 2034

Figure 78: East Asia Market Value Share (%) and BPS Analysis by Country, 2024 to 2034

Figure 79: East Asia Market Y-o-Y Growth (%) Projections by Country, 2024 to 2034

Figure 80: East Asia Market Value (US$ Million) Analysis by Product, 2019 to 2034

Figure 81: East Asia Market Volume (Tons) Analysis by Product, 2019 to 2034

Figure 82: East Asia Market Value Share (%) and BPS Analysis by Product, 2024 to 2034

Figure 83: East Asia Market Y-o-Y Growth (%) Projections by Product, 2024 to 2034

Figure 84: East Asia Market Value (US$ Million) Analysis by Application, 2019 to 2034

Figure 85: East Asia Market Volume (Tons) Analysis by Application, 2019 to 2034

Figure 86: East Asia Market Value Share (%) and BPS Analysis by Application, 2024 to 2034

Figure 87: East Asia Market Y-o-Y Growth (%) Projections by Application, 2024 to 2034

Figure 88: East Asia Market Attractiveness by Product, 2024 to 2034

Figure 89: East Asia Market Attractiveness by Application, 2024 to 2034

Figure 90: East Asia Market Attractiveness by Country, 2024 to 2034

Figure 91: South Asia Market Value (US$ Million) by Product, 2024 to 2034

Figure 92: South Asia Market Value (US$ Million) by Application, 2024 to 2034

Figure 93: South Asia Market Value (US$ Million) by Country, 2024 to 2034

Figure 94: South Asia Market Value (US$ Million) Analysis by Country, 2019 to 2034

Figure 95: South Asia Market Volume (Tons) Analysis by Country, 2019 to 2034

Figure 96: South Asia Market Value Share (%) and BPS Analysis by Country, 2024 to 2034

Figure 97: South Asia Market Y-o-Y Growth (%) Projections by Country, 2024 to 2034

Figure 98: South Asia Market Value (US$ Million) Analysis by Product, 2019 to 2034

Figure 99: South Asia Market Volume (Tons) Analysis by Product, 2019 to 2034

Figure 100: South Asia Market Value Share (%) and BPS Analysis by Product, 2024 to 2034

Figure 101: South Asia Market Y-o-Y Growth (%) Projections by Product, 2024 to 2034

Figure 102: South Asia Market Value (US$ Million) Analysis by Application, 2019 to 2034

Figure 103: South Asia Market Volume (Tons) Analysis by Application, 2019 to 2034

Figure 104: South Asia Market Value Share (%) and BPS Analysis by Application, 2024 to 2034

Figure 105: South Asia Market Y-o-Y Growth (%) Projections by Application, 2024 to 2034

Figure 106: South Asia Market Attractiveness by Product, 2024 to 2034

Figure 107: South Asia Market Attractiveness by Application, 2024 to 2034

Figure 108: South Asia Market Attractiveness by Country, 2024 to 2034

Figure 109: Oceania Market Value (US$ Million) by Product, 2024 to 2034

Figure 110: Oceania Market Value (US$ Million) by Application, 2024 to 2034

Figure 111: Oceania Market Value (US$ Million) by Country, 2024 to 2034

Figure 112: Oceania Market Value (US$ Million) Analysis by Country, 2019 to 2034

Figure 113: Oceania Market Volume (Tons) Analysis by Country, 2019 to 2034

Figure 114: Oceania Market Value Share (%) and BPS Analysis by Country, 2024 to 2034

Figure 115: Oceania Market Y-o-Y Growth (%) Projections by Country, 2024 to 2034

Figure 116: Oceania Market Value (US$ Million) Analysis by Product, 2019 to 2034

Figure 117: Oceania Market Volume (Tons) Analysis by Product, 2019 to 2034

Figure 118: Oceania Market Value Share (%) and BPS Analysis by Product, 2024 to 2034

Figure 119: Oceania Market Y-o-Y Growth (%) Projections by Product, 2024 to 2034

Figure 120: Oceania Market Value (US$ Million) Analysis by Application, 2019 to 2034

Figure 121: Oceania Market Volume (Tons) Analysis by Application, 2019 to 2034

Figure 122: Oceania Market Value Share (%) and BPS Analysis by Application, 2024 to 2034

Figure 123: Oceania Market Y-o-Y Growth (%) Projections by Application, 2024 to 2034

Figure 124: Oceania Market Attractiveness by Product, 2024 to 2034

Figure 125: Oceania Market Attractiveness by Application, 2024 to 2034

Figure 126: Oceania Market Attractiveness by Country, 2024 to 2034

Figure 127: MEA Market Value (US$ Million) by Product, 2024 to 2034

Figure 128: MEA Market Value (US$ Million) by Application, 2024 to 2034

Figure 129: MEA Market Value (US$ Million) by Country, 2024 to 2034

Figure 130: MEA Market Value (US$ Million) Analysis by Country, 2019 to 2034

Figure 131: MEA Market Volume (Tons) Analysis by Country, 2019 to 2034

Figure 132: MEA Market Value Share (%) and BPS Analysis by Country, 2024 to 2034

Figure 133: MEA Market Y-o-Y Growth (%) Projections by Country, 2024 to 2034

Figure 134: MEA Market Value (US$ Million) Analysis by Product, 2019 to 2034

Figure 135: MEA Market Volume (Tons) Analysis by Product, 2019 to 2034

Figure 136: MEA Market Value Share (%) and BPS Analysis by Product, 2024 to 2034

Figure 137: MEA Market Y-o-Y Growth (%) Projections by Product, 2024 to 2034

Figure 138: MEA Market Value (US$ Million) Analysis by Application, 2019 to 2034

Figure 139: MEA Market Volume (Tons) Analysis by Application, 2019 to 2034

Figure 140: MEA Market Value Share (%) and BPS Analysis by Application, 2024 to 2034

Figure 141: MEA Market Y-o-Y Growth (%) Projections by Application, 2024 to 2034

Figure 142: MEA Market Attractiveness by Product, 2024 to 2034

Figure 143: MEA Market Attractiveness by Application, 2024 to 2034

Figure 144: MEA Market Attractiveness by Country, 2024 to 2034

Frequently Asked Questions

What is the anticipated value of the Cashew Nutshell Liquid market in 2024?

The cashew nutshell liquid market is projected to reach a valuation of USD 454.7 million in 2024.

What is the expected CAGR for the Cashew Nutshell Liquid market until 2034?

The cashew nutshell liquid industry is set to expand by a CAGR of 8.1% through 2034.

How much valuation is projected for the Cashew Nutshell Liquid market in 2034?

The cashew nutshell liquid market is forecast to reach USD 995.0 million by 2034.

Which country is projected to lead the Cashew Nutshell Liquid market?

Korea is expected to be the top performing market, exhibiting a CAGR of 10.2% through 2034.

Which is the dominant product in the Cashew Nutshell Liquid domain?

Surfactants segment is preferred, and is expected to account for a CAGR of 7.8% through 2034.

Explore Specialty Chemicals Insights

Future Market Insights

Cashew Nutshell Liquid Market