Reports

- Global Locations -

Headquarters

Future Market Insights, Inc.

Christiana Corporate, 200
Continental Drive, Suite 401,
Newark, Delaware - 19713,
United States

T: +1-347-918-3531

Americas

Future Market Insights, Inc.

616 Corporate Way, Suite 2-9018,
Valley Cottage, NY 10989, United States

MEA

Future Market Insights

1602-6 Jumeirah Bay X2 Tower, Plot No: JLT-PH2-X2A,
Jumeirah Lakes Towers, Dubai,
United Arab Emirates

Europe

Future Market Insights

3rd Floor, 207 Regent Street,
W1B 3HH London
United Kingdom

T: + 44 (0) 20 8123 9659

Asia Pacific

Future Market Insights

IndiaLand Global Tech Park, Unit UG-1, Behind Grand HighStreet, Phase 1, Hinjawadi, MH, Pune – 411057, India

A Summary of the Cashew Roasting Machine Market Development (2023 to 2033)

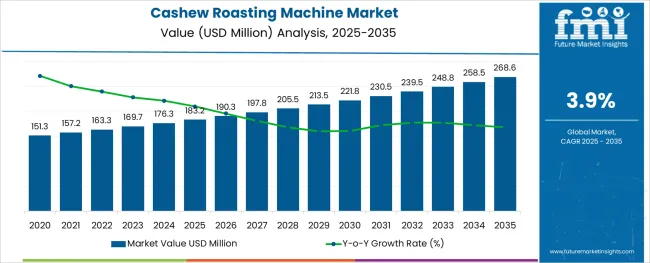
The global cashew roasting machine market is projected to have a moderate-paced CAGR of 3.9% during the forecast period. The current valuation of the market is US$ 169.7 million in 2023. The market value of the cashew roasting machine market is anticipated to reach a high of US$ 248.3 million by the year 2033. A historical market valuation of US$ 163.3 million has been recorded by the experts of Future Market Insights for the concerned market during the base year. This growth is supported by:

  • The surge in the number of health-conscious consumers across the globe and their raising awareness about the health benefits provided by roasted nuts is anticipated to fuel the market growth for the concerned product.
  • The need to eliminate the acids ad proteins present in the nuts makes them lack taste, thereby the cashew roasting machines enhance the taste of the nuts to be favorably devoured by the growing population.
  • Demand for transforming the physical and chemical properties of raw cashews into roasted cashew products with changes in taste, color, density, and smell is fueling the sale of cashew roasting machines.
  • The key aspect bolstering the demand for cashew roasting machines is to obtain different flavors of cashew.
  • The different types of cashews like light-roast cashew, medium-roast cashews, and dark-roast cashew used in the wide variety of delicacies are anticipated to transform the landscape of cashew roasting machines in the forthcoming years.

Although the market is projected to have healthy growth, the expert analysts at Future Market Insights have identified that a certain number of elements prevailing in the market are likely to impede the growth of the forum in the long run. The restraining factors identified in the cashew roasting machine market are as follows:

  • The low shelf-life of roasted cashews is expected to act as a major deterring factor, as it loses flavor due to the onset of staleness.
  • Instant cashew powder is expected to hinder the global market growth for cashew roasting machines as they reduce the time needed for roasting and grinding.
  • Fluctuations in the prices of raw materials are likely to hinder the pace of advancement for cashew roasting machines across geographies.
Report Attribute Details
Cashew Roasting Machine Market Value (2023) US$ 169.7 million
Cashew Roasting Machine Market Anticipated Value (2033) US$ 284.3 million
Cashew Roasting Machine Projected Growth Rate (2023 to 2033) 3.9%

Don't pay for what you don't need

Customize your report by selecting specific countries or regions and save 30%!

Increase in the Number of Cafes Surge Demand for Roasted Cashew Garnishing

It has been identified while analyzing the market in depth that a large number of cafes, restaurants, and bakeries are flourishing across developing economies due to the new cult of exploring exquisite eateries amongst the millennial populace. Owing to the rise in per capita income, people across the globe are becoming fonder of dine-out habits and are also having a change in their preference for food. They are looking forward to healthier options that possess added benefits besides having a scrumptious taste. Roasted cashews are being extensively used in customized cakes, and as a garnish on flavorsome desserts.

Due to this consumer demand for the distinct flavors of roasted cashews, the manufacturers operating in the cashew roasting machine market are prompted to design new products that work efficiently to cater to new requirements from the food and restaurant sector.

Glance over the Historical Market Scenario

After analyzing the market to the core, the experts of FMI have unveiled that the cashew roasting machine market has been witnessing an unprecedented surge in the past few years. There is an approximate rise of US$ 85.0 million surge in the total market value from 2022 to 2023. The market during the period 2018 to 2023 registered a CAGR of 2.9%.

The growth of the market can be attributed to the need for eliminating the dangerous toxin present in it called urushiol. This substance is poisonous and can cause dermatitis that provokes the appearance of spots and bumps on the skin accompanied by itching, and the awareness regarding this issue amongst consumers is instigating them to consume roasted cashews, thereby fueling the growth of the cashew roasting machine market over the forecast period.

The demand for snacks is increasing and the nut industry is growing rapidly in the snacking sector due to the number of healthy nutrients provided by nuts along with flavor and taste. Owing to the crunchy texture of roasted cashews and a wide range of health benefits, they are gaining prominence amongst the urban populace and has resulted in a rising market share for cashew roasting machine in recent years.

Cashew Roasting Machine Market:

Differentiating Aspects Cashew Roasting Machine Market
CAGR 3.9%
Market Valuation in 2023 US$ 169.7 Million
Projected Market Value in 2033 US$ 284.3 Million
Drivers
  • Raising health awareness amongst the urban populace about the benefits of cashew is expected to fuel market shares.
  • Consumer preference for distinctive flavors of cashews and change in snacking habits is a key growth propellant.

Coffee Roasting Machine Market:

Differentiating Aspects Coffee Roasting Machine Market
CAGR 6%
Market Valuation in 2023 US$ 479.44 Million
Projected Market Value in 2033 US$ 858.60 Million
Drivers
  • The increasing trend of café culture and the expansion of coffee shop chains are also expected to drive market growth.
  • Rising disposable income and development in the retail sector are likely to propel the growth of the residential coffee roaster segment.

Wheat Roaster Machine Market:

Differentiating Aspects Wheat Roaster Machine Market
CAGR 6.4%
Market Valuation in 2023 US$ 1.17 Billion
Projected Market Value in 2033 US$ 2.18 Billion
Drivers
  • Roasted wheat enhances digestibility and has high nutrient levels in the grains, thereby proliferating the growth of the wheat roaster market.
  • Convenience food manufacturers are highly using roasted wheat for food.
  • Demand for healthier and tastier snacks is fueling the market growth for wheat roasters due to the usage of roasted wheat largely across the bakery industry.
Nandini Roy Choudhury

Principal Consultant

Talk to Analyst

Find your sweet spots for generating winning opportunities in this market.

Category-wise Insights

Overview of Key Segments Gaining Popularity and Attention in the Cashew Roasting Machine Market

Semi-automatic Cashew Roasting Machine - By Machine Type

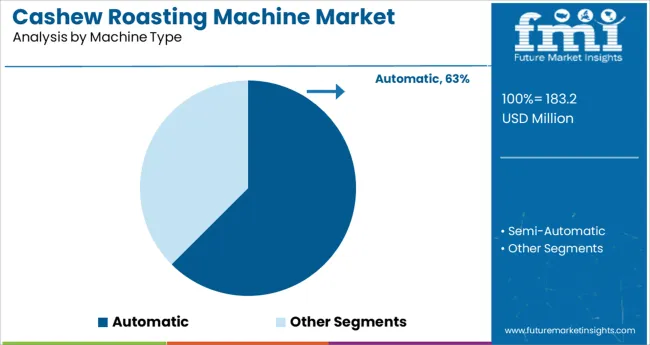
It has been identified that the semi-automatic cashew roasting machine segment in the product type category is likely to hold a dominant share through the forecast period. This segment is advancing at a steady pace, recording a CAGR of 3.8% through 2033. During the base year, the semi-automatic machine type accounted for a CAGR of 2.7%. The factors responsible for the growth of this segment can be identified as the following:

  • It is a multipurpose machine with the advantages of environmental protection, heat preservation, and energy saving.
  • The semi-automatic machines are convenient and fast as compared to the other machine types which save on labor and time with a high rate of production.
  • They are available at a relatively low cost.

Batch-type Roasting Machine - By Roasting Machine Type

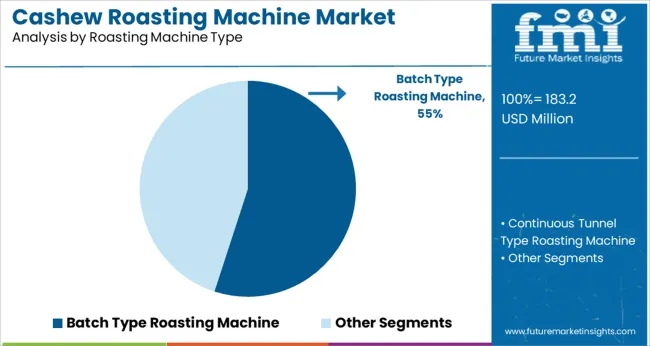
The batch-type roasting machine segment is projected to exert a positive influence on the cashew roasting machine market over the forecast period. This segment is accountable for an average-paced CAGR of 3.6% through 2033. In the base year, the segment registered a CAGR of 3.0%. The aspects fueling the optimum usage of batch-type roasting machines are as follows:
  • These machines have accurate dimensions that enable smooth performance and consistent quality of roasted nuts with auto temperature setting facilities.
  • The perfectly coordinated mix of controlled roasting air and mechanical motion of the batch-type roasting machine improves the transmission of thermal energy and is highly preferred by roasted cashew nut manufacturers.

Country-wise Insights

A Peek into How Diverse Countries are Augmenting the Flavor and Aroma of Roasted Cashews

Country United States of America
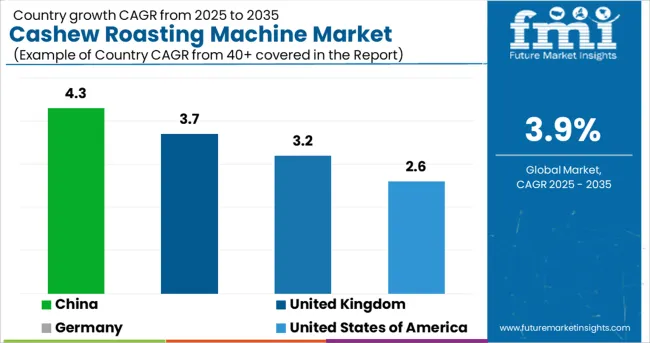
Statistics The cashew roasting machine market in the USA is anticipated to register a CAGR of 2.6% during the period 2023 to 2033. The market is estimated to surpass a valuation of US$ 26.8 Million by the end of 2033 and has witnessed an approximate surge of US$ 6.7 million from the base year to the current.
Historical CAGR: 2.2%
Growth Propellants The factors fueling the growth of the market in the USA are:
  • The abundance of raw materials aids in the larger production of cashew nut-based products fueling the growth of the cashew roasting machine market.
  • Snacking trends are on the rise amongst the working populace due to the crunchy nature of roasted cashews, flavors highly preferred by the populace, aiding the growth of the forum.
Country Germany
Statistics The cashew roasting machine market in Germany is projected to progress at a CAGR of 3.2%, surpassing a market valuation of US$ 10.7 Million by the end of 2033.
An approximate rise of US$ 3.7 Million has been witnessed from the year 2022 to 2023. Historical CAGR: 4.3%
Growth Propellants Factors attributing to the growth of the market are:
  • The rise in the vegan trend across the European region is surging the consumption of plant-based products, thereby fueling the consumption of dry fruits and nuts, simultaneously increasing the market size of cashew roasting machines.
  • The presence of an established bakery industry across Germany that demands roasted cashew toppings on cakes and cookies further fuels the market growth.
Country China
Statistics China’s cashew roasting machine market is likely to register substantial growth over the projection period. The country is anticipated to progress at a CAGR of 4.3%. The market valuation in 2033 is expected to stand at US$ 48.2 Million. A considerable spike of US$ 18.1 Million is witnessed from the year 2022 to 2023. Historical CAGR: 3.8%
Growth Propellants
  • Aspects boosting the market growth in China can be reckoned as:
  • Rapid urbanization and wide acceptance of a westernized culture of nut-based snacks, coupled with an increase in disposable income are changing the taste preferences of consumers, fueling the market share of the cashew roasting machine market in China.
  • The presence of potential market players innovating in the range of cashew roasting machines is further propelling the market growth.
Country United Kingdom
Statistics The UK cashew roasting machine market is anticipated to have significant growth over the estimated period of study, advancing at a CAGR of 3.7% through the forecast period. The market is projected to surpass a valuation of US$ 10.7 Million by 2033 and has witnessed a rise from US$ 3.7 Million from the base year to the current. Historical CAGR: 5.3%
Growth Propellants The prevailing growth propellants identified are:
  • The easy availability of raw materials and the high amount of cashew production across the country are stirring up the landscape of cashew roasting machines.
  • Government initiatives and grants for research and development activities to be carried out by key players in the market is likely to influence the market size of cashew roasting machines in the UK

Get the data you need at a Fraction of the cost

Personalize your report by choosing insights you need
and save 40%!

Start-up Ecosystem

FMI Sheds Light on How Emerging Companies Revamp the Market Dynamics

The new entrants in the cashew roasting machine market are leveraging advancements in technology to launch new products and gain a competitive advantage. These firms are continually investing in research and development activities to keep themselves in tandem with the changing consumer preferences and end-use industry demands. Efforts are being made to strengthen their foothold in the forum and aid the further progression of the cashew roasting machines market.

Top Start-ups to Watch For

Griin - Israeli Start-up

This start-up firm has launched its new website featuring its new logo and design language while continuing to develop its proprietary volumetric roasting systems for roasting small quantities of cashews and other nuts on demand.

The core product countertop roasting machine that the company says will roast single doses of nuts, coffee, and more on-demand in as little as 90 seconds. While beta testing in the field is in progress, a full release date has not been announced.

Algrano - Switzerland-based Start-up

This start-up has recently completed an approximate investment funding of US$ 4 million. Ikawa ProV3 Sample Roaster made its debut in 2018. The purpose of the firm is to further close the technology gap that exists between cashew producers and traditional consumer markets, while simultaneously helping participating farmers identify and improve cashew and coffee quality and consistency.
Competitive Landscape

Biggies Revolutionizing the Cashew Roasting Machine Landscape with Strategic Initiatives

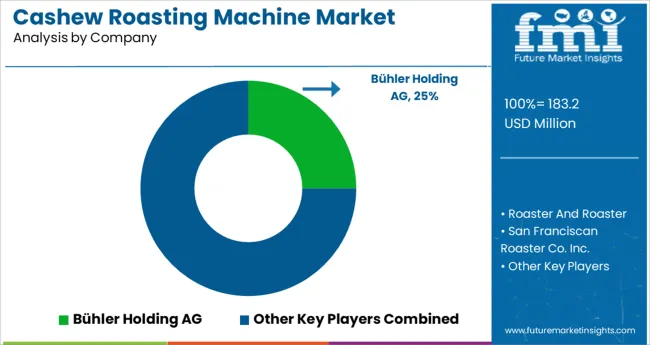
Due to the existence of numerous international and regional companies, the market for cashew roasting machines is very competitive. To strengthen their position in the market, major players are implementing a variety of methods, including product portfolio growth and regional development. Leading market players are adopting various business strategies, such as mergers and acquisitions, to expand their geographic presence and consumer base across the world.

New Zealand-based Kaffelogic is bringing its flagship small coffee roaster, the Nano 7, to the USA market this Spring. Designed for both home users and professional sample roasting applications, the Nano 7 electric fluid-bed roaster will come to the USA following an IndieGoGo crowdfunding campaign in the upcoming months.

German roaster manufacturer Probat this week launched an all-electric, small-capacity model called the P01, which is replacing the gas-powered Probatino as the company expands its line-up of P Series shop roasters. The 1-kilo-capacity P01 is designed for sample roasting and recipe development. While it departs from Probation through a number of features, it maintains the goal of mimicking and predicting the performances of Probat’s larger production models. The P01 includes the same web-based software controls and automation features found on the larger P Series machines, including the recently introduced electric PO5 E roaster.

Another key player EKO Nut Roasting Machines offers cashew roasting machines for small, medium-sized, and big manufacturers. They specialize in air-roast and facilitate hot air circulation roasting in 2 and more rooms with the possibility of temperature adjusting to obtain cashew an amazing taste and also roasts.

Recent Developments

  • In January 2020, Nestle launched its Roastelier, a countertop roaster trudging into the smallest commercial roasting category, giving customers easy access to the roasting production process.
  • In 2018, JAB Holding Company (parent company of Jacobs Douwe Egberts.) acquired around 30 brands.
  • in August 2019, Bolster Investment Partners acquired majority stakes in Giesen Coffee and Cashew Roasting machines.

Some of the key players proliferating in the market are

Key Segments in the Cashew Roasting Machine Market

By Machine Type:

  • Automatic
  • Semi-automatic

By Roasting Machine Type:

  • Batch Type Roasting Machine
  • Continuous Tunnel Type Roasting Machine

By Capacity:

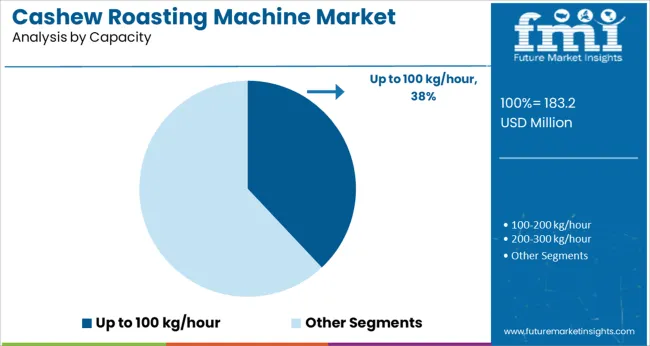
  • Up to 100kg/hour
  • 100-2022kg/hour
  • 200-300 kg/hour
  • Above 300 kg/hour

By Region:

  • North America
  • Latin America
  • Asia Pacific
  • Middle East and Africa (MEA)
  • Europe

Frequently Asked Questions

What is the Growth Outlook for the Cashew Roasting Machine Market?

The growth outlook for the cashew roasting machine market is predicted to advance at a CAGR of 3.9% from 2023 to 2033.

Which Region Leads the Cashew Roasting Machine Market?

The North American region is anticipated to lead the cashew roasting machine market during the forecast period.

What is the market valuation of the Cashew Roasting Machine in 2023?

The market valuation of the cashew roasting machine market stands at US$ 169.7 million in 2023.

How much Growth Potential does the Cashew Roasting Machine hold?

The cashew roasting machine market is likely to hold a valuation of US$ 284.3 million by 2033.

Which sector is the key driver in the Cashew Roasting Machine Market?

The restaurant sector is the key driver in the cashew roasting machine market.

Table of Content

1. Executive Summary | Cashew Roasting Machine Market

    1.1. Global Market Outlook

    1.2. Demand-side Trends

    1.3. Supply-side Trends

    1.4. Technology Roadmap Analysis

    1.5. Analysis and Recommendations

2. Market Overview

    2.1. Market Coverage / Taxonomy

    2.2. Market Definition / Scope / Limitations

3. Market Background

    3.1. Market Dynamics

        3.1.1. Drivers

        3.1.2. Restraints

        3.1.3. Opportunity

        3.1.4. Trends

    3.2. Impact of Covid-19

        3.2.1. Demand in Optimistic Scenario

        3.2.2. Demand in Likely Scenario

        3.2.3. Demand in Conservative Scenario

    3.3. Macro Factors and Forecast Factors ;

    3.4. Value Chain Analysis

        3.4.1. Profit Margin Analysis

        3.4.2. Raw Material Suppliers

        3.4.3. Manufacturers, Wholesalers, and Distributors

        3.4.4. End Users / Customers

    3.5. Regional Parent Market Outlook

    3.6. Production and Consumption Statistics

    3.7. Global Average Pricing Analysis Benchmark

4. Global Market Analysis 2018 to 2022and Forecast, 2023 to 2033

    4.1. Historical Market Size Value (US$ Million) & Volume (Units) Analysis, 2018 to 2022

    4.2. Current and Future Market Size Value (US$ Million) & Volume (Units) Projections, 2023 to 2033

        4.2.1. Y-o-Y Growth Trend Analysis

        4.2.2. Absolute $ Opportunity Analysis

5. Global Market Analysis 2018 to 2022 and Forecast 2023 to 2033, By Machine Type

    5.1. Introduction / Key Findings

    5.2. Historical Market Size Value (US$ Million) & Volume (Units) Analysis By Machine Type, 2018 to 2022

    5.3. Current and Future Market Size Value (US$ Million) & Volume (Units) Analysis and Forecast By Machine Type, 2023 to 2033

        5.3.1. Automatic

        5.3.2. Semi-Automatic

    5.4. Y-o-Y Growth Trend Analysis By Machine Type, 2018 to 2022

    5.5. Absolute $ Opportunity Analysis By Machine Type, 2023 to 2033

6. Global Market Analysis 2018 to 2022 and Forecast 2023 to 2033, By Roasting Machine Type

    6.1. Introduction / Key Findings

    6.2. Historical Market Size Value (US$ Million) & Volume (Units) Analysis By Roasting Machine Type, 2018 to 2022

    6.3. Current and Future Market Size Value (US$ Million) & Volume (Units) Analysis and Forecast By Roasting Machine Type, 2023 to 2033

        6.3.1. Batch Type Roasting Machine

        6.3.2. Continuous Tunnel Type Roasting Machine

    6.4. Y-o-Y Growth Trend Analysis By Roasting Machine Type, 2018 to 2022

    6.5. Absolute $ Opportunity Analysis By Roasting Machine Type, 2023 to 2033

7. Global Market Analysis 2018 to 2022 and Forecast 2023 to 2033, By Capacity

    7.1. Introduction / Key Findings

    7.2. Historical Market Size Value (US$ Million) & Volume (Units) Analysis By Capacity, 2018 to 2022

    7.3. Current and Future Market Size Value (US$ Million) & Volume (Units) Analysis and Forecast By Capacity, 2023 to 2033

        7.3.1. Up to 100 kg/hour

        7.3.2. 100-200 kg/hour

        7.3.3. 200-300 kg/hour

        7.3.4. Above 300 kg/hour

    7.4. Y-o-Y Growth Trend Analysis By Capacity, 2018 to 2022

    7.5. Absolute $ Opportunity Analysis By Capacity, 2023 to 2033

8. Global Market Analysis 2018 to 2022 and Forecast 2023 to 2033, by Region

    8.1. Introduction / Key Findings

    8.2. Historical Market Size Value (US$ Million) & Volume (Units) Analysis By Region, 2018 to 2022

    8.3. Current and Future Market Size Value (US$ Million) & Volume (Units) Analysis and Forecast By Region, 2023 to 2033

        8.3.1. North America

        8.3.2. Latin America

        8.3.3. Europe

        8.3.4. East Asia

        8.3.5. South Asia

        8.3.6. Oceania

        8.3.7. Middle East and Africa (MEA)

    8.4. Market Attractiveness Analysis, by Region

9. North America Market Analysis 2018 to 2022 and Forecast 2023 to 2033, By Country

    9.1. Historical Market Size Value (US$ Million) & Volume (Units) Trend Analysis By Market Taxonomy, 2018 to 2022

    9.2. Market Size Value (US$ Million) & Volume (Units) Forecast By Market Taxonomy, 2023 to 2033

        9.2.1. By Country

            9.2.1.1. United States of America

            9.2.1.2. Canada

        9.2.2. By Machine Type

        9.2.3. By Roasting Machine Type

        9.2.4. By Capacity

    9.3. Market Attractiveness Analysis

        9.3.1. By Country

        9.3.2. By Machine Type

        9.3.3. By Roasting Machine Type

        9.3.4. By Capacity

    9.4. Key Takeaways

10. Latin America Market Analysis 2018 to 2022 and Forecast 2023 to 2033, By Country

    10.1. Historical Market Size Value (US$ Million) & Volume (Units) Trend Analysis By Market Taxonomy, 2018 to 2022

    10.2. Market Size Value (US$ Million) & Volume (Units) Forecast By Market Taxonomy, 2023 to 2033

        10.2.1. By Country

            10.2.1.1. Brazil

            10.2.1.2. Mexico

            10.2.1.3. Argentina

            10.2.1.4. Chile

            10.2.1.5. Peru

            10.2.1.6. Rest of Latin America

        10.2.2. By Machine Type

        10.2.3. By Roasting Machine Type

        10.2.4. By Capacity

    10.3. Market Attractiveness Analysis

        10.3.1. By Country

        10.3.2. By Machine Type

        10.3.3. By Roasting Machine Type

        10.3.4. By Capacity

    10.4. Key Takeaways

11. Europe Market Analysis 2018 to 2022 and Forecast 2023 to 2033, By Country

    11.1. Historical Market Size Value (US$ Million) & Volume (Units) Trend Analysis By Market Taxonomy, 2018 to 2022

    11.2. Market Size Value (US$ Million) & Volume (Units) Forecast By Market Taxonomy, 2023 to 2033

        11.2.1. By Country

            11.2.1.1. Germany

            11.2.1.2. Italy

            11.2.1.3. France

            11.2.1.4. United Kingdom

            11.2.1.5. Spain

            11.2.1.6. BENELUX

            11.2.1.7. Nordic

            11.2.1.8. Russia

            11.2.1.9. Poland

            11.2.1.10. Rest of Europe

        11.2.2. By Machine Type

        11.2.3. By Roasting Machine Type

        11.2.4. By Capacity

    11.3. Market Attractiveness Analysis

        11.3.1. By Country

        11.3.2. By Machine Type

        11.3.3. By Roasting Machine Type

        11.3.4. By Capacity

    11.4. Key Takeaways

12. East Asia Market Analysis 2018 to 2022 and Forecast 2023 to 2033, By Country

    12.1. Historical Market Size Value (US$ Million) & Volume (Units) Trend Analysis By Market Taxonomy, 2018 to 2022

    12.2. Market Size Value (US$ Million) & Volume (Units) Forecast By Market Taxonomy, 2023 to 2033

        12.2.1. By Country

            12.2.1.1. China

            12.2.1.2. Japan

            12.2.1.3. South Korea

        12.2.2. By Machine Type

        12.2.3. By Roasting Machine Type

        12.2.4. By Capacity

    12.3. Market Attractiveness Analysis

        12.3.1. By Country

        12.3.2. By Machine Type

        12.3.3. By Roasting Machine Type

        12.3.4. By Capacity

    12.4. Key Takeaways

13. South Asia Market Analysis 2018 to 2022 and Forecast 2023 to 2033, By Country

    13.1. Historical Market Size Value (US$ Million) & Volume (Units) Trend Analysis By Market Taxonomy, 2018 to 2022

    13.2. Market Size Value (US$ Million) & Volume (Units) Forecast By Market Taxonomy, 2023 to 2033

        13.2.1. By Country

            13.2.1.1. India

            13.2.1.2. Thailand

            13.2.1.3. Malaysia

            13.2.1.4. Indonesia

            13.2.1.5. Rest of South Asia

        13.2.2. By Machine Type

        13.2.3. By Roasting Machine Type

        13.2.4. By Capacity

    13.3. Market Attractiveness Analysis

        13.3.1. By Country

        13.3.2. By Machine Type

        13.3.3. By Roasting Machine Type

        13.3.4. By Capacity

    13.4. Key Takeaways

14. Oceania Market Analysis 2018 to 2022 and Forecast 2023 to 2033, By Country

    14.1. Historical Market Size Value (US$ Million) & Volume (Units) Trend Analysis By Market Taxonomy, 2018 to 2022

    14.2. Market Size Value (US$ Million) & Volume (Units) Forecast By Market Taxonomy, 2023 to 2033

        14.2.1. By Country

            14.2.1.1. Australia

            14.2.1.2. New Zealand

        14.2.2. By Machine Type

        14.2.3. By Roasting Machine Type

        14.2.4. By Capacity

    14.3. Market Attractiveness Analysis

        14.3.1. By Country

        14.3.2. By Machine Type

        14.3.3. By Roasting Machine Type

        14.3.4. By Capacity

    14.4. Key Takeaways

15. Middle East & Africa Market Analysis 2018 to 2022 and Forecast 2023 to 2033, By Country

    15.1. Historical Market Size Value (US$ Million) & Volume (Units) Trend Analysis By Market Taxonomy, 2018 to 2022

    15.2. Market Size Value (US$ Million) & Volume (Units) Forecast By Market Taxonomy, 2023 to 2033

        15.2.1. By Country

            15.2.1.1. GCC Countries

            15.2.1.2. Turkey

            15.2.1.3. Northern Africa

            15.2.1.4. South Africa

            15.2.1.5. Rest of MEA

        15.2.2. By Machine Type

        15.2.3. By Roasting Machine Type

        15.2.4. By Capacity

    15.3. Market Attractiveness Analysis

        15.3.1. By Country

        15.3.2. By Machine Type

        15.3.3. By Roasting Machine Type

        15.3.4. By Capacity

    15.4. Key Takeaways

16. Country-wise Market Analysis 

    16.1. United States (USA)

        16.1.1. Market Share Analysis, 2023

        16.1.2. By Machine Type

        16.1.3. By Roasting Machine Type

        16.1.4. By Capacity

    16.2. Canada

        16.2.1. Market Share Analysis, 2023

        16.2.2. By Machine Type

        16.2.3. By Roasting Machine Type

        16.2.4. By Capacity

    16.3. Brazil

        16.3.1. Market Share Analysis, 2023

        16.3.2. By Machine Type

        16.3.3. By Roasting Machine Type

        16.3.4. By Capacity

    16.4. Mexico

        16.4.1. Market Share Analysis, 2023

        16.4.2. By Machine Type

        16.4.3. By Roasting Machine Type

        16.4.4. By Capacity

    16.5. Germany

        16.5.1. Market Share Analysis, 2023

        16.5.2. By Machine Type

        16.5.3. By Roasting Machine Type

        16.5.4. By Capacity

    16.6. Italy

        16.6.1. Market Share Analysis, 2023

        16.6.2. By Machine Type

        16.6.3. By Roasting Machine Type

        16.6.4. By Capacity

    16.7. France

        16.7.1. Market Share Analysis, 2023

        16.7.2. By Machine Type

        16.7.3. By Roasting Machine Type

        16.7.4. By Capacity

    16.8. Spain

        16.8.1. Market Share Analysis, 2023

        16.8.2. By Machine Type

        16.8.3. By Roasting Machine Type

        16.8.4. By Capacity

    16.9. United Kingdom

        16.9.1. Market Share Analysis, 2023

        16.9.2. By Machine Type

        16.9.3. By Roasting Machine Type

        16.9.4. By Capacity

    16.10. Russia

        16.10.1. Market Share Analysis, 2023

        16.10.2. By Machine Type

        16.10.3. By Roasting Machine Type

        16.10.4. By Capacity

    16.11. China

        16.11.1. Market Share Analysis, 2023

        16.11.2. By Machine Type

        16.11.3. By Roasting Machine Type

        16.11.4. By Capacity

    16.12. Japan

        16.12.1. Market Share Analysis, 2023

        16.12.2. By Machine Type

        16.12.3. By Roasting Machine Type

        16.12.4. By Capacity

    16.13. India

        16.13.1. Market Share Analysis, 2023

        16.13.2. By Machine Type

        16.13.3. By Roasting Machine Type

        16.13.4. By Capacity

    16.14. GCC Countries

        16.14.1. Market Share Analysis, 2023

        16.14.2. By Machine Type

        16.14.3. By Roasting Machine Type

        16.14.4. By Capacity

    16.15. Australia

        16.15.1. Market Share Analysis, 2023

        16.15.2. By Machine Type

        16.15.3. By Roasting Machine Type

        16.15.4. By Capacity

17. Market Structure Analysis

    17.1. Competition Dashboard

    17.2. Competition Benchmarking

    17.3. Market Share Analysis of Top Players

        17.3.1. By Region

        17.3.2. By Product Portfolio

18. Competition Analysis

    18.1. Competition Deep Dive

        18.1.1. CASHEW TECH

            18.1.1.1. Overview

            18.1.1.2. Product Portfolio

            18.1.1.3. Profitability by Market Segments (Product/Channel/Region)

            18.1.1.4. Sales Footprint

            18.1.1.5. Strategy Overview

                18.1.1.5.1. Marketing Strategy

                18.1.1.5.2. Product Strategy

                18.1.1.5.3. Channel Strategy

        18.1.2. Zhengzhou LONGER Machinery Co., Ltd.

            18.1.2.1. Overview

            18.1.2.2. Product Portfolio

            18.1.2.3. Profitability by Market Segments (Product/Channel/Region)

            18.1.2.4. Sales Footprint

            18.1.2.5. Strategy Overview

                18.1.2.5.1. Marketing Strategy

                18.1.2.5.2. Product Strategy

                18.1.2.5.3. Channel Strategy

        18.1.3. Au Cao Tsm Co., Ltd

            18.1.3.1. Overview

            18.1.3.2. Product Portfolio

            18.1.3.3. Profitability by Market Segments (Product/Channel/Region)

            18.1.3.4. Sales Footprint

            18.1.3.5. Strategy Overview

                18.1.3.5.1. Marketing Strategy

                18.1.3.5.2. Product Strategy

                18.1.3.5.3. Channel Strategy

        18.1.4. GELGOOG

            18.1.4.1. Overview

            18.1.4.2. Product Portfolio

            18.1.4.3. Profitability by Market Segments (Product/Channel/Region)

            18.1.4.4. Sales Footprint

            18.1.4.5. Strategy Overview

                18.1.4.5.1. Marketing Strategy

                18.1.4.5.2. Product Strategy

                18.1.4.5.3. Channel Strategy

        18.1.5. Shuliy Machinery

            18.1.5.1. Overview

            18.1.5.2. Product Portfolio

            18.1.5.3. Profitability by Market Segments (Product/Channel/Region)

            18.1.5.4. Sales Footprint

            18.1.5.5. Strategy Overview

                18.1.5.5.1. Marketing Strategy

                18.1.5.5.2. Product Strategy

                18.1.5.5.3. Channel Strategy

        18.1.6. Efor Kuruyemiş Makinaları

            18.1.6.1. Overview

            18.1.6.2. Product Portfolio

            18.1.6.3. Profitability by Market Segments (Product/Channel/Region)

            18.1.6.4. Sales Footprint

            18.1.6.5. Strategy Overview

                18.1.6.5.1. Marketing Strategy

                18.1.6.5.2. Product Strategy

                18.1.6.5.3. Channel Strategy

        18.1.7. MACHINE CASTLE

            18.1.7.1. Overview

            18.1.7.2. Product Portfolio

            18.1.7.3. Profitability by Market Segments (Product/Channel/Region)

            18.1.7.4. Sales Footprint

            18.1.7.5. Strategy Overview

                18.1.7.5.1. Marketing Strategy

                18.1.7.5.2. Product Strategy

                18.1.7.5.3. Channel Strategy

        18.1.8. TTQ Industrial Equipment Manufacturing Co. Ltd.

            18.1.8.1. Overview

            18.1.8.2. Product Portfolio

            18.1.8.3. Profitability by Market Segments (Product/Channel/Region)

            18.1.8.4. Sales Footprint

            18.1.8.5. Strategy Overview

                18.1.8.5.1. Marketing Strategy

                18.1.8.5.2. Product Strategy

                18.1.8.5.3. Channel Strategy

        18.1.9. KMS Roasting Machine industry

            18.1.9.1. Overview

            18.1.9.2. Product Portfolio

            18.1.9.3. Profitability by Market Segments (Product/Channel/Region)

            18.1.9.4. Sales Footprint

            18.1.9.5. Strategy Overview

                18.1.9.5.1. Marketing Strategy

                18.1.9.5.2. Product Strategy

                18.1.9.5.3. Channel Strategy

        18.1.10. Zhengzhou Taizy Machinery Co., Ltd

            18.1.10.1. Overview

            18.1.10.2. Product Portfolio

            18.1.10.3. Profitability by Market Segments (Product/Channel/Region)

            18.1.10.4. Sales Footprint

            18.1.10.5. Strategy Overview

                18.1.10.5.1. Marketing Strategy

                18.1.10.5.2. Product Strategy

                18.1.10.5.3. Channel Strategy

        18.1.11. MEKONG TECH GROUP

            18.1.11.1. Overview

            18.1.11.2. Product Portfolio

            18.1.11.3. Profitability by Market Segments (Product/Channel/Region)

            18.1.11.4. Sales Footprint

            18.1.11.5. Strategy Overview

                18.1.11.5.1. Marketing Strategy

                18.1.11.5.2. Product Strategy

                18.1.11.5.3. Channel Strategy

19. Assumptions and Acronyms Used

20. Research Methodology

List of Tables

Table 01: Global Market Value (US$ Million) Forecast by Region, 2018 to 2033

Table 02: Global Market Volume (Units) Forecast by Region, 2018 to 2033

Table 03: Global Market Value (US$ Million) Forecast by Machine Type, 2018 to 2033

Table 04: Global Market Volume (Units) Forecast by Machine Type, 2018 to 2033

Table 05: Global Market Value (US$ Million) Forecast by Roasting Machine Type, 2018 to 2033

Table 06: Global Market Volume (Units) Forecast by Roasting Machine Type, 2018 to 2033

Table 07: Global Market Value (US$ Million) Forecast by Capacity, 2018 to 2033

Table 08: Global Market Volume (Units) Forecast by Capacity, 2018 to 2033

Table 09: North America Market Value (US$ Million) Forecast by Country, 2018 to 2033

Table 10: North America Market Volume (Units) Forecast by Country, 2018 to 2033

Table 11: North America Market Value (US$ Million) Forecast by Machine Type, 2018 to 2033

Table 12: North America Market Volume (Units) Forecast by Machine Type, 2018 to 2033

Table 13: North America Market Value (US$ Million) Forecast by Roasting Machine Type, 2018 to 2033

Table 14: North America Market Volume (Units) Forecast by Roasting Machine Type, 2018 to 2033

Table 15: North America Market Value (US$ Million) Forecast by Capacity, 2018 to 2033

Table 16: North America Market Volume (Units) Forecast by Capacity, 2018 to 2033

Table 17: Latin America Market Value (US$ Million) Forecast by Country, 2018 to 2033

Table 18: Latin America Market Volume (Units) Forecast by Country, 2018 to 2033

Table 19: Latin America Market Value (US$ Million) Forecast by Machine Type, 2018 to 2033

Table 20: Latin America Market Volume (Units) Forecast by Machine Type, 2018 to 2033

Table 21: Latin America Market Value (US$ Million) Forecast by Roasting Machine Type, 2018 to 2033

Table 22: Latin America Market Volume (Units) Forecast by Roasting Machine Type, 2018 to 2033

Table 23: Latin America Market Value (US$ Million) Forecast by Capacity, 2018 to 2033

Table 24: Latin America Market Volume (Units) Forecast by Capacity, 2018 to 2033

Table 25: Europe Market Value (US$ Million) Forecast by Country, 2018 to 2033

Table 26: Europe Market Volume (Units) Forecast by Country, 2018 to 2033

Table 27: Europe Market Value (US$ Million) Forecast by Machine Type, 2018 to 2033

Table 28: Europe Market Volume (Units) Forecast by Machine Type, 2018 to 2033

Table 29: Europe Market Value (US$ Million) Forecast by Roasting Machine Type, 2018 to 2033

Table 30: Europe Market Volume (Units) Forecast by Roasting Machine Type, 2018 to 2033

Table 31: Europe Market Value (US$ Million) Forecast by Capacity, 2018 to 2033

Table 32: Europe Market Volume (Units) Forecast by Capacity, 2018 to 2033

Table 33: East Asia Market Value (US$ Million) Forecast by Country, 2018 to 2033

Table 34: East Asia Market Volume (Units) Forecast by Country, 2018 to 2033

Table 35: East Asia Market Value (US$ Million) Forecast by Machine Type, 2018 to 2033

Table 36: East Asia Market Volume (Units) Forecast by Machine Type, 2018 to 2033

Table 37: East Asia Market Value (US$ Million) Forecast by Roasting Machine Type, 2018 to 2033

Table 38: East Asia Market Volume (Units) Forecast by Roasting Machine Type, 2018 to 2033

Table 39: East Asia Market Value (US$ Million) Forecast by Capacity, 2018 to 2033

Table 40: East Asia Market Volume (Units) Forecast by Capacity, 2018 to 2033

Table 41: South Asia Market Value (US$ Million) Forecast by Country, 2018 to 2033

Table 42: South Asia Market Volume (Units) Forecast by Country, 2018 to 2033

Table 43: South Asia Market Value (US$ Million) Forecast by Machine Type, 2018 to 2033

Table 44: South Asia Market Volume (Units) Forecast by Machine Type, 2018 to 2033

Table 45: South Asia Market Value (US$ Million) Forecast by Roasting Machine Type, 2018 to 2033

Table 46: South Asia Market Volume (Units) Forecast by Roasting Machine Type, 2018 to 2033

Table 47: South Asia Market Value (US$ Million) Forecast by Capacity, 2018 to 2033

Table 48: South Asia Market Volume (Units) Forecast by Capacity, 2018 to 2033

Table 49: Oceania Market Value (US$ Million) Forecast by Country, 2018 to 2033

Table 50: Oceania Market Volume (Units) Forecast by Country, 2018 to 2033

Table 51: Oceania Market Value (US$ Million) Forecast by Machine Type, 2018 to 2033

Table 52: Oceania Market Volume (Units) Forecast by Machine Type, 2018 to 2033

Table 53: Oceania Market Value (US$ Million) Forecast by Roasting Machine Type, 2018 to 2033

Table 54: Oceania Market Volume (Units) Forecast by Roasting Machine Type, 2018 to 2033

Table 55: Oceania Market Value (US$ Million) Forecast by Capacity, 2018 to 2033

Table 56: Oceania Market Volume (Units) Forecast by Capacity, 2018 to 2033

Table 57: MEA Market Value (US$ Million) Forecast by Country, 2018 to 2033

Table 58: MEA Market Volume (Units) Forecast by Country, 2018 to 2033

Table 59: MEA Market Value (US$ Million) Forecast by Machine Type, 2018 to 2033

Table 60: MEA Market Volume (Units) Forecast by Machine Type, 2018 to 2033

Table 61: MEA Market Value (US$ Million) Forecast by Roasting Machine Type, 2018 to 2033

Table 62: MEA Market Volume (Units) Forecast by Roasting Machine Type, 2018 to 2033

Table 63: MEA Market Value (US$ Million) Forecast by Capacity, 2018 to 2033

Table 64: MEA Market Volume (Units) Forecast by Capacity, 2018 to 2033

Table 65: US Market Value (US$ Million) Forecast by Machine Type, Roasting Machine Type, and Capacity (2022(E) & 2032(F))

Table 66: Canada Market Value (US$ Million) Forecast by Machine Type, Roasting Machine Type, and Capacity (2022(E) & 2032(F))

Table 67: Brazil Market Value (US$ Million) Forecast by Machine Type, Roasting Machine Type, and Capacity (2022(E) & 2032(F))

Table 68: Mexico Market Value (US$ Million) Forecast by Machine Type, Roasting Machine Type, and Capacity (2022(E) & 2032(F))

Table 69: Germany Market Value (US$ Million) Forecast by Machine Type, Roasting Machine Type, and Capacity (2022(E) & 2032(F))

Table 70: Italy Market Value (US$ Million) Forecast by Machine Type, Roasting Machine Type, and Capacity (2022(E) & 2032(F))

Table 71: France Market Value (US$ Million) Forecast by Machine Type, Roasting Machine Type, and Capacity (2022(E) & 2032(F))

Table 72: Spain Market Value (US$ Million) Forecast by Machine Type, Roasting Machine Type, and Capacity (2022(E) & 2032(F))

Table 73: UK Market Value (US$ Million) Forecast by Machine Type, Roasting Machine Type, and Capacity (2022(E) & 2032(F))

Table 74: Russia Market Value (US$ Million) Forecast by Machine Type, Roasting Machine Type, and Capacity (2022(E) & 2032(F))

Table 75: China Market Value (US$ Million) Forecast by Machine Type, Roasting Machine Type, and Capacity (2022(E) & 2032(F))

Table 76: Japan Market Value (US$ Million) Forecast by Machine Type, Roasting Machine Type, and Capacity (2022(E) & 2032(F))

Table 77: India Market Value (US$ Million) Forecast by Machine Type, Roasting Machine Type, and Capacity (2022(E) & 2032(F))

Table 78: GCC Countries Market Value (US$ Million) Forecast by Machine Type, Roasting Machine Type, and Capacity (2022(E) & 2032(F))

Table 79: Australia Market Value (US$ Million) Forecast by Machine Type, Roasting Machine Type, and Capacity (2022(E) & 2032(F))

List of Charts

Figure 01: Global Market Value (US$ Million) by Machine Type, 2023 to 2033

Figure 02: Global Market Value (US$ Million) by Roasting Machine Type, 2023 to 2033

Figure 03: Global Market Value (US$ Million) by Capacity, 2023 to 2033

Figure 04: Global Market Value (US$ Million) by Region, 2023 to 2033

Figure 05: Global Market Value (US$ Million) Analysis by Region, 2018 to 2022

Figure 06: Global Market Volume (Units) Analysis by Region, 2018 to 2033

Figure 07: Global Market Value Share (%) and BPS Analysis by Region, 2022 to 2032

Figure 08: Global Market Y-o-Y Growth (%) Projections by Region, 2023 to 2033

Figure 09: Global Market Value (US$ Million) Analysis by Machine Type, 2018 to 2022

Figure 10: Global Market Volume (Units) Analysis by Machine Type, 2018 to 2033

Figure 11: Global Market Value Share (%) and BPS Analysis by Machine Type, 2022 to 2032

Figure 12: Global Market Y-o-Y Growth (%) Projections by Machine Type, 2023 to 2033

Figure 13: Global Market Value (US$ Million) Analysis by Roasting Machine Type, 2018 to 2022

Figure 14: Global Market Volume (Units) Analysis by Roasting Machine Type, 2018 to 2033

Figure 15: Global Market Value Share (%) and BPS Analysis by Roasting Machine Type, 2022 to 2032

Figure 16: Global Market Y-o-Y Growth (%) Projections by Roasting Machine Type, 2023 to 2033

Figure 17: Global Market Value (US$ Million) Analysis by Capacity, 2018 to 2022

Figure 18: Global Market Volume (Units) Analysis by Capacity, 2018 to 2033

Figure 19: Global Market Value Share (%) and BPS Analysis by Capacity, 2022 to 2032

Figure 20: Global Market Y-o-Y Growth (%) Projections by Capacity, 2023 to 2033

Figure 21: Global Market Attractiveness by Machine Type, 2023 to 2033

Figure 22: Global Market Attractiveness by Roasting Machine Type, 2023 to 2033

Figure 23: Global Market Attractiveness by Capacity, 2023 to 2033

Figure 24: Global Market Attractiveness by Capacity, 2023 to 2033

Figure 25: Global Market Attractiveness by Region, 2023 to 2033

Figure 26: North America Market Value (US$ Million) by Machine Type, 2023 to 2033

Figure 27: North America Market Value (US$ Million) by Roasting Machine Type, 2023 to 2033

Figure 28: North America Market Value (US$ Million) by Capacity, 2023 to 2033

Figure 29: North America Market Value (US$ Million) by Country, 2023 to 2033

Figure 30: North America Market Value (US$ Million) Analysis by Country, 2018 to 2022

Figure 31: North America Market Volume (Units) Analysis by Country, 2018 to 2033

Figure 32: North America Market Value Share (%) and BPS Analysis by Country, 2022 to 2032

Figure 33: North America Market Y-o-Y Growth (%) Projections by Country, 2023 to 2033

Figure 34: North America Market Value (US$ Million) Analysis by Machine Type, 2018 to 2022

Figure 35: North America Market Volume (Units) Analysis by Machine Type, 2018 to 2033

Figure 36: North America Market Value Share (%) and BPS Analysis by Machine Type, 2022 to 2032

Figure 37: North America Market Y-o-Y Growth (%) Projections by Machine Type, 2023 to 2033

Figure 38: North America Market Value (US$ Million) Analysis by Roasting Machine Type, 2018 to 2022

Figure 39: North America Market Volume (Units) Analysis by Roasting Machine Type, 2018 to 2033

Figure 40: North America Market Value Share (%) and BPS Analysis by Roasting Machine Type, 2022 to 2032

Figure 41: North America Market Y-o-Y Growth (%) Projections by Roasting Machine Type, 2023 to 2033

Figure 42: North America Market Value (US$ Million) Analysis by Capacity, 2018 to 2022

Figure 43: North America Market Volume (Units) Analysis by Capacity, 2018 to 2033

Figure 44: North America Market Value Share (%) and BPS Analysis by Capacity, 2022 to 2032

Figure 45: North America Market Y-o-Y Growth (%) Projections by Capacity, 2023 to 2033

Figure 46: North America Market Attractiveness by Machine Type, 2023 to 2033

Figure 47: North America Market Attractiveness by Roasting Machine Type, 2023 to 2033

Figure 48: North America Market Attractiveness by Capacity, 2023 to 2033

Figure 49: North America Market Attractiveness by Country, 2023 to 2033

Figure 50: Latin America Market Value (US$ Million) by Machine Type, 2022 to 2032

Figure 51: Latin America Market Value (US$ Million) by Roasting Machine Type, 2023 to 2033

Figure 52: Latin America Market Value (US$ Million) by Capacity, 2023 to 2033

Figure 53: Latin America Market Value (US$ Million) by Country, 2023 to 2033

Figure 54: Latin America Market Value (US$ Million) Analysis by Country, 2018 to 2022

Figure 55: Latin America Market Volume (Units) Analysis by Country, 2018 to 2033

Figure 56: Latin America Market Value Share (%) and BPS Analysis by Country, 2022 to 2032

Figure 57: Latin America Market Y-o-Y Growth (%) Projections by Country, 2023 to 2033

Figure 58: Latin America Market Value (US$ Million) Analysis by Machine Type, 2018 to 2022

Figure 59: Latin America Market Volume (Units) Analysis by Machine Type, 2018 to 2033

Figure 60: Latin America Market Value Share (%) and BPS Analysis by Machine Type, 2022 to 2032

Figure 61: Latin America Market Y-o-Y Growth (%) Projections by Machine Type, 2023 to 2033

Figure 62: Latin America Market Value (US$ Million) Analysis by Roasting Machine Type, 2018 to 2022

Figure 63: Latin America Market Volume (Units) Analysis by Roasting Machine Type, 2018 to 2033

Figure 64: Latin America Market Value Share (%) and BPS Analysis by Roasting Machine Type, 2022 to 2032

Figure 65: Latin America Market Y-o-Y Growth (%) Projections by Roasting Machine Type, 2023 to 2033

Figure 66: Latin America Market Value (US$ Million) Analysis by Capacity, 2018 to 2022

Figure 67: Latin America Market Volume (Units) Analysis by Capacity, 2018 to 2033

Figure 68: Latin America Market Value Share (%) and BPS Analysis by Capacity, 2022 to 2032

Figure 69: Latin America Market Y-o-Y Growth (%) Projections by Capacity, 2023 to 2033

Figure 70: Latin America Market Attractiveness by Machine Type, 2023 to 2033

Figure 71: Latin America Market Attractiveness by Roasting Machine Type, 2023 to 2033

Figure 72: Latin America Market Attractiveness by Capacity, 2023 to 2033

Figure 73: Latin America Market Attractiveness by Country, 2023 to 2033

Figure 74: Europe Market Value (US$ Million) by Machine Type, 2023 to 2033

Figure 75: Europe Market Value (US$ Million) by Roasting Machine Type, 2023 to 2033

Figure 76: Europe Market Value (US$ Million) by Capacity, 2023 to 2033

Figure 77: Europe Market Value (US$ Million) by Country, 2023 to 2033

Figure 78: Europe Market Value (US$ Million) Analysis by Country, 2018 to 2022

Figure 79: Europe Market Volume (Units) Analysis by Country, 2018 to 2033

Figure 80: Europe Market Value Share (%) and BPS Analysis by Country, 2022 to 2032

Figure 81: Europe Market Y-o-Y Growth (%) Projections by Country, 2023 to 2033

Figure 82: Europe Market Value (US$ Million) Analysis by Machine Type, 2018 to 2022

Figure 83: Europe Market Volume (Units) Analysis by Machine Type, 2018 to 2033

Figure 84: Europe Market Value Share (%) and BPS Analysis by Machine Type, 2022 to 2032

Figure 85: Europe Market Y-o-Y Growth (%) Projections by Machine Type, 2023 to 2033

Figure 86: Europe Market Value (US$ Million) Analysis by Roasting Machine Type, 2018 to 2022

Figure 87: Europe Market Volume (Units) Analysis by Roasting Machine Type, 2018 to 2033

Figure 88: Europe Market Value Share (%) and BPS Analysis by Roasting Machine Type, 2022 to 2032

Figure 89: Europe Market Y-o-Y Growth (%) Projections by Roasting Machine Type, 2023 to 2033

Figure 90: Europe Market Value (US$ Million) Analysis by Capacity, 2018 to 2022

Figure 91: Europe Market Volume (Units) Analysis by Capacity, 2018 to 2033

Figure 92: Europe Market Value Share (%) and BPS Analysis by Capacity, 2022 to 2032

Figure 93: Europe Market Y-o-Y Growth (%) Projections by Capacity, 2023 to 2033

Figure 94: Europe Market Attractiveness by Machine Type, 2023 to 2033

Figure 95: Europe Market Attractiveness by Roasting Machine Type, 2023 to 2033

Figure 96: Europe Market Attractiveness by Capacity, 2023 to 2033

Figure 97: Europe Market Attractiveness by Country, 2023 to 2033

Figure 98: East Asia Market Value (US$ Million) by Machine Type, 2023 to 2033

Figure 99: East Asia Market Value (US$ Million) by Roasting Machine Type, 2023 to 2033

Figure 100: East Asia Market Value (US$ Million) by Capacity, 2023 to 2033

Figure 101: East Asia Market Value (US$ Million) by Country, 2023 to 2033

Figure 102: East Asia Market Value (US$ Million) Analysis by Country, 2018 to 2022

Figure 103: East Asia Market Volume (Units) Analysis by Country, 2018 to 2033

Figure 104: East Asia Market Value Share (%) and BPS Analysis by Country, 2022 to 2032

Figure 105: East Asia Market Y-o-Y Growth (%) Projections by Country, 2023 to 2033

Figure 106: East Asia Market Value (US$ Million) Analysis by Machine Type, 2018 to 2022

Figure 107: East Asia Market Volume (Units) Analysis by Machine Type, 2018 to 2033

Figure 108: East Asia Market Value Share (%) and BPS Analysis by Machine Type, 2022 to 2032

Figure 109: East Asia Market Y-o-Y Growth (%) Projections by Machine Type, 2023 to 2033

Figure 110: East Asia Market Value (US$ Million) Analysis by Roasting Machine Type, 2018 to 2022

Figure 111: East Asia Market Volume (Units) Analysis by Roasting Machine Type, 2018 to 2033

Figure 112: East Asia Market Value Share (%) and BPS Analysis by Roasting Machine Type, 2022 to 2032

Figure 113: East Asia Market Y-o-Y Growth (%) Projections by Roasting Machine Type, 2023 to 2033

Figure 114: East Asia Market Value (US$ Million) Analysis by Capacity, 2018 to 2022

Figure 115: East Asia Market Volume (Units) Analysis by Capacity, 2018 to 2033

Figure 116: East Asia Market Value Share (%) and BPS Analysis by Capacity, 2022 to 2032

Figure 117: East Asia Market Y-o-Y Growth (%) Projections by Capacity, 2023 to 2033

Figure 118: East Asia Market Attractiveness by Machine Type, 2023 to 2033

Figure 119: East Asia Market Attractiveness by Roasting Machine Type, 2023 to 2033

Figure 120: East Asia Market Attractiveness by Capacity, 2023 to 2033

Figure 121: East Asia Market Attractiveness by Country, 2023 to 2033

Figure 122: South Asia Market Value (US$ Million) by Machine Type, 2023 to 2033

Figure 123: South Asia Market Value (US$ Million) by Roasting Machine Type, 2023 to 2033

Figure 124: South Asia Market Value (US$ Million) by Capacity, 2023 to 2033

Figure 125: South Asia Market Value (US$ Million) by Country, 2023 to 2033

Figure 126: South Asia Market Value (US$ Million) Analysis by Country, 2018 to 2022

Figure 127: South Asia Market Volume (Units) Analysis by Country, 2018 to 2033

Figure 128: South Asia Market Value Share (%) and BPS Analysis by Country, 2022 to 2032

Figure 129: South Asia Market Y-o-Y Growth (%) Projections by Country, 2023 to 2033

Figure 130: South Asia Market Value (US$ Million) Analysis by Machine Type, 2018 to 2022

Figure 131: South Asia Market Volume (Units) Analysis by Machine Type, 2018 to 2033

Figure 132: South Asia Market Value Share (%) and BPS Analysis by Machine Type, 2022 to 2032

Figure 133: South Asia Market Y-o-Y Growth (%) Projections by Machine Type, 2023 to 2033

Figure 134: South Asia Market Value (US$ Million) Analysis by Roasting Machine Type, 2018 to 2022

Figure 135: South Asia Market Volume (Units) Analysis by Roasting Machine Type, 2018 to 2033

Figure 136: South Asia Market Value Share (%) and BPS Analysis by Roasting Machine Type, 2022 to 2032

Figure 137: South Asia Market Y-o-Y Growth (%) Projections by Roasting Machine Type, 2023 to 2033

Figure 138: South Asia Market Value (US$ Million) Analysis by Capacity, 2018 to 2022

Figure 139: South Asia Market Volume (Units) Analysis by Capacity, 2018 to 2033

Figure 140: South Asia Market Value Share (%) and BPS Analysis by Capacity, 2022 to 2032

Figure 141: South Asia Market Y-o-Y Growth (%) Projections by Capacity, 2023 to 2033

Figure 142: South Asia Market Attractiveness by Machine Type, 2023 to 2033

Figure 143: South Asia Market Attractiveness by Roasting Machine Type, 2023 to 2033

Figure 144: South Asia Market Attractiveness by Capacity, 2023 to 2033

Figure 145: South Asia Market Attractiveness by Country, 2023 to 2033

Figure 146: Oceania Market Value (US$ Million) by Machine Type, 2023 to 2033

Figure 147: Oceania Market Value (US$ Million) by Roasting Machine Type, 2023 to 2033

Figure 148: Oceania Market Value (US$ Million) by Capacity, 2023 to 2033

Figure 149: Oceania Market Value (US$ Million) by Country, 2023 to 2033

Figure 150: Oceania Market Value (US$ Million) Analysis by Country, 2018 to 2022

Figure 151: Oceania Market Volume (Units) Analysis by Country, 2018 to 2033

Figure 152: Oceania Market Value Share (%) and BPS Analysis by Country, 2022 to 2032

Figure 153: Oceania Market Y-o-Y Growth (%) Projections by Country, 2023 to 2033

Figure 154: Oceania Market Value (US$ Million) Analysis by Machine Type, 2018 to 2022

Figure 155: Oceania Market Volume (Units) Analysis by Machine Type, 2018 to 2033

Figure 156: Oceania Market Value Share (%) and BPS Analysis by Machine Type, 2022 to 2032

Figure 157: Oceania Market Y-o-Y Growth (%) Projections by Machine Type, 2023 to 2033

Figure 158: Oceania Market Value (US$ Million) Analysis by Roasting Machine Type, 2018 to 2022

Figure 159: Oceania Market Volume (Units) Analysis by Roasting Machine Type, 2018 to 2033

Figure 160: Oceania Market Value Share (%) and BPS Analysis by Roasting Machine Type, 2022 to 2032

Figure 161: Oceania Market Y-o-Y Growth (%) Projections by Roasting Machine Type, 2023 to 2033

Figure 162: Oceania Market Value (US$ Million) Analysis by Capacity, 2018 to 2022

Figure 163: Oceania Market Volume (Units) Analysis by Capacity, 2018 to 2033

Figure 164: Oceania Market Value Share (%) and BPS Analysis by Capacity, 2022 to 2032

Figure 165: Oceania Market Y-o-Y Growth (%) Projections by Capacity, 2023 to 2033

Figure 166: Oceania Market Attractiveness by Machine Type, 2023 to 2033

Figure 167: Oceania Market Attractiveness by Roasting Machine Type, 2023 to 2033

Figure 168: Oceania Market Attractiveness by Capacity, 2023 to 2033

Figure 169 Oceania Market Attractiveness by Country, 2023 to 2033

Figure 170: MEA Market Value (US$ Million) by Machine Type, 2023 to 2033

Figure 171: MEA Market Value (US$ Million) by Roasting Machine Type, 2023 to 2033

Figure 172: MEA Market Value (US$ Million) by Capacity, 2023 to 2033

Figure 173: MEA Market Value (US$ Million) by Country, 2023 to 2033

Figure 174: MEA Market Value (US$ Million) Analysis by Country, 2018 to 2022

Figure 175: MEA Market Volume (Units) Analysis by Country, 2018 to 2033

Figure 176: MEA Market Value Share (%) and BPS Analysis by Country, 2022 to 2032

Figure 177: MEA Market Y-o-Y Growth (%) Projections by Country, 2023 to 2033

Figure 178: MEA Market Value (US$ Million) Analysis by Machine Type, 2018 to 2022

Figure 179: MEA Market Volume (Units) Analysis by Machine Type, 2018 to 2033

Figure 180: MEA Market Value Share (%) and BPS Analysis by Machine Type, 2022 to 2032

Figure 181: MEA Market Y-o-Y Growth (%) Projections by Machine Type, 2023 to 2033

Figure 182: MEA Market Value (US$ Million) Analysis by Roasting Machine Type, 2018 to 2022

Figure 183: MEA Market Volume (Units) Analysis by Roasting Machine Type, 2018 to 2033

Figure 184: MEA Market Value Share (%) and BPS Analysis by Roasting Machine Type, 2022 to 2032

Figure 185: MEA Market Y-o-Y Growth (%) Projections by Roasting Machine Type, 2023 to 2033

Figure 186: MEA Market Value (US$ Million) Analysis by Capacity, 2018 to 2022

Figure 187: MEA Market Volume (Units) Analysis by Capacity, 2018 to 2033

Figure 188: MEA Market Value Share (%) and BPS Analysis by Capacity, 2022 to 2032

Figure 189: MEA Market Y-o-Y Growth (%) Projections by Capacity, 2023 to 2033

Figure 190: MEA Market Attractiveness by Machine Type, 2023 to 2033

Figure 191: MEA Market Attractiveness by Roasting Machine Type, 2023 to 2033

Figure 192: MEA Market Attractiveness by Capacity, 2023 to 2033

Figure 193 MEA Market Attractiveness by Country, 2023 to 2033

Explore Process Automation Insights

View Reports

Cashew Roasting Machine Market