Reports

- Global Locations -

Headquarters

Future Market Insights, Inc.

Christiana Corporate, 200
Continental Drive, Suite 401,
Newark, Delaware - 19713,
United States

T: +1-845-579-5705

Americas

Future Market Insights, Inc.

616 Corporate Way, Suite 2-9018,
Valley Cottage, NY 10989, United States

T: +1-347-918-3531

MEA

Future Market Insights

1602-6 Jumeirah Bay X2 Tower, Plot No: JLT-PH2-X2A,
Jumeirah Lakes Towers, Dubai,
United Arab Emirates

Europe

Future Market Insights

3rd Floor, 207 Regent Street,
W1B 3HH London
United Kingdom

T: + 44 (0) 20 8123 9659
D: +44 (0) 20 3287 4268

Asia Pacific

Future Market Insights

IndiaLand Global Tech Park, Unit UG-1, Behind Grand HighStreet, Phase 1, Hinjawadi, MH, Pune – 411057, India

Cashew Processing Machine Market Outlook (2023 to 2033)

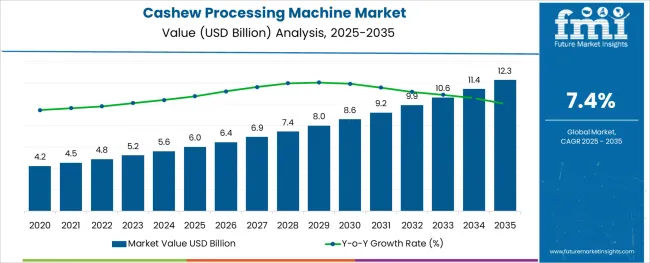
Future Market Insights' research indicates that the global cashew processing machine market would grow at a CAGR of 7.4% over the anticipated time frame. Forecasts indicate that the cashew processing machine market is expected to rise from US$ 5,203.10 million in 2023, to US$ 10624.41 million in 2033.

The cashew processing machine market is expected to grow rapidly due to the following factors:

  • Demand from households, hotels & restaurants, pubs, supplement makers, and other sectors
  • Increase in consumer demand for healthy snacks
  • Increased consumer awareness of the importance of healthy eating
  • The shift in consumer lifestyle preferences
  • Numerous health benefits associated with cashew consumption
  • The rising popularity of cashew nut milk among lactose-intolerant consumers.

However, the greatest risk for the cashew processing machine market is rising competition from local competitors and the desire for a low-priced alternative.

Don't pay for what you don't need

Customize your report by selecting specific countries or regions and save 30%!

India and Vietnam Leading the Growth of Cashew Processing Machines. FMI Digs Deeper into the Global Trends

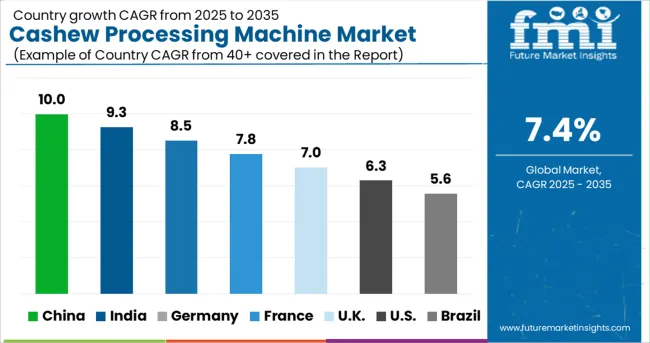
During the forecast period, the Indian cashew processing machine market is expected to grow at a CAGR of 4.0%.

The cashew market is the largest in India. Cashew prices, however, have dropped to levels not seen in the last decade twelve because of COVID-19. As the value of cashew nut byproducts tends to drop when distribution channels are interrupted, value-added operations were hit hard. As a result of the prolonged shutdown, both demand and consumption in India have taken a knock. This move is expected to propel the cashew processing machine market, as the Cashew Export Promotion Council of India (CEPCI) has pushed for the Union Government to provide adequate funding and propose a few programs to boost cashew output in the country.

The area of land used for cultivating cashews in India is 1.02 million acres, making it the greatest producer of raw cashew nuts (RCN) in the world. Cashews are farmed in the Indian states of Kerala, Karnataka, Goa, Maharashtra, Tamil Nadu, Andhra Pradesh, Orissa, and West Bengal, all of which are on the peninsula. The state of Kerala produces more than any other.

Indian firms have recently made substantial investments in the acquisition of sizable plantations and the financing and management of processing facilities in Africa to meet the rising domestic and international demand for cashew processing machines (the country is the largest cashew consumer worldwide and the second-largest exporter of cashew kernels).

Attributes Details
The market size value in 2023 US$ 5,203.10 million
Market forecast value in 2033 US$ 10624.41 million
Forecast period 2023 to 2033
Global growth rate (CAGR) 7.4%

Historical Outlook Vs Future Forecasts for global cashew processing machine market

Historically, the cashew processing machine market grew at a CAGR of 6.5% during the forecast period of 2018 to 2022.

According to Future Market Insights, the cashew processing machine market would be driven by the rising demand for superfoods with nutritional properties (FMI). Sustainable diets are becoming increasingly important to consumers as plant-based foods gain popularity.

Consumers are increasingly interested in diets that don't harm the environment while also improving their health. As people become more health conscious, earn more money, and prefer a more natural diet, they are increasingly likely to purchase environmentally friendly food options.

There has been a huge surge in the demand for clean-label items. Manufacturers in the food and drink industry are responding to this trend by releasing new goods bearing labels such as low sugar, organic, natural, plant-based, and vegan.

Due to the above factors, the cashew processing machine market is expected to grow at a CAGR of 7.4% in the coming years.

Nandini Roy Choudhury

Principal Consultant

Talk to Analyst

Find your sweet spots for generating winning opportunities in this market.

Outline of Important Trends Shaping Market Expansion

Cashews are becoming increasingly popular as a snack due to their high nutritional value.

Cashews, in their edible form, have been enjoyed as a snack for quite some time. Cashews are a staple in many Asian cuisines, both sweet and savory, and are utilized in a wide variety of recipes. Today, you can find cashews in a wide variety of products, including mueslis, energy bars, biscuits, chocolates, and ice creams. One ounce of cashews has 622 micrograms of copper, which is known to aid bone health and is therefore considered a nutrient powerhouse. Despite this, the International Nut and Dried Fruit Council reports that the demand for cashews is mostly driven by inflation.

The high fiber content of cashews, especially when compared to peanuts, aids in weight growth by facilitating good digestion. Manufacturers have responded to the demand for cashew-based snacks by releasing products like ready-to-drink cashew milk, which may be used as a lactose-free milk alternative, due to the high nutritional value of cashews. With more and more people in Europe being concerned about their health, cashew nuts have become increasingly popular as snack food. Increasingly, cashew nuts are being used as a component in spreads and snack bars (particularly organic varieties), driving up overall cashew consumption. This is changing the dry fruit processing machine market outlook.

Volatility in Raw Material Prices

Manufacturing costs are heavily influenced by the cost and availability of raw materials. The industry relies on refined petroleum products, natural and synthetic rubbers, plastic resins, inorganic chemicals, and industrial inorganic chemicals. These basic materials are very susceptible to swings in commodity prices because they are mostly derivatives of petroleum. In recent years, oil prices have been extremely unstable. Thus, this is expected to hinder the growth of the cashew processing machine market.

Eco-friendly, Biodegradable Goods are Becoming Increasingly Popular

Products made from petrochemicals release harmful carbon emissions and other byproducts into the environment. This has led to the production of a wide range of environmentally friendly products that pose no threat to human health. As a result, we have been able to synthesize bio-based solutions. Bio-based goods not only have fewer carbon footprints but they can also be tailored to suit a broad variety of uses and preferences. With more people becoming educated about the advantages of biodegradable goods, the market for such goods is poised for rapid expansion.

Companies in the cashew processing machine market are always coming out with new items and technology to satisfy the ever-shifting consumer demand. Among the companies' primary focuses is the development of bio-based goods.

Segmentation Analysis

The market for liquid cashew nutshells is expected to rise rapidly in 2021, with the polyols and NCO blocking agents segment leading the way. When compared to other natural oil polyols and synthetic polyols, CNSL polyols hold their own. In addition to being resistant to water, CNSL polyols and diols are also less susceptible to moisture during the curing process when used with isocyanate. Coatings and adhesives, among others, frequently use blocked isocyanates. This innovation allowed for the development of 1K polyurethane systems that are both more environmentally friendly and more resistant to the effects of moisture. For this reason, this technology is being included in coating processes such as electrostatic spraying, powder coating, and coil coating in order to address safety concerns.
Get the data you need at a Fraction of the cost

Personalize your report by choosing insights you need
and save 40%!

Country Analysis

How is the USA Cashew Processing Machine Market Expected to Develop?

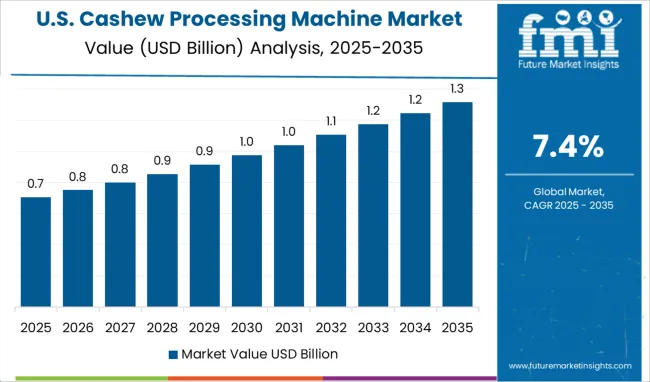
During the forecast period, the USA cashew processing machine market is anticipated to see a CAGR of 3.5%. (2022 to 2032). The cashew processing machine market in the United States has been directly and adversely impacted by the COVID-19 outbreak. Value-adding activities were significantly impacted by the closure of cashew manufacturers, which led to an increase in cashew prices.

The primary market drivers are demand from the cashew processing sectors and the health advantages of cashew consumption. States like California, Florida, New York, Texas, and New Jersey have the highest concentration of cashew consumers.

About 679 thousand dollars' worth of cashews were exported from the nation in 2020, primarily to South Korea, Jamaica, Canada, and Trinidad & Tobago. Like, the country mostly imported cashew from Honduras, Côte d'Ivoire, and Vietnam.

Cashews in their shell are imported into the United States from Vietnam, Honduras, and India. With 1.2 million dollars, Vietnam accounted for the largest portion of import value in 2019. Honduras and India come next with 66,000 and 4,000 dollars, respectively. As the nation largely imports shelled cashews, in-shell cashew imports are quite low in the United States. The United States c cashew processing machine market is primarily driven by strong demand from direct consumers and the cashew milk processing businesses there.

What are the key drivers of the European Cashew processing machine market?

During the projection period, it is anticipated that the cashew processing machine market in Europe is expected to grow at a CAGR of 3.4%. (2020 to 2025). Since there is no native production of cashews, Europe is entirely dependent on imports. Dry fruit processing machine demand is increasing at a consistent rate of 3-4% each year, making cashew the least expensive tree nut in the area. Countries including the Netherlands, the United Kingdom, France, Germany, Spain, and Italy account for most of the regional demand. The desire for ready-to-eat snacks and the nutritional value of cashews are the main factors driving the industry in this area.

The expanding global economy, rising domestic demand for bio-based goods and exports, and rising interest in performance goods are all predicted to contribute to the expansion of the cashew processing machine market. The market is anticipated to be driven by efforts to reduce VOC content. The cashew processing machine market is likely to benefit from environmental laws as well as variable raw material prices. Companies from North America and Europe work together to create environmentally friendly products.

A Look Inside Japan’s Growing Cashew Processing Machine Market

Increasing consumer demand for quick and easy meals is a key element in the expansion of the Japanese cashew processing machine market. Organic cashew nut demand has been boosted by the introduction of new flavors like butter, pepper, smoky, and salted. Veganism is gaining popularity, and consumers are responding by choosing healthier alternatives to meat and dairy. The rise in the number of working women, increased health care spending per person, rising urbanization, and expanding middle class are also contributing causes. Increased consumer awareness of the health advantages of cashew nuts and the presence of various such components are projected to drive the cashew processing machine market forward in the coming years.

What are some defining statistics for the Korean Cashew processing machine market?

According to statistics released by the Korean Bureau, the country's cashew and cashew machine imports have grown substantially. For instance, the USD 22.24m worth of cashew nuts imported by Korea in September 2021 was up 17.7% year-on-year. The value of imports from January to September of 2021 amounted to USD 125.84 million, an increase of 23% compared to the same period in 2020.

According to the specialists at the ACA, Korean consumers are most interested in the less expensive types, such as broken and diced cashews. This is mostly because of its growing popularity in the confectionery sector, where cashew kernels are traditionally utilized less frequently.
Competitive Landscape

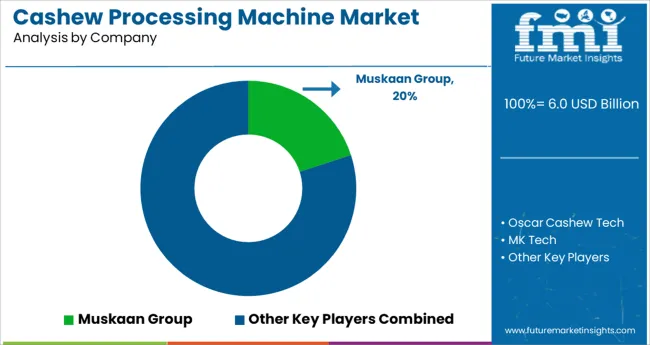
Major companies in the cashew processing machine industry hope to increase their global footprint to meet rising consumer demand. For a competitive edge, companies in the dry fruit processing machine industry are diversifying their product offerings into a wide range of tastes.

One of the most innovative start-ups in the cashew processing machine market is Treeline Cheese. Founded in the United Kingdom in 2012, cashew nuts are used to create a cheese alternative produced by Treeline Cheese. By grinding the cashews and then adding the flavorings and probiotic culture of lactobacillus acidolphus to that cream, a fermentation process is triggered that ultimately results in the cheese. Distributes its products to brick-and-mortar grocery stores (like Whole Foods) and, as of February 2016, was available in 1,000 stores throughout all 50 states.

Entering the Indian Cashew Processing Machine Market Place

As of the year 2020, cashew was grown on a total of 1.02 million hectares of land in India, with a yield of 706 kg per hectare. Maharashtra, Andhra Pradesh, Orissa, Kerala, and Karnataka are the primary cashew-growing states in India. It's anticipated that by 2050, the country is expected to need between four and five million metric tonnes of raw cashew nuts. There are around 30 cashew machine production units in Goa, split evenly between large and small operations. Although companies like Ajanta Industries and Zantye Cashew export cashews, most well-established processing operations focus on the domestic market. Thus, processing facilities have multiplied as domestic output has expanded.

The government has several regulations set in place for a more organised environment in the Indian cashew processing machine industry.

Aspiring cashew nut processors have the option of launching their venture as a sole proprietorship, a partnership, or a publicly traded company. A Permanent Account Number (PAN) and a bank account are requirements for any person or company. Partnership firms, on the other hand, need to register with the Ministry of Corporate Affairs after executing a partnership deed on Non-Judicial Stamp Paper in accordance with the Stamp Act and the Indian Partnership Act of 1932.

Establishing a food processing facility also necessitates a valid FSSAI licence. MSME and GST registration is obligatory for cashew machine processing companies. To export finished goods, you need to have an IEC Code. Businesses need permission from the local government before opening their doors. To the extent that they apply, the current situation may necessitate compliance with fire and safety regulations as well as registration under ESI, PF, and labour laws. An entrepreneur might also get in touch with the State Pollution Control Board for guidance in this area. The establishment of a cashew machine processing business may also necessitate the fulfilment of other stipulations.

Global cashew processing machine market segmentation by category

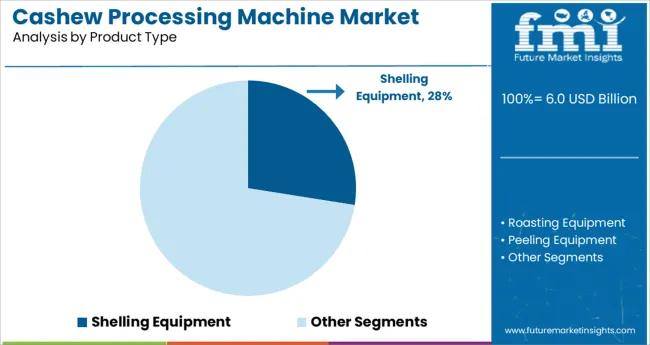
By Product type:

  • Roasting Equipment
  • Peeling Equipment
  • Drying Equipment
  • Shelling Equipment
  • Sorting and Grading Equipment
  • Others

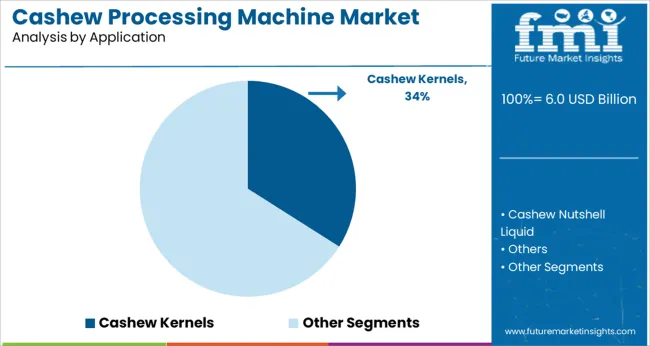
By Application:

  • Cashew Kernels
  • Cashew Nutshell Liquid
  • Others

By Region:

  • North America
  • Latin America
  • Eastern Europe
  • Western Europe
  • Asia Pacific
  • Middle East and Africa (MEA)
  • Japan

Frequently Asked Questions

How big is the cashew processing machine market?

The cashew processing machine e-market size is assessed to US$ 10624.41 Million in 2033.

At What Rate is cashew processing machine market expected to rise?

The cashew processing machine market is expected to rise at a CAGR of 7.4%.

Which are the major countries driving demand for cashew processing machine market?

India and Vietnam are the biggest producers of cashew processing machine market.

Table of Content

1. Executive Summary | Cashew Processing Machine Market

    1.1. Global Market Outlook

    1.2. Demand-side Trends

    1.3. Supply-side Trends

    1.4. Technology Roadmap Analysis

    1.5. Analysis and Recommendations

2. Market Overview

    2.1. Market Coverage / Taxonomy

    2.2. Market Definition / Scope / Limitations

3. Market Background

    3.1. Market Dynamics

        3.1.1. Drivers

        3.1.2. Restraints

        3.1.3. Opportunity

        3.1.4. Trends

    3.2. Scenario Forecast

        3.2.1. Demand in Optimistic Scenario

        3.2.2. Demand in Likely Scenario

        3.2.3. Demand in Conservative Scenario

    3.3. Product launches & Recent Developments

    3.4. Product Life Cycle Analysis

    3.5. Value Chain Analysis

        3.5.1. Supply Side Participants and their Roles

            3.5.1.1. Producers

            3.5.1.2. Mid-Level Participants (Traders/ Agents/ Brokers)

            3.5.1.3. Wholesalers and Distributors

        3.5.2. % of Operating Margin Analysis

        3.5.3. List of Raw Material Suppliers

        3.5.4. List of Existing and Potential Buyers

    3.6. Global Market - Pricing Analysis

        3.6.1. Price Point Assessment by Region

        3.6.2. Price Point Assessment by Product Type

        3.6.3. Price Forecast till 2033

        3.6.4. Factors affecting pricing

    3.7. Forecast Factors - Relevance & Impact

    3.8. Regulatory Landscape

        3.8.1. Certifications and Certifying Agency Overview

    3.9. Regional Parent Market Outlook

    3.10. Macro-Economic Factors

    3.11. Product Claims & Nutritional Information Scan by Buyers

4. Global market Analysis 2018 to 2022 and Forecast, 2023 to 2033

    4.1. Historical Market Size Value (US$ million) & Volume (MT) Analysis, 2018 to 2022

    4.2. Current and Future Market Size Value (US$ million) & Volume (MT) Projections, 2023 to 2033

        4.2.1. Y-o-Y Growth Trend Analysis

        4.2.2. Absolute $ Opportunity Analysis

5. Global market Analysis 2018 to 2022 and Forecast 2023 to 2033, By Type

    5.1. Introduction / Key Findings

    5.2. Historical Market Size Value (US$ million) & Volume (MT) Analysis By Type, 2018 to 2022

    5.3. Current and Future Market Size Value (US$ million) & Volume (MT) Analysis and Forecast By Type, 2023 to 2033

        5.3.1. Roasting Equipment

        5.3.2. Peeling Equipment

        5.3.3. Drying Equipment

        5.3.4. Shelling Equipment

        5.3.5. Sorting and Grading Equipment

        5.3.6. Others

    5.4. Y-o-Y Growth Trend Analysis By Type, 2018 to 2022

    5.5. Absolute $ Opportunity Analysis By Type, 2023 to 2033

6. Global market Analysis 2018 to 2022 and Forecast 2023 to 2033, By Application

    6.1. Introduction / Key Findings

    6.2. Historical Market Size Value (US$ million) & Volume (MT) Analysis By Application, 2018 to 2022

    6.3. Current and Future Market Size Value (US$ million) & Volume (MT) Analysis and Forecast By Application, 2023 to 2033

        6.3.1. Cashew Kernels

        6.3.2. Cashew Nut Shell Liquid

        6.3.3. Others

    6.4. Y-o-Y Growth Trend Analysis By Application, 2018 to 2022

    6.5. Absolute $ Opportunity Analysis By Application, 2023 to 2033

7. Global market Analysis 2018 to 2022 and Forecast 2023 to 2033, By Region

    7.1. Introduction

    7.2. Historical Market Size Value (US$ million) & Volume (MT) Analysis By Region, 2018 to 2022

    7.3. Current Market Size Value (US$ million) & Volume (MT) Analysis and Forecast By Region, 2023 to 2033

        7.3.1. North America

        7.3.2. Latin America

        7.3.3. Europe

        7.3.4. East Asia

        7.3.5. South Asia

        7.3.6. Oceania

        7.3.7. Middle East and Africa (MEA)

    7.4. Market Attractiveness Analysis By Region

8. North America market Analysis 2018 to 2022 and Forecast 2023 to 2033, By Country

    8.1. Historical Market Size Value (US$ million) & Volume (MT) Trend Analysis By Market Taxonomy, 2018 to 2022

    8.2. Market Size Value (US$ million) & Volume (MT) Forecast By Market Taxonomy, 2023 to 2033

        8.2.1. By Country

            8.2.1.1. The USA

            8.2.1.2. Canada

        8.2.2. By Type

        8.2.3. By Application

    8.3. Market Attractiveness Analysis

        8.3.1. By Country

        8.3.2. By Type

        8.3.3. By Application

    8.4. Key Takeaways

9. Latin America market Analysis 2018 to 2022 and Forecast 2023 to 2033, By Country

    9.1. Historical Market Size Value (US$ million) & Volume (MT) Trend Analysis By Market Taxonomy, 2018 to 2022

    9.2. Market Size Value (US$ million) & Volume (MT) Forecast By Market Taxonomy, 2023 to 2033

        9.2.1. By Country

            9.2.1.1. Brazil

            9.2.1.2. Mexico

            9.2.1.3. Argentina

            9.2.1.4. Chile

            9.2.1.5. Peru

            9.2.1.6. Rest of Latin America

        9.2.2. By Type

        9.2.3. By Application

    9.3. Market Attractiveness Analysis

        9.3.1. By Country

        9.3.2. By Type

        9.3.3. By Application

    9.4. Key Takeaways

10. Europe market Analysis 2018 to 2022 and Forecast 2023 to 2033, By Country

    10.1. Historical Market Size Value (US$ million) & Volume (MT) Trend Analysis By Market Taxonomy, 2018 to 2022

    10.2. Market Size Value (US$ million) & Volume (MT) Forecast By Market Taxonomy, 2023 to 2033

        10.2.1. By Country

            10.2.1.1. Germany

            10.2.1.2. Italy

            10.2.1.3. France

            10.2.1.4. The United Kingdom

            10.2.1.5. Spain

            10.2.1.6. Russia

            10.2.1.7. BENELUX

            10.2.1.8. Poland

            10.2.1.9. Nordic Countries

            10.2.1.10. Rest of Europe

        10.2.2. By Type

        10.2.3. By Application

    10.3. Market Attractiveness Analysis

        10.3.1. By Country

        10.3.2. By Type

        10.3.3. By Application

    10.4. Key Takeaways

11. East Asia market Analysis 2018 to 2022 and Forecast 2023 to 2033, By Country

    11.1. Historical Market Size Value (US$ million) & Volume (MT) Trend Analysis By Market Taxonomy, 2018 to 2022

    11.2. Market Size Value (US$ million) & Volume (MT) Forecast By Market Taxonomy, 2023 to 2033

        11.2.1. By Country

            11.2.1.1. China

            11.2.1.2. Japan

            11.2.1.3. South Korea

        11.2.2. By Type

        11.2.3. By Application

    11.3. Market Attractiveness Analysis

        11.3.1. By Country

        11.3.2. By Type

        11.3.3. By Application

    11.4. Key Takeaways

12. South Asia market Analysis 2018 to 2022 and Forecast 2023 to 2033, By Country

    12.1. Historical Market Size Value (US$ million) & Volume (MT) Trend Analysis By Market Taxonomy, 2018 to 2022

    12.2. Market Size Value (US$ million) & Volume (MT) Forecast By Market Taxonomy, 2023 to 2033

        12.2.1. By Country

            12.2.1.1. India

            12.2.1.2. Thailand

            12.2.1.3. Malaysia

            12.2.1.4. Indonesia

            12.2.1.5. Singapore

            12.2.1.6. Rest of South Asia

        12.2.2. By Type

        12.2.3. By Application

    12.3. Market Attractiveness Analysis

        12.3.1. By Country

        12.3.2. By Type

        12.3.3. By Application

    12.4. Key Takeaways

13. Oceania market Analysis 2018 to 2022 and Forecast 2023 to 2033, By Country

    13.1. Historical Market Size Value (US$ million) & Volume (MT) Trend Analysis By Market Taxonomy, 2018 to 2022

    13.2. Market Size Value (US$ million) & Volume (MT) Forecast By Market Taxonomy, 2023 to 2033

        13.2.1. By Country

            13.2.1.1. Australia

            13.2.1.2. New Zealand

        13.2.2. By Type

        13.2.3. By Application

    13.3. Market Attractiveness Analysis

        13.3.1. By Country

        13.3.2. By Type

        13.3.3. By Application

    13.4. Key Takeaways

14. MEA market Analysis 2018 to 2022 and Forecast 2023 to 2033, By Country

    14.1. Historical Market Size Value (US$ million) & Volume (MT) Trend Analysis By Market Taxonomy, 2018 to 2022

    14.2. Market Size Value (US$ million) & Volume (MT) Forecast By Market Taxonomy, 2023 to 2033

        14.2.1. By Country

            14.2.1.1. GCC Countries

            14.2.1.2. South Africa

            14.2.1.3. Central Africa

            14.2.1.4. North Africa

        14.2.2. By Type

        14.2.3. By Application

    14.3. Market Attractiveness Analysis

        14.3.1. By Country

        14.3.2. By Type

        14.3.3. By Application

    14.4. Key Takeaways

15. Key Countries Market Analysis

    15.1. The USA

        15.1.1. Pricing Analysis

        15.1.2. Market Share Analysis, 2022

            15.1.2.1. By Type

            15.1.2.2. By Application

    15.2. Canada

        15.2.1. Pricing Analysis

        15.2.2. Market Share Analysis, 2022

            15.2.2.1. By Type

            15.2.2.2. By Application

    15.3. Brazil

        15.3.1. Pricing Analysis

        15.3.2. Market Share Analysis, 2022

            15.3.2.1. By Type

            15.3.2.2. By Application

    15.4. Mexico

        15.4.1. Pricing Analysis

        15.4.2. Market Share Analysis, 2022

            15.4.2.1. By Type

            15.4.2.2. By Application

    15.5. Argentina

        15.5.1. Pricing Analysis

        15.5.2. Market Share Analysis, 2022

            15.5.2.1. By Type

            15.5.2.2. By Application

    15.6. Chile

        15.6.1. Pricing Analysis

        15.6.2. Market Share Analysis, 2022

            15.6.2.1. By Type

            15.6.2.2. By Application

    15.7. Peru

        15.7.1. Pricing Analysis

        15.7.2. Market Share Analysis, 2022

            15.7.2.1. By Type

            15.7.2.2. By Application

    15.8. Germany

        15.8.1. Pricing Analysis

        15.8.2. Market Share Analysis, 2022

            15.8.2.1. By Type

            15.8.2.2. By Application

    15.9. Italy

        15.9.1. Pricing Analysis

        15.9.2. Market Share Analysis, 2022

            15.9.2.1. By Type

            15.9.2.2. By Application

    15.10. France

        15.10.1. Pricing Analysis

        15.10.2. Market Share Analysis, 2022

            15.10.2.1. By Type

            15.10.2.2. By Application

    15.11. Spain

        15.11.1. Pricing Analysis

        15.11.2. Market Share Analysis, 2022

            15.11.2.1. By Type

            15.11.2.2. By Application

    15.12. The United Kingdom

        15.12.1. Pricing Analysis

        15.12.2. Market Share Analysis, 2022

            15.12.2.1. By Type

            15.12.2.2. By Application

    15.13. Russia

        15.13.1. Pricing Analysis

        15.13.2. Market Share Analysis, 2022

            15.13.2.1. By Type

            15.13.2.2. By Application

    15.14. Poland

        15.14.1. Pricing Analysis

        15.14.2. Market Share Analysis, 2022

            15.14.2.1. By Type

            15.14.2.2. By Application

    15.15. BENELUX

        15.15.1. Pricing Analysis

        15.15.2. Market Share Analysis, 2022

            15.15.2.1. By Type

            15.15.2.2. By Application

    15.16. Nordic Countries

        15.16.1. Pricing Analysis

        15.16.2. Market Share Analysis, 2022

            15.16.2.1. By Type

            15.16.2.2. By Application

    15.17. China

        15.17.1. Pricing Analysis

        15.17.2. Market Share Analysis, 2022

            15.17.2.1. By Type

            15.17.2.2. By Application

    15.18. Japan

        15.18.1. Pricing Analysis

        15.18.2. Market Share Analysis, 2022

            15.18.2.1. By Type

            15.18.2.2. By Application

    15.19. South Korea

        15.19.1. Pricing Analysis

        15.19.2. Market Share Analysis, 2022

            15.19.2.1. By Type

            15.19.2.2. By Application

    15.20. India

        15.20.1. Pricing Analysis

        15.20.2. Market Share Analysis, 2022

            15.20.2.1. By Type

            15.20.2.2. By Application

    15.21. Thailand

        15.21.1. Pricing Analysis

        15.21.2. Market Share Analysis, 2022

            15.21.2.1. By Type

            15.21.2.2. By Application

    15.22. Indonesia

        15.22.1. Pricing Analysis

        15.22.2. Market Share Analysis, 2022

            15.22.2.1. By Type

            15.22.2.2. By Application

    15.23. Malaysia

        15.23.1. Pricing Analysis

        15.23.2. Market Share Analysis, 2022

            15.23.2.1. By Type

            15.23.2.2. By Application

    15.24. Singapore

        15.24.1. Pricing Analysis

        15.24.2. Market Share Analysis, 2022

            15.24.2.1. By Type

            15.24.2.2. By Application

    15.25. Australia

        15.25.1. Pricing Analysis

        15.25.2. Market Share Analysis, 2022

            15.25.2.1. By Type

            15.25.2.2. By Application

    15.26. New Zealand

        15.26.1. Pricing Analysis

        15.26.2. Market Share Analysis, 2022

            15.26.2.1. By Type

            15.26.2.2. By Application

    15.27. GCC Countries

        15.27.1. Pricing Analysis

        15.27.2. Market Share Analysis, 2022

            15.27.2.1. By Type

            15.27.2.2. By Application

    15.28. South Africa

        15.28.1. Pricing Analysis

        15.28.2. Market Share Analysis, 2022

            15.28.2.1. By Type

            15.28.2.2. By Application

    15.29. North Africa

        15.29.1. Pricing Analysis

        15.29.2. Market Share Analysis, 2022

            15.29.2.1. By Type

            15.29.2.2. By Application

    15.30. Central Africa

        15.30.1. Pricing Analysis

        15.30.2. Market Share Analysis, 2022

            15.30.2.1. By Type

            15.30.2.2. By Application

16. Market Structure Analysis

    16.1. Competition Dashboard

    16.2. Competition Benchmarking

    16.3. Market Share Analysis of Top Players

        16.3.1. By Regional

        16.3.2. By Type

        16.3.3. By Application

17. Competition Analysis

    17.1. Competition Deep Dive

        17.1.1. Muskaan Group 

            17.1.1.1. Overview

            17.1.1.2. Product Portfolio

            17.1.1.3. Profitability by Market Segments (Product/Age /Sales Channel/Region)

            17.1.1.4. Sales Footprint

            17.1.1.5. Strategy Overview

                17.1.1.5.1. Marketing Strategy

                17.1.1.5.2. Product Strategy

                17.1.1.5.3. Channel Strategy

        17.1.2. Oscar Cashew Tech

            17.1.2.1. Overview

            17.1.2.2. Product Portfolio

            17.1.2.3. Profitability by Market Segments (Product/Age /Sales Channel/Region)

            17.1.2.4. Sales Footprint

            17.1.2.5. Strategy Overview

                17.1.2.5.1. Marketing Strategy

                17.1.2.5.2. Product Strategy

                17.1.2.5.3. Channel Strategy

        17.1.3. MK Tech

            17.1.3.1. Overview

            17.1.3.2. Product Portfolio

            17.1.3.3. Profitability by Market Segments (Product/Age /Sales Channel/Region)

            17.1.3.4. Sales Footprint

            17.1.3.5. Strategy Overview

                17.1.3.5.1. Marketing Strategy

                17.1.3.5.2. Product Strategy

                17.1.3.5.3. Channel Strategy

        17.1.4. Oltremare

            17.1.4.1. Overview

            17.1.4.2. Product Portfolio

            17.1.4.3. Profitability by Market Segments (Product/Age /Sales Channel/Region)

            17.1.4.4. Sales Footprint

            17.1.4.5. Strategy Overview

                17.1.4.5.1. Marketing Strategy

                17.1.4.5.2. Product Strategy

                17.1.4.5.3. Channel Strategy

        17.1.5. APS Industries

            17.1.5.1. Overview

            17.1.5.2. Product Portfolio

            17.1.5.3. Profitability by Market Segments (Product/Age /Sales Channel/Region)

            17.1.5.4. Sales Footprint

            17.1.5.5. Strategy Overview

                17.1.5.5.1. Marketing Strategy

                17.1.5.5.2. Product Strategy

                17.1.5.5.3. Channel Strategy

        17.1.6. Sairaj Machinery

            17.1.6.1. Overview

            17.1.6.2. Product Portfolio

            17.1.6.3. Profitability by Market Segments (Product/Age /Sales Channel/Region)

            17.1.6.4. Sales Footprint

            17.1.6.5. Strategy Overview

                17.1.6.5.1. Marketing Strategy

                17.1.6.5.2. Product Strategy

                17.1.6.5.3. Channel Strategy

        17.1.7. Cashew Processing Machinery

            17.1.7.1. Overview

            17.1.7.2. Product Portfolio

            17.1.7.3. Profitability by Market Segments (Product/Age /Sales Channel/Region)

            17.1.7.4. Sales Footprint

            17.1.7.5. Strategy Overview

                17.1.7.5.1. Marketing Strategy

                17.1.7.5.2. Product Strategy

                17.1.7.5.3. Channel Strategy

        17.1.8. Shri Avdhut Industries

            17.1.8.1. Overview

            17.1.8.2. Product Portfolio

            17.1.8.3. Profitability by Market Segments (Product/Age /Sales Channel/Region)

            17.1.8.4. Sales Footprint

            17.1.8.5. Strategy Overview

                17.1.8.5.1. Marketing Strategy

                17.1.8.5.2. Product Strategy

                17.1.8.5.3. Channel Strategy

        17.1.9. TOMRA

            17.1.9.1. Overview

            17.1.9.2. Product Portfolio

            17.1.9.3. Profitability by Market Segments (Product/Age /Sales Channel/Region)

            17.1.9.4. Sales Footprint

            17.1.9.5. Strategy Overview

                17.1.9.5.1. Marketing Strategy

                17.1.9.5.2. Product Strategy

                17.1.9.5.3. Channel Strategy

        17.1.10. Alidhra Cashew Industries

            17.1.10.1. Overview

            17.1.10.2. Product Portfolio

            17.1.10.3. Profitability by Market Segments (Product/Age /Sales Channel/Region)

            17.1.10.4. Sales Footprint

            17.1.10.5. Strategy Overview

                17.1.10.5.1. Marketing Strategy

                17.1.10.5.2. Product Strategy

                17.1.10.5.3. Channel Strategy

        17.1.11. Suraj Engineering, Rotex Transmission

            17.1.11.1. Overview

            17.1.11.2. Product Portfolio

            17.1.11.3. Profitability by Market Segments (Product/Age /Sales Channel/Region)

            17.1.11.4. Sales Footprint

            17.1.11.5. Strategy Overview

                17.1.11.5.1. Marketing Strategy

                17.1.11.5.2. Product Strategy

                17.1.11.5.3. Channel Strategy

        17.1.12. Rami International

            17.1.12.1. Overview

            17.1.12.2. Product Portfolio

            17.1.12.3. Profitability by Market Segments (Product/Age /Sales Channel/Region)

            17.1.12.4. Sales Footprint

            17.1.12.5. Strategy Overview

                17.1.12.5.1. Marketing Strategy

                17.1.12.5.2. Product Strategy

                17.1.12.5.3. Channel Strategy

        17.1.13. Nuttech.eu

            17.1.13.1. Overview

            17.1.13.2. Product Portfolio

            17.1.13.3. Profitability by Market Segments (Product/Age /Sales Channel/Region)

            17.1.13.4. Sales Footprint

            17.1.13.5. Strategy Overview

                17.1.13.5.1. Marketing Strategy

                17.1.13.5.2. Product Strategy

                17.1.13.5.3. Channel Strategy

        17.1.14. JEM Equipment

            17.1.14.1. Overview

            17.1.14.2. Product Portfolio

            17.1.14.3. Profitability by Market Segments (Product/Age /Sales Channel/Region)

            17.1.14.4. Sales Footprint

            17.1.14.5. Strategy Overview

                17.1.14.5.1. Marketing Strategy

                17.1.14.5.2. Product Strategy

                17.1.14.5.3. Channel Strategy

        17.1.15. AC Horn Manufacturing

            17.1.15.1. Overview

            17.1.15.2. Product Portfolio

            17.1.15.3. Profitability by Market Segments (Product/Age /Sales Channel/Region)

            17.1.15.4. Sales Footprint

            17.1.15.5. Strategy Overview

                17.1.15.5.1. Marketing Strategy

                17.1.15.5.2. Product Strategy

                17.1.15.5.3. Channel Strategy

        17.1.16. Savage Equipment.

            17.1.16.1. Overview

            17.1.16.2. Product Portfolio

            17.1.16.3. Profitability by Market Segments (Product/Age /Sales Channel/Region)

            17.1.16.4. Sales Footprint

            17.1.16.5. Strategy Overview

                17.1.16.5.1. Marketing Strategy

                17.1.16.5.2. Product Strategy

                17.1.16.5.3. Channel Strategy

        17.1.17. Others as per request

            17.1.17.1. Overview

            17.1.17.2. Product Portfolio

            17.1.17.3. Profitability by Market Segments (Product/Age /Sales Channel/Region)

            17.1.17.4. Sales Footprint

            17.1.17.5. Strategy Overview

                17.1.17.5.1. Marketing Strategy

                17.1.17.5.2. Product Strategy

                17.1.17.5.3. Channel Strategy

18. Assumptions & Acronyms Used

19. Research Methodology

Don't pay for what you don't need

Customize your report by selecting specific countries or regions and save 30%!

List of Tables

Table 1: Global Market Value (US$ million) Forecast by Region, 2018 to 2033

Table 2: Global Market Volume (Units) Forecast by Region, 2018 to 2033

Table 3: Global Market Value (US$ million) Forecast by Type, 2018 to 2033

Table 4: Global Market Volume (Units) Forecast by Type, 2018 to 2033

Table 5: Global Market Value (US$ million) Forecast by Application, 2018 to 2033

Table 6: Global Market Volume (Units) Forecast by Application, 2018 to 2033

Table 7: North America Market Value (US$ million) Forecast by Country, 2018 to 2033

Table 8: North America Market Volume (Units) Forecast by Country, 2018 to 2033

Table 9: North America Market Value (US$ million) Forecast by Type, 2018 to 2033

Table 10: North America Market Volume (Units) Forecast by Type, 2018 to 2033

Table 11: North America Market Value (US$ million) Forecast by Application, 2018 to 2033

Table 12: North America Market Volume (Units) Forecast by Application, 2018 to 2033

Table 13: Latin America Market Value (US$ million) Forecast by Country, 2018 to 2033

Table 14: Latin America Market Volume (Units) Forecast by Country, 2018 to 2033

Table 15: Latin America Market Value (US$ million) Forecast by Type, 2018 to 2033

Table 16: Latin America Market Volume (Units) Forecast by Type, 2018 to 2033

Table 17: Latin America Market Value (US$ million) Forecast by Application, 2018 to 2033

Table 18: Latin America Market Volume (Units) Forecast by Application, 2018 to 2033

Table 19: Europe Market Value (US$ million) Forecast by Country, 2018 to 2033

Table 20: Europe Market Volume (Units) Forecast by Country, 2018 to 2033

Table 21: Europe Market Value (US$ million) Forecast by Type, 2018 to 2033

Table 22: Europe Market Volume (Units) Forecast by Type, 2018 to 2033

Table 23: Europe Market Value (US$ million) Forecast by Application, 2018 to 2033

Table 24: Europe Market Volume (Units) Forecast by Application, 2018 to 2033

Table 25: East Asia Market Value (US$ million) Forecast by Country, 2018 to 2033

Table 26: East Asia Market Volume (Units) Forecast by Country, 2018 to 2033

Table 27: East Asia Market Value (US$ million) Forecast by Type, 2018 to 2033

Table 28: East Asia Market Volume (Units) Forecast by Type, 2018 to 2033

Table 29: East Asia Market Value (US$ million) Forecast by Application, 2018 to 2033

Table 30: East Asia Market Volume (Units) Forecast by Application, 2018 to 2033

Table 31: South Asia Market Value (US$ million) Forecast by Country, 2018 to 2033

Table 32: South Asia Market Volume (Units) Forecast by Country, 2018 to 2033

Table 33: South Asia Market Value (US$ million) Forecast by Type, 2018 to 2033

Table 34: South Asia Market Volume (Units) Forecast by Type, 2018 to 2033

Table 35: South Asia Market Value (US$ million) Forecast by Application, 2018 to 2033

Table 36: South Asia Market Volume (Units) Forecast by Application, 2018 to 2033

Table 37: Oceania Market Value (US$ million) Forecast by Country, 2018 to 2033

Table 38: Oceania Market Volume (Units) Forecast by Country, 2018 to 2033

Table 39: Oceania Market Value (US$ million) Forecast by Type, 2018 to 2033

Table 40: Oceania Market Volume (Units) Forecast by Type, 2018 to 2033

Table 41: Oceania Market Value (US$ million) Forecast by Application, 2018 to 2033

Table 42: Oceania Market Volume (Units) Forecast by Application, 2018 to 2033

Table 43: MEA Market Value (US$ million) Forecast by Country, 2018 to 2033

Table 44: MEA Market Volume (Units) Forecast by Country, 2018 to 2033

Table 45: MEA Market Value (US$ million) Forecast by Type, 2018 to 2033

Table 46: MEA Market Volume (Units) Forecast by Type, 2018 to 2033

Table 47: MEA Market Value (US$ million) Forecast by Application, 2018 to 2033

Table 48: MEA Market Volume (Units) Forecast by Application, 2018 to 2033
Nandini Roy Choudhury

Principal Consultant

Talk to Analyst

Find your sweet spots for generating winning opportunities in this market.

List of Charts

Figure 1: Global Market Value (US$ million) by Type, 2023 to 2033

Figure 2: Global Market Value (US$ million) by Application, 2023 to 2033

Figure 3: Global Market Value (US$ million) by Region, 2023 to 2033

Figure 4: Global Market Value (US$ million) Analysis by Region, 2018 to 2033

Figure 5: Global Market Volume (Units) Analysis by Region, 2018 to 2033

Figure 6: Global Market Value Share (%) and BPS Analysis by Region, 2023 to 2033

Figure 7: Global Market Y-o-Y Growth (%) Projections by Region, 2023 to 2033

Figure 8: Global Market Value (US$ million) Analysis by Type, 2018 to 2033

Figure 9: Global Market Volume (Units) Analysis by Type, 2018 to 2033

Figure 10: Global Market Value Share (%) and BPS Analysis by Type, 2023 to 2033

Figure 11: Global Market Y-o-Y Growth (%) Projections by Type, 2023 to 2033

Figure 12: Global Market Value (US$ million) Analysis by Application, 2018 to 2033

Figure 13: Global Market Volume (Units) Analysis by Application, 2018 to 2033

Figure 14: Global Market Value Share (%) and BPS Analysis by Application, 2023 to 2033

Figure 15: Global Market Y-o-Y Growth (%) Projections by Application, 2023 to 2033

Figure 16: Global Market Attractiveness by Type, 2023 to 2033

Figure 17: Global Market Attractiveness by Application, 2023 to 2033

Figure 18: Global Market Attractiveness by Region, 2023 to 2033

Figure 19: North America Market Value (US$ million) by Type, 2023 to 2033

Figure 20: North America Market Value (US$ million) by Application, 2023 to 2033

Figure 21: North America Market Value (US$ million) by Country, 2023 to 2033

Figure 22: North America Market Value (US$ million) Analysis by Country, 2018 to 2033

Figure 23: North America Market Volume (Units) Analysis by Country, 2018 to 2033

Figure 24: North America Market Value Share (%) and BPS Analysis by Country, 2023 to 2033

Figure 25: North America Market Y-o-Y Growth (%) Projections by Country, 2023 to 2033

Figure 26: North America Market Value (US$ million) Analysis by Type, 2018 to 2033

Figure 27: North America Market Volume (Units) Analysis by Type, 2018 to 2033

Figure 28: North America Market Value Share (%) and BPS Analysis by Type, 2023 to 2033

Figure 29: North America Market Y-o-Y Growth (%) Projections by Type, 2023 to 2033

Figure 30: North America Market Value (US$ million) Analysis by Application, 2018 to 2033

Figure 31: North America Market Volume (Units) Analysis by Application, 2018 to 2033

Figure 32: North America Market Value Share (%) and BPS Analysis by Application, 2023 to 2033

Figure 33: North America Market Y-o-Y Growth (%) Projections by Application, 2023 to 2033

Figure 34: North America Market Attractiveness by Type, 2023 to 2033

Figure 35: North America Market Attractiveness by Application, 2023 to 2033

Figure 36: North America Market Attractiveness by Country, 2023 to 2033

Figure 37: Latin America Market Value (US$ million) by Type, 2023 to 2033

Figure 38: Latin America Market Value (US$ million) by Application, 2023 to 2033

Figure 39: Latin America Market Value (US$ million) by Country, 2023 to 2033

Figure 40: Latin America Market Value (US$ million) Analysis by Country, 2018 to 2033

Figure 41: Latin America Market Volume (Units) Analysis by Country, 2018 to 2033

Figure 42: Latin America Market Value Share (%) and BPS Analysis by Country, 2023 to 2033

Figure 43: Latin America Market Y-o-Y Growth (%) Projections by Country, 2023 to 2033

Figure 44: Latin America Market Value (US$ million) Analysis by Type, 2018 to 2033

Figure 45: Latin America Market Volume (Units) Analysis by Type, 2018 to 2033

Figure 46: Latin America Market Value Share (%) and BPS Analysis by Type, 2023 to 2033

Figure 47: Latin America Market Y-o-Y Growth (%) Projections by Type, 2023 to 2033

Figure 48: Latin America Market Value (US$ million) Analysis by Application, 2018 to 2033

Figure 49: Latin America Market Volume (Units) Analysis by Application, 2018 to 2033

Figure 50: Latin America Market Value Share (%) and BPS Analysis by Application, 2023 to 2033

Figure 51: Latin America Market Y-o-Y Growth (%) Projections by Application, 2023 to 2033

Figure 52: Latin America Market Attractiveness by Type, 2023 to 2033

Figure 53: Latin America Market Attractiveness by Application, 2023 to 2033

Figure 54: Latin America Market Attractiveness by Country, 2023 to 2033

Figure 55: Europe Market Value (US$ million) by Type, 2023 to 2033

Figure 56: Europe Market Value (US$ million) by Application, 2023 to 2033

Figure 57: Europe Market Value (US$ million) by Country, 2023 to 2033

Figure 58: Europe Market Value (US$ million) Analysis by Country, 2018 to 2033

Figure 59: Europe Market Volume (Units) Analysis by Country, 2018 to 2033

Figure 60: Europe Market Value Share (%) and BPS Analysis by Country, 2023 to 2033

Figure 61: Europe Market Y-o-Y Growth (%) Projections by Country, 2023 to 2033

Figure 62: Europe Market Value (US$ million) Analysis by Type, 2018 to 2033

Figure 63: Europe Market Volume (Units) Analysis by Type, 2018 to 2033

Figure 64: Europe Market Value Share (%) and BPS Analysis by Type, 2023 to 2033

Figure 65: Europe Market Y-o-Y Growth (%) Projections by Type, 2023 to 2033

Figure 66: Europe Market Value (US$ million) Analysis by Application, 2018 to 2033

Figure 67: Europe Market Volume (Units) Analysis by Application, 2018 to 2033

Figure 68: Europe Market Value Share (%) and BPS Analysis by Application, 2023 to 2033

Figure 69: Europe Market Y-o-Y Growth (%) Projections by Application, 2023 to 2033

Figure 70: Europe Market Attractiveness by Type, 2023 to 2033

Figure 71: Europe Market Attractiveness by Application, 2023 to 2033

Figure 72: Europe Market Attractiveness by Country, 2023 to 2033

Figure 73: East Asia Market Value (US$ million) by Type, 2023 to 2033

Figure 74: East Asia Market Value (US$ million) by Application, 2023 to 2033

Figure 75: East Asia Market Value (US$ million) by Country, 2023 to 2033

Figure 76: East Asia Market Value (US$ million) Analysis by Country, 2018 to 2033

Figure 77: East Asia Market Volume (Units) Analysis by Country, 2018 to 2033

Figure 78: East Asia Market Value Share (%) and BPS Analysis by Country, 2023 to 2033

Figure 79: East Asia Market Y-o-Y Growth (%) Projections by Country, 2023 to 2033

Figure 80: East Asia Market Value (US$ million) Analysis by Type, 2018 to 2033

Figure 81: East Asia Market Volume (Units) Analysis by Type, 2018 to 2033

Figure 82: East Asia Market Value Share (%) and BPS Analysis by Type, 2023 to 2033

Figure 83: East Asia Market Y-o-Y Growth (%) Projections by Type, 2023 to 2033

Figure 84: East Asia Market Value (US$ million) Analysis by Application, 2018 to 2033

Figure 85: East Asia Market Volume (Units) Analysis by Application, 2018 to 2033

Figure 86: East Asia Market Value Share (%) and BPS Analysis by Application, 2023 to 2033

Figure 87: East Asia Market Y-o-Y Growth (%) Projections by Application, 2023 to 2033

Figure 88: East Asia Market Attractiveness by Type, 2023 to 2033

Figure 89: East Asia Market Attractiveness by Application, 2023 to 2033

Figure 90: East Asia Market Attractiveness by Country, 2023 to 2033

Figure 91: South Asia Market Value (US$ million) by Type, 2023 to 2033

Figure 92: South Asia Market Value (US$ million) by Application, 2023 to 2033

Figure 93: South Asia Market Value (US$ million) by Country, 2023 to 2033

Figure 94: South Asia Market Value (US$ million) Analysis by Country, 2018 to 2033

Figure 95: South Asia Market Volume (Units) Analysis by Country, 2018 to 2033

Figure 96: South Asia Market Value Share (%) and BPS Analysis by Country, 2023 to 2033

Figure 97: South Asia Market Y-o-Y Growth (%) Projections by Country, 2023 to 2033

Figure 98: South Asia Market Value (US$ million) Analysis by Type, 2018 to 2033

Figure 99: South Asia Market Volume (Units) Analysis by Type, 2018 to 2033

Figure 100: South Asia Market Value Share (%) and BPS Analysis by Type, 2023 to 2033

Figure 101: South Asia Market Y-o-Y Growth (%) Projections by Type, 2023 to 2033

Figure 102: South Asia Market Value (US$ million) Analysis by Application, 2018 to 2033

Figure 103: South Asia Market Volume (Units) Analysis by Application, 2018 to 2033

Figure 104: South Asia Market Value Share (%) and BPS Analysis by Application, 2023 to 2033

Figure 105: South Asia Market Y-o-Y Growth (%) Projections by Application, 2023 to 2033

Figure 106: South Asia Market Attractiveness by Type, 2023 to 2033

Figure 107: South Asia Market Attractiveness by Application, 2023 to 2033

Figure 108: South Asia Market Attractiveness by Country, 2023 to 2033

Figure 109: Oceania Market Value (US$ million) by Type, 2023 to 2033

Figure 110: Oceania Market Value (US$ million) by Application, 2023 to 2033

Figure 111: Oceania Market Value (US$ million) by Country, 2023 to 2033

Figure 112: Oceania Market Value (US$ million) Analysis by Country, 2018 to 2033

Figure 113: Oceania Market Volume (Units) Analysis by Country, 2018 to 2033

Figure 114: Oceania Market Value Share (%) and BPS Analysis by Country, 2023 to 2033

Figure 115: Oceania Market Y-o-Y Growth (%) Projections by Country, 2023 to 2033

Figure 116: Oceania Market Value (US$ million) Analysis by Type, 2018 to 2033

Figure 117: Oceania Market Volume (Units) Analysis by Type, 2018 to 2033

Figure 118: Oceania Market Value Share (%) and BPS Analysis by Type, 2023 to 2033

Figure 119: Oceania Market Y-o-Y Growth (%) Projections by Type, 2023 to 2033

Figure 120: Oceania Market Value (US$ million) Analysis by Application, 2018 to 2033

Figure 121: Oceania Market Volume (Units) Analysis by Application, 2018 to 2033

Figure 122: Oceania Market Value Share (%) and BPS Analysis by Application, 2023 to 2033

Figure 123: Oceania Market Y-o-Y Growth (%) Projections by Application, 2023 to 2033

Figure 124: Oceania Market Attractiveness by Type, 2023 to 2033

Figure 125: Oceania Market Attractiveness by Application, 2023 to 2033

Figure 126: Oceania Market Attractiveness by Country, 2023 to 2033

Figure 127: MEA Market Value (US$ million) by Type, 2023 to 2033

Figure 128: MEA Market Value (US$ million) by Application, 2023 to 2033

Figure 129: MEA Market Value (US$ million) by Country, 2023 to 2033

Figure 130: MEA Market Value (US$ million) Analysis by Country, 2018 to 2033

Figure 131: MEA Market Volume (Units) Analysis by Country, 2018 to 2033

Figure 132: MEA Market Value Share (%) and BPS Analysis by Country, 2023 to 2033

Figure 133: MEA Market Y-o-Y Growth (%) Projections by Country, 2023 to 2033

Figure 134: MEA Market Value (US$ million) Analysis by Type, 2018 to 2033

Figure 135: MEA Market Volume (Units) Analysis by Type, 2018 to 2033

Figure 136: MEA Market Value Share (%) and BPS Analysis by Type, 2023 to 2033

Figure 137: MEA Market Y-o-Y Growth (%) Projections by Type, 2023 to 2033

Figure 138: MEA Market Value (US$ million) Analysis by Application, 2018 to 2033

Figure 139: MEA Market Volume (Units) Analysis by Application, 2018 to 2033

Figure 140: MEA Market Value Share (%) and BPS Analysis by Application, 2023 to 2033

Figure 141: MEA Market Y-o-Y Growth (%) Projections by Application, 2023 to 2033

Figure 142: MEA Market Attractiveness by Type, 2023 to 2033

Figure 143: MEA Market Attractiveness by Application, 2023 to 2033

Figure 144: MEA Market Attractiveness by Country, 2023 to 2033

Explore Process Automation Insights

View Reports

Cashew Processing Machine Market