Tea Processing Equipment Market Analysis – Size, Share, and Forecast 2023 to 2033

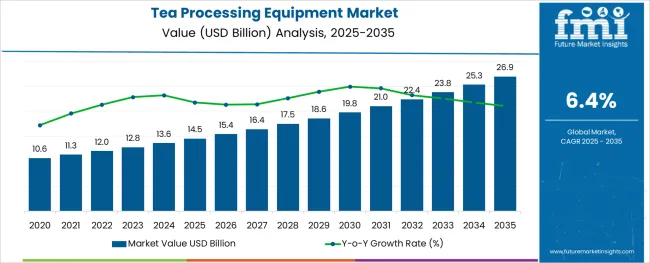
The global tea processing equipment market size is expected to reach a valuation of USD 12.8 Billion in 2023. Furthermore, with increasing consumption of various types of teas across the world, the overall demand for tea processing equipment is projected to grow at 6.4% CAGR between 2023 and 2033, surpassing a valuation of USD 25.4 Billion by the end of 2033.

Tea is one of the world’s oldest beverages, and the most consumed drink in the world, after water. It plays a significant role in rural development, poverty reduction, and food security in exporting and developing countries.

Tea is available in many varieties, which differ according to the applied oxidation and fermentation technique. While most of the tea produced is consumed domestically, tea is a widely traded and exported commodity.

Over the years, the global tea industry has seen rapid growth, with a rising number of consumers globally. It has become one of the favorite beverages of health-conscious consumers as it is believed that drinking tea can bring many health benefits, from anti-inflammatory to antioxidant and weight loss effects.

Tea processing equipment is machines that are used for producing tea on large scales. Tea sorting equipment, orthodox tea machines, fiber extractors, CTC tea processing equipment, tea drying equipment, tea grading equipment, and tea powder grinding machines are examples of regularly used tea processing machines by manufacturers.

Tea processing equipment is dominantly used for commercial purposes. However, some manual machines may be operated at a domestic level. Rising consumption of teas across the world is expected to drive the tea processing equipment market during the forecast period.

Regionally, North America holds the largest market share in the global tea processing equipment market. However, Asia Pacific is likely to emerge as the global leader considering favorable regulatory changes and the high growth of tea producers.

Attribute Key Insights
Tea Processing Equipment Market Estimated Value (2023) USD 12.8 Billion
Projected Market Value (2033) USD 25.4 Billion
Value-based CAGR (2023 to 2033) 6.4%
Market Share of Asia Pacific 22%

2017 to 2022 Global Tea Processing Equipment Sales Outlook Compared to Forecast from 2023 to 2033

The global sales of tea processing equipment are projected to rise at 6.4% CAGR between 2023 and 2033 in comparison to the 7.1% CAGR registered during the historical period of 2017 to 2022.

Rising production and consumption of various types of teas across the world is a key factor driving growth in the global tea processing equipment market and the trend is likely to continue during the forecast period.

Similarly, tea processing equipment sales will be driven by the increased adoption of automation by tea manufacturing companies. Teas come in a wide variety of flavors, and tea brands around the world are continuing to evolve by introducing new ones. As a result, producing distinct varieties of tea has grown more difficult for manufacturers.

With the development of automation in tea processing machinery, manufacturers may quickly create a variety of teas on a wide scale without sacrificing quality, while also lowering operating costs through reduced labor involvement.

Similarly, the rising number of new start-ups, especially across top tea-producing countries such as India, China, and Sri Lanka is expected to generate high demand for tea-processing equipment during the next ten years.

Key Trends Shaping the Growth of the Tea Processing Equipment Market

The rise in Tea Export and the Growing Popularity of Automatic Machines boosted the Market Over the Next Decade

In recent years, there has been a sharp rise in the export of various teas due to increasing consumption across countries like India, China, Sri Lanka, and the USA This is playing a key role in generating demand for tea processing equipment and the trend is likely to continue during the forecast period.

Similarly, tea manufacturers are installing automatic tea processing equipment in their facilities to increase their production capacity, reduce labor costs, and improve product quality. This will further aid in the expansion of the tea processing equipment market over the next ten years.
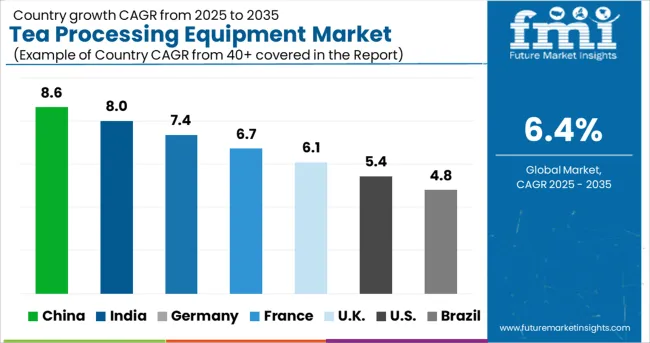
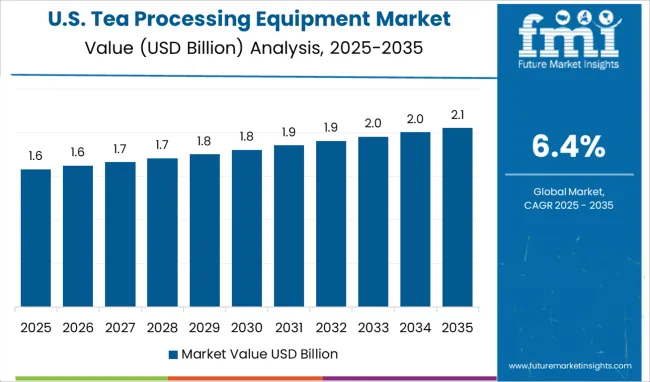
Top Countries Leading Adoption of Tea Processing Technologies

How is the USA Tea Processing Equipment Market Shaping?

Rapid Growth of Green Tea Industry Pushing Demand in the USA

According to FMI, the USA tea processing equipment market is valued at USD 2.4 Billion and it is poised to exhibit a robust CAGR during the next ten years, making it one of the most lucrative markets across North America.

The rising adoption of advanced manufacturing machinery, the strong presence of leading manufacturers, and the increasing consumption of green tea are some of the factors driving growth in the USA tea processing equipment market.

According to the Tea Association of the USA, Americans drank 3.8 billion gallons of tea or about 84 billion servings in 2019. About 84% of the tea consumed was black tea, 15% was green tea, and the remaining 1% was oolong, white, and dark tea.

The green tea industry in particular has seen fast growth among millennials and will further fuel demand for tea processing equipment across the USA during the forecast period.

Why is India Emerging as a Lucrative Tea Processing Equipment Market?

Rising Production and Consumption of Tea Driving Market in India

With rising production, consumption, and export of tea, India is emerging as a lucrative market for tea processing equipment. FMI has predicted a robust CAGR for the Indian tea processing equipment market for the projected period of 2023 and 2033.

The Indian tea market revenue in the tea segment amounted to USD 15.99 Billion in 2022. The market is consolidated with the presence of several major brands. People in the country consume large amounts of tea on a regular basis. This will continue to boost the tea processing equipment market during the forecast period.

Similarly, the rise in the export of tea is generating huge demand for tea processing equipment in the country and the trend is likely to continue during the forecast period.

India is the second-largest producer of tea globally and is top 5 in terms of global exports. As per the India Brand Equity Foundation (IBEF), the total value of tea exports from India reached around 687.9 million in 2021. Black tea is the most exported tea type which makes up around 96% of the total exports.

How Will Growth Unfold in the China Tea Processing Equipment Market?

Booming Tea Export Business Fuelling Sales in China

As per FMI, the tea processing equipment market size reached over USD 901.1 Million in 2023 and it is expected to register robust growth during the next ten years.

Rising production and export of tea, easy availability of tea processing machines at lower prices, and favorable government support are some of the key factors driving growth in the China tea processing equipment market.

China produces 44% of global tea production and is the largest exporter of tea in the world. With the consistently rising income levels of Chinese consumers, it is safe to assume that China would continue to be the largest market for tea processing equipment.

Tea Processing Equipment Industry Analysis by Type, Capacity, and Application

Which End-Use Industry Contributes Most to the Global Tea Equipment Market?

Most of the Tea Processing Equipment Sales Remain Concentrated in Black Tea Industry

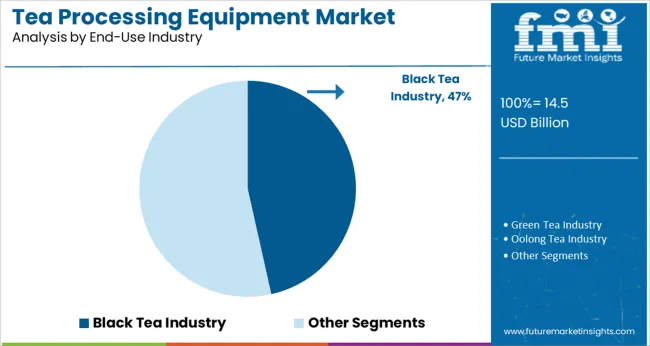
Based on the end-use industry, the black tea industry segment currently dominates the global tea processing equipment market. This can be attributed to the rising demand for black tea across the world.

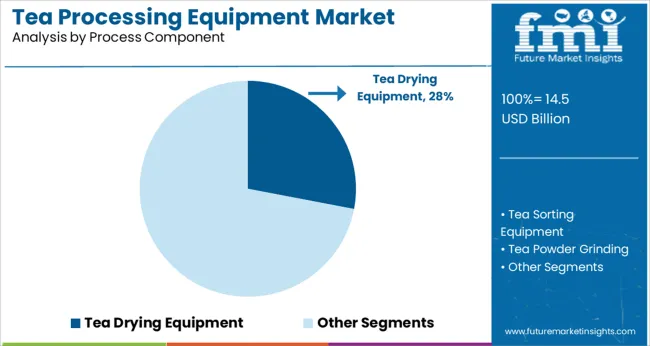
Black tea is a tea that has gone through the entire fermentation process. Withering, rolling, fermentation and drying are all steps in the production of black tea. For drying tea leaves, commercial tea drying equipment in the form of perforated conveyors is used to move the tea leaves through a heat source in an endless chain.

The most important phase in the production of black tea is fermentation. The tea's quality is determined by this factor. Meanwhile, throughout the fermentation process, several beneficial chemicals are formed, which contribute to black tea's health benefits. Fermentation is also one of the reasons why black tea is so popular among health-conscious individuals.

However, the green tea industry segment is likely to grow at the fastest pace during the next ten years, this can be attributed to the rising consumption of green tea on account of its various health benefits.

What Makes CTC Tea Processing Machines So Popular?

Faster Production of a Standard Quality of Tea Making CTC Tea Processing Machines Popular

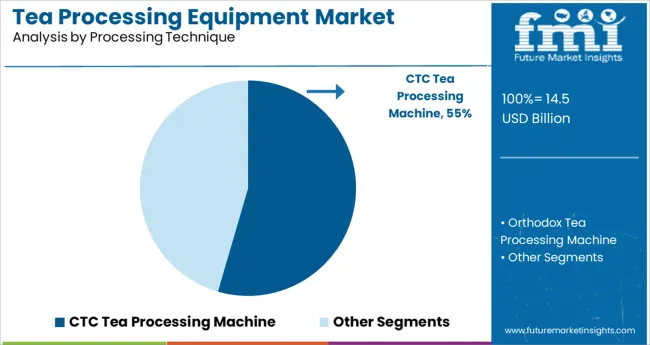
As per FMI, the CTC tea processing machine segment is expected to outpace the orthodox tea processing machine segment during the forecast period. This can be attributed to the rising adoption of CTC tea processing equipment across various end-use industries.

CTC is made by mashing entire, fresh leaves (crushing, tearing, and curling them). The leaf is crushed up and oxidized before being rolled into small pellets. While some tea leaves may appear to be rather little at the end of the process, they are never cut or torn apart in Orthodox processing. They're rolled with care to achieve a specific flavor.
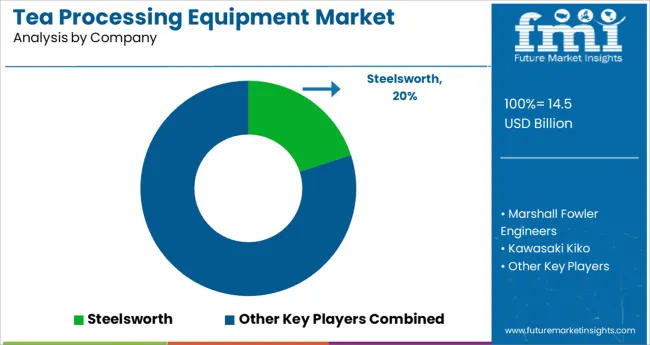
Competitive Landscape of the Global Tea Processing Equipment Market

The quickly changing technical environment is forcing leading tea processing equipment manufacturers to continuously upgrade their product portfolios. As a result, they are investing in research and development activities to develop advanced tea processing equipment. Besides this, they are adopting strategies like partnerships, mergers, acquisitions, and collaborations to expand their global footprint. For instance,

  • Steelsworth, a leading tea processing equipment manufacturer recently expanded its product portfolio by launching new products such as a tea plucking machine, an upgraded version of their main product team master CTC gold, an axial flow fan, and a supervene.
  • Works on Industries launched K1 Series CTC machines with different production capacities ranging from small tea processing machines (capacity ~ 1.5 lakh kg per year) to jumbo tea processing machines ( capacity ~ 9 lakh kg per year)

Scope of the Tea Processing Equipment Market Report

Attribute Details
Estimated Market Size (2023) USD 12.8 Billion
Projected Market Size (2033) USD 25.4 Billion
Anticipated Growth Rate (2023 to 2033) 6.4% CAGR
Forecast Period 2023 to 2033
Historical Data Available for 2017 to 2022
Market Analysis USD Million for Value and Units for Volume
Key Regions Covered North America; Latin America; Europe; Asia Pacific; Oceania; Middle East and Africa (MEA)
Key Countries Covered USA, Canada, Mexico, Germany, UK, France, Italy, Spain, China, Japan, India, South Korea, Australia, Brazil, Argentina, South Africa, UAE, Kenya, Sri Lanka
Key Segments Covered Processing Technique, Process Components, End-Use Industry, Automation Grade, Region
Key Companies Profiled Steelsworth; Marshall Fowler Engineers; Kawasaki Kiko; Bharat Engineering Works; G.K Tea Industries; Mesco Equipment Pvt. Ltd.; Quanzhou Deli Agroforestrial Machinery Co., Ltd.; T & I Global Ltd.; Anxi Yongxing Tea Machinery Co.; Workson Industries; Ysm Dairy & Biotech Private Limited; Nova Hightech Pvt. Ltd.; GEM Machinery & Allied Services; The Scientific Apparatus & Company; Noble Procetech Engineers
Report Coverage Market Forecast, Company Share Analysis, Competitive Landscape, Drivers, Restraints, Opportunities and Threats Analysis, Market Dynamics and Challenges, and Strategic Growth Initiatives

Top Investment Segments in the Tea Processing Equipment Market

By Processing Technique:

  • CTC Tea Processing Machine
  • Orthodox Tea Processing Machine

By Process Components:

  • Tea Sorting equipment
  • Tea Powder grinding
  • Tea Rolling Machine
  • Fermenting Machine
  • Tea Drying equipment

By End-use Industry:

  • Black Tea Industry
  • Green Tea Industry
  • Oolong Tea Industry
  • Others (Bubble tea, Yellow Tea, Decaffeinated tea, etc.)

By Automation Grade:

  • Automatic
  • Semi-Automatic
  • Manual

By Region:

  • North America
  • Latin America
  • Europe
  • East Asia
  • South Asia
  • Oceania
  • Middle East and Africa (MEA)

Table of Content

  • 1. Executive Summary | Tea Processing Equipment Market
  • 2. Market Overview
  • 3. Market Background
  • 4. Global Market Analysis 2017 to 2022 and Forecast, 2023 to 2033
  • 5. Global Market Analysis 2017 to 2022 and Forecast 2023 to 2033, By Processing Technique
    • 5.1. CTC Tea Processing Machine
    • 5.2. Orthodox Tea Processing Machine
  • 6. Global Market Analysis 2017 to 2022 and Forecast 2023 to 2033, By Process Components
    • 6.1. Tea Sorting Equipment
    • 6.2. Tea Powder Grinding
    • 6.3. Tea Rolling Machine
    • 6.4. Fermenting Machine
    • 6.5. Tea Drying Equipment
  • 7. Global Market Analysis 2017 to 2022 and Forecast 2023 to 2033, By End-Use Industry
    • 7.1. Green Tea Industry
    • 7.2. Oolong Tea Industry
    • 7.3. Black Tea Industry
    • 7.4. Others
  • 8. Global Market Analysis 2017 to 2022 and Forecast 2023 to 2033, By Automation Grade
    • 8.1. Automatic
    • 8.2. Semi-Automatic
    • 8.3. Manual
  • 9. Global Market Analysis 2017 to 2022 and Forecast 2023 to 2033, By Region
    • 9.1. North America
    • 9.2. Latin America
    • 9.3. Europe
    • 9.4. East Asia
    • 9.5. South Asia
    • 9.6. Oceania
    • 9.7. Middle East and Africa (MEA)
  • 10. North America Market Analysis 2017 to 2022 and Forecast 2023 to 2033, By Country
  • 11. Latin America Market Analysis 2017 to 2022 and Forecast 2023 to 2033, By Country
  • 12. Europe Market Analysis 2017 to 2022 and Forecast 2023 to 2033, By Country
  • 13. East Asia Market Analysis 2017 to 2022 and Forecast 2023 to 2033, By Country
  • 14. South Asia Market Analysis 2017 to 2022 and Forecast 2023 to 2033, By Country
  • 15. Oceania Market Analysis 2017 to 2022 and Forecast 2023 to 2033, By Country
  • 16. MEA Market Analysis 2017 to 2022 and Forecast 2023 to 2033, By Country
  • 17. Key Countries Market Analysis
  • 18. Market Structure Analysis
  • 19. Competition Analysis
    • 19.1. Steelsworth
    • 19.2. Marshall Fowler Engineers
    • 19.3. Kawasaki Kiko
    • 19.4. Bharat Engineering Works
    • 19.5. G.K Tea Industries
    • 19.6. Mesco Equipment Pvt. Ltd.
    • 19.7. Quanzhou Deli Agroforestrial Machinery Co., Ltd.
    • 19.8. T & I Global Ltd.
    • 19.9. Anxi Yongxing Tea Machinery Co.
    • 19.10. Workson Industries
    • 19.11. Others (on additional request)
  • 20. Assumptions & Acronyms Used
  • 21. Research Methodology

List of Tables

Table 1: Global Market Value (US$ Million) Forecast by Region, 2017 to 2033

Table 2: Global Market Volume (MT) Forecast by Region, 2017 to 2033

Table 3: Global Market Value (US$ Million) Forecast by Processing Technique, 2017 to 2033

Table 4: Global Market Volume (MT) Forecast by Processing Technique, 2017 to 2033

Table 5: Global Market Value (US$ Million) Forecast by Process Components, 2017 to 2033

Table 6: Global Market Volume (MT) Forecast by Process Components, 2017 to 2033

Table 7: Global Market Value (US$ Million) Forecast by End-Use Industry, 2017 to 2033

Table 8: Global Market Volume (MT) Forecast by End-Use Industry, 2017 to 2033

Table 9: Global Market Value (US$ Million) Forecast by Automation Grade, 2017 to 2033

Table 10: Global Market Volume (MT) Forecast by Automation Grade, 2017 to 2033

Table 11: North America Market Value (US$ Million) Forecast by Country, 2017 to 2033

Table 12: North America Market Volume (MT) Forecast by Country, 2017 to 2033

Table 13: North America Market Value (US$ Million) Forecast by Processing Technique, 2017 to 2033

Table 14: North America Market Volume (MT) Forecast by Processing Technique, 2017 to 2033

Table 15: North America Market Value (US$ Million) Forecast by Process Components, 2017 to 2033

Table 16: North America Market Volume (MT) Forecast by Process Components, 2017 to 2033

Table 17: North America Market Value (US$ Million) Forecast by End-Use Industry, 2017 to 2033

Table 18: North America Market Volume (MT) Forecast by End-Use Industry, 2017 to 2033

Table 19: North America Market Value (US$ Million) Forecast by Automation Grade, 2017 to 2033

Table 20: North America Market Volume (MT) Forecast by Automation Grade, 2017 to 2033

Table 21: Latin America Market Value (US$ Million) Forecast by Country, 2017 to 2033

Table 22: Latin America Market Volume (MT) Forecast by Country, 2017 to 2033

Table 23: Latin America Market Value (US$ Million) Forecast by Processing Technique, 2017 to 2033

Table 24: Latin America Market Volume (MT) Forecast by Processing Technique, 2017 to 2033

Table 25: Latin America Market Value (US$ Million) Forecast by Process Components, 2017 to 2033

Table 26: Latin America Market Volume (MT) Forecast by Process Components, 2017 to 2033

Table 27: Latin America Market Value (US$ Million) Forecast by End-Use Industry, 2017 to 2033

Table 28: Latin America Market Volume (MT) Forecast by End-Use Industry, 2017 to 2033

Table 29: Latin America Market Value (US$ Million) Forecast by Automation Grade, 2017 to 2033

Table 30: Latin America Market Volume (MT) Forecast by Automation Grade, 2017 to 2033

Table 31: Europe Market Value (US$ Million) Forecast by Country, 2017 to 2033

Table 32: Europe Market Volume (MT) Forecast by Country, 2017 to 2033

Table 33: Europe Market Value (US$ Million) Forecast by Processing Technique, 2017 to 2033

Table 34: Europe Market Volume (MT) Forecast by Processing Technique, 2017 to 2033

Table 35: Europe Market Value (US$ Million) Forecast by Process Components, 2017 to 2033

Table 36: Europe Market Volume (MT) Forecast by Process Components, 2017 to 2033

Table 37: Europe Market Value (US$ Million) Forecast by End-Use Industry, 2017 to 2033

Table 38: Europe Market Volume (MT) Forecast by End-Use Industry, 2017 to 2033

Table 39: Europe Market Value (US$ Million) Forecast by Automation Grade, 2017 to 2033

Table 40: Europe Market Volume (MT) Forecast by Automation Grade, 2017 to 2033

Table 41: East Asia Market Value (US$ Million) Forecast by Country, 2017 to 2033

Table 42: East Asia Market Volume (MT) Forecast by Country, 2017 to 2033

Table 43: East Asia Market Value (US$ Million) Forecast by Processing Technique, 2017 to 2033

Table 44: East Asia Market Volume (MT) Forecast by Processing Technique, 2017 to 2033

Table 45: East Asia Market Value (US$ Million) Forecast by Process Components, 2017 to 2033

Table 46: East Asia Market Volume (MT) Forecast by Process Components, 2017 to 2033

Table 47: East Asia Market Value (US$ Million) Forecast by End-Use Industry, 2017 to 2033

Table 48: East Asia Market Volume (MT) Forecast by End-Use Industry, 2017 to 2033

Table 49: East Asia Market Value (US$ Million) Forecast by Automation Grade, 2017 to 2033

Table 50: East Asia Market Volume (MT) Forecast by Automation Grade, 2017 to 2033

Table 51: South Asia Market Value (US$ Million) Forecast by Country, 2017 to 2033

Table 52: South Asia Market Volume (MT) Forecast by Country, 2017 to 2033

Table 53: South Asia Market Value (US$ Million) Forecast by Processing Technique, 2017 to 2033

Table 54: South Asia Market Volume (MT) Forecast by Processing Technique, 2017 to 2033

Table 55: South Asia Market Value (US$ Million) Forecast by Process Components, 2017 to 2033

Table 56: South Asia Market Volume (MT) Forecast by Process Components, 2017 to 2033

Table 57: South Asia Market Value (US$ Million) Forecast by End-Use Industry, 2017 to 2033

Table 58: South Asia Market Volume (MT) Forecast by End-Use Industry, 2017 to 2033

Table 59: South Asia Market Value (US$ Million) Forecast by Automation Grade, 2017 to 2033

Table 60: South Asia Market Volume (MT) Forecast by Automation Grade, 2017 to 2033

Table 61: Oceania Market Value (US$ Million) Forecast by Country, 2017 to 2033

Table 62: Oceania Market Volume (MT) Forecast by Country, 2017 to 2033

Table 63: Oceania Market Value (US$ Million) Forecast by Processing Technique, 2017 to 2033

Table 64: Oceania Market Volume (MT) Forecast by Processing Technique, 2017 to 2033

Table 65: Oceania Market Value (US$ Million) Forecast by Process Components, 2017 to 2033

Table 66: Oceania Market Volume (MT) Forecast by Process Components, 2017 to 2033

Table 67: Oceania Market Value (US$ Million) Forecast by End-Use Industry, 2017 to 2033

Table 68: Oceania Market Volume (MT) Forecast by End-Use Industry, 2017 to 2033

Table 69: Oceania Market Value (US$ Million) Forecast by Automation Grade, 2017 to 2033

Table 70: Oceania Market Volume (MT) Forecast by Automation Grade, 2017 to 2033

Table 71: MEA Market Value (US$ Million) Forecast by Country, 2017 to 2033

Table 72: MEA Market Volume (MT) Forecast by Country, 2017 to 2033

Table 73: MEA Market Value (US$ Million) Forecast by Processing Technique, 2017 to 2033

Table 74: MEA Market Volume (MT) Forecast by Processing Technique, 2017 to 2033

Table 75: MEA Market Value (US$ Million) Forecast by Process Components, 2017 to 2033

Table 76: MEA Market Volume (MT) Forecast by Process Components, 2017 to 2033

Table 77: MEA Market Value (US$ Million) Forecast by End-Use Industry, 2017 to 2033

Table 78: MEA Market Volume (MT) Forecast by End-Use Industry, 2017 to 2033

Table 79: MEA Market Value (US$ Million) Forecast by Automation Grade, 2017 to 2033

Table 80: MEA Market Volume (MT) Forecast by Automation Grade, 2017 to 2033

List of Figures

Figure 1: Global Market Value (US$ Million) by Processing Technique, 2023 to 2033

Figure 2: Global Market Value (US$ Million) by Process Components, 2023 to 2033

Figure 3: Global Market Value (US$ Million) by End-Use Industry, 2023 to 2033

Figure 4: Global Market Value (US$ Million) by Automation Grade, 2023 to 2033

Figure 5: Global Market Value (US$ Million) by Region, 2023 to 2033

Figure 6: Global Market Value (US$ Million) Analysis by Region, 2017 to 2033

Figure 7: Global Market Volume (MT) Analysis by Region, 2017 to 2033

Figure 8: Global Market Value Share (%) and BPS Analysis by Region, 2023 to 2033

Figure 9: Global Market Y-o-Y Growth (%) Projections by Region, 2023 to 2033

Figure 10: Global Market Value (US$ Million) Analysis by Processing Technique, 2017 to 2033

Figure 11: Global Market Volume (MT) Analysis by Processing Technique, 2017 to 2033

Figure 12: Global Market Value Share (%) and BPS Analysis by Processing Technique, 2023 to 2033

Figure 13: Global Market Y-o-Y Growth (%) Projections by Processing Technique, 2023 to 2033

Figure 14: Global Market Value (US$ Million) Analysis by Process Components, 2017 to 2033

Figure 15: Global Market Volume (MT) Analysis by Process Components, 2017 to 2033

Figure 16: Global Market Value Share (%) and BPS Analysis by Process Components, 2023 to 2033

Figure 17: Global Market Y-o-Y Growth (%) Projections by Process Components, 2023 to 2033

Figure 18: Global Market Value (US$ Million) Analysis by End-Use Industry, 2017 to 2033

Figure 19: Global Market Volume (MT) Analysis by End-Use Industry, 2017 to 2033

Figure 20: Global Market Value Share (%) and BPS Analysis by End-Use Industry, 2023 to 2033

Figure 21: Global Market Y-o-Y Growth (%) Projections by End-Use Industry, 2023 to 2033

Figure 22: Global Market Value (US$ Million) Analysis by Automation Grade, 2017 to 2033

Figure 23: Global Market Volume (MT) Analysis by Automation Grade, 2017 to 2033

Figure 24: Global Market Value Share (%) and BPS Analysis by Automation Grade, 2023 to 2033

Figure 25: Global Market Y-o-Y Growth (%) Projections by Automation Grade, 2023 to 2033

Figure 26: Global Market Attractiveness by Processing Technique, 2023 to 2033

Figure 27: Global Market Attractiveness by Process Components, 2023 to 2033

Figure 28: Global Market Attractiveness by End-Use Industry, 2023 to 2033

Figure 29: Global Market Attractiveness by Automation Grade, 2023 to 2033

Figure 30: Global Market Attractiveness by Region, 2023 to 2033

Figure 31: North America Market Value (US$ Million) by Processing Technique, 2023 to 2033

Figure 32: North America Market Value (US$ Million) by Process Components, 2023 to 2033

Figure 33: North America Market Value (US$ Million) by End-Use Industry, 2023 to 2033

Figure 34: North America Market Value (US$ Million) by Automation Grade, 2023 to 2033

Figure 35: North America Market Value (US$ Million) by Country, 2023 to 2033

Figure 36: North America Market Value (US$ Million) Analysis by Country, 2017 to 2033

Figure 37: North America Market Volume (MT) Analysis by Country, 2017 to 2033

Figure 38: North America Market Value Share (%) and BPS Analysis by Country, 2023 to 2033

Figure 39: North America Market Y-o-Y Growth (%) Projections by Country, 2023 to 2033

Figure 40: North America Market Value (US$ Million) Analysis by Processing Technique, 2017 to 2033

Figure 41: North America Market Volume (MT) Analysis by Processing Technique, 2017 to 2033

Figure 42: North America Market Value Share (%) and BPS Analysis by Processing Technique, 2023 to 2033

Figure 43: North America Market Y-o-Y Growth (%) Projections by Processing Technique, 2023 to 2033

Figure 44: North America Market Value (US$ Million) Analysis by Process Components, 2017 to 2033

Figure 45: North America Market Volume (MT) Analysis by Process Components, 2017 to 2033

Figure 46: North America Market Value Share (%) and BPS Analysis by Process Components, 2023 to 2033

Figure 47: North America Market Y-o-Y Growth (%) Projections by Process Components, 2023 to 2033

Figure 48: North America Market Value (US$ Million) Analysis by End-Use Industry, 2017 to 2033

Figure 49: North America Market Volume (MT) Analysis by End-Use Industry, 2017 to 2033

Figure 50: North America Market Value Share (%) and BPS Analysis by End-Use Industry, 2023 to 2033

Figure 51: North America Market Y-o-Y Growth (%) Projections by End-Use Industry, 2023 to 2033

Figure 52: North America Market Value (US$ Million) Analysis by Automation Grade, 2017 to 2033

Figure 53: North America Market Volume (MT) Analysis by Automation Grade, 2017 to 2033

Figure 54: North America Market Value Share (%) and BPS Analysis by Automation Grade, 2023 to 2033

Figure 55: North America Market Y-o-Y Growth (%) Projections by Automation Grade, 2023 to 2033

Figure 56: North America Market Attractiveness by Processing Technique, 2023 to 2033

Figure 57: North America Market Attractiveness by Process Components, 2023 to 2033

Figure 58: North America Market Attractiveness by End-Use Industry, 2023 to 2033

Figure 59: North America Market Attractiveness by Automation Grade, 2023 to 2033

Figure 60: North America Market Attractiveness by Country, 2023 to 2033

Figure 61: Latin America Market Value (US$ Million) by Processing Technique, 2023 to 2033

Figure 62: Latin America Market Value (US$ Million) by Process Components, 2023 to 2033

Figure 63: Latin America Market Value (US$ Million) by End-Use Industry, 2023 to 2033

Figure 64: Latin America Market Value (US$ Million) by Automation Grade, 2023 to 2033

Figure 65: Latin America Market Value (US$ Million) by Country, 2023 to 2033

Figure 66: Latin America Market Value (US$ Million) Analysis by Country, 2017 to 2033

Figure 67: Latin America Market Volume (MT) Analysis by Country, 2017 to 2033

Figure 68: Latin America Market Value Share (%) and BPS Analysis by Country, 2023 to 2033

Figure 69: Latin America Market Y-o-Y Growth (%) Projections by Country, 2023 to 2033

Figure 70: Latin America Market Value (US$ Million) Analysis by Processing Technique, 2017 to 2033

Figure 71: Latin America Market Volume (MT) Analysis by Processing Technique, 2017 to 2033

Figure 72: Latin America Market Value Share (%) and BPS Analysis by Processing Technique, 2023 to 2033

Figure 73: Latin America Market Y-o-Y Growth (%) Projections by Processing Technique, 2023 to 2033

Figure 74: Latin America Market Value (US$ Million) Analysis by Process Components, 2017 to 2033

Figure 75: Latin America Market Volume (MT) Analysis by Process Components, 2017 to 2033

Figure 76: Latin America Market Value Share (%) and BPS Analysis by Process Components, 2023 to 2033

Figure 77: Latin America Market Y-o-Y Growth (%) Projections by Process Components, 2023 to 2033

Figure 78: Latin America Market Value (US$ Million) Analysis by End-Use Industry, 2017 to 2033

Figure 79: Latin America Market Volume (MT) Analysis by End-Use Industry, 2017 to 2033

Figure 80: Latin America Market Value Share (%) and BPS Analysis by End-Use Industry, 2023 to 2033

Figure 81: Latin America Market Y-o-Y Growth (%) Projections by End-Use Industry, 2023 to 2033

Figure 82: Latin America Market Value (US$ Million) Analysis by Automation Grade, 2017 to 2033

Figure 83: Latin America Market Volume (MT) Analysis by Automation Grade, 2017 to 2033

Figure 84: Latin America Market Value Share (%) and BPS Analysis by Automation Grade, 2023 to 2033

Figure 85: Latin America Market Y-o-Y Growth (%) Projections by Automation Grade, 2023 to 2033

Figure 86: Latin America Market Attractiveness by Processing Technique, 2023 to 2033

Figure 87: Latin America Market Attractiveness by Process Components, 2023 to 2033

Figure 88: Latin America Market Attractiveness by End-Use Industry, 2023 to 2033

Figure 89: Latin America Market Attractiveness by Automation Grade, 2023 to 2033

Figure 90: Latin America Market Attractiveness by Country, 2023 to 2033

Figure 91: Europe Market Value (US$ Million) by Processing Technique, 2023 to 2033

Figure 92: Europe Market Value (US$ Million) by Process Components, 2023 to 2033

Figure 93: Europe Market Value (US$ Million) by End-Use Industry, 2023 to 2033

Figure 94: Europe Market Value (US$ Million) by Automation Grade, 2023 to 2033

Figure 95: Europe Market Value (US$ Million) by Country, 2023 to 2033

Figure 96: Europe Market Value (US$ Million) Analysis by Country, 2017 to 2033

Figure 97: Europe Market Volume (MT) Analysis by Country, 2017 to 2033

Figure 98: Europe Market Value Share (%) and BPS Analysis by Country, 2023 to 2033

Figure 99: Europe Market Y-o-Y Growth (%) Projections by Country, 2023 to 2033

Figure 100: Europe Market Value (US$ Million) Analysis by Processing Technique, 2017 to 2033

Figure 101: Europe Market Volume (MT) Analysis by Processing Technique, 2017 to 2033

Figure 102: Europe Market Value Share (%) and BPS Analysis by Processing Technique, 2023 to 2033

Figure 103: Europe Market Y-o-Y Growth (%) Projections by Processing Technique, 2023 to 2033

Figure 104: Europe Market Value (US$ Million) Analysis by Process Components, 2017 to 2033

Figure 105: Europe Market Volume (MT) Analysis by Process Components, 2017 to 2033

Figure 106: Europe Market Value Share (%) and BPS Analysis by Process Components, 2023 to 2033

Figure 107: Europe Market Y-o-Y Growth (%) Projections by Process Components, 2023 to 2033

Figure 108: Europe Market Value (US$ Million) Analysis by End-Use Industry, 2017 to 2033

Figure 109: Europe Market Volume (MT) Analysis by End-Use Industry, 2017 to 2033

Figure 110: Europe Market Value Share (%) and BPS Analysis by End-Use Industry, 2023 to 2033

Figure 111: Europe Market Y-o-Y Growth (%) Projections by End-Use Industry, 2023 to 2033

Figure 112: Europe Market Value (US$ Million) Analysis by Automation Grade, 2017 to 2033

Figure 113: Europe Market Volume (MT) Analysis by Automation Grade, 2017 to 2033

Figure 114: Europe Market Value Share (%) and BPS Analysis by Automation Grade, 2023 to 2033

Figure 115: Europe Market Y-o-Y Growth (%) Projections by Automation Grade, 2023 to 2033

Figure 116: Europe Market Attractiveness by Processing Technique, 2023 to 2033

Figure 117: Europe Market Attractiveness by Process Components, 2023 to 2033

Figure 118: Europe Market Attractiveness by End-Use Industry, 2023 to 2033

Figure 119: Europe Market Attractiveness by Automation Grade, 2023 to 2033

Figure 120: Europe Market Attractiveness by Country, 2023 to 2033

Figure 121: East Asia Market Value (US$ Million) by Processing Technique, 2023 to 2033

Figure 122: East Asia Market Value (US$ Million) by Process Components, 2023 to 2033

Figure 123: East Asia Market Value (US$ Million) by End-Use Industry, 2023 to 2033

Figure 124: East Asia Market Value (US$ Million) by Automation Grade, 2023 to 2033

Figure 125: East Asia Market Value (US$ Million) by Country, 2023 to 2033

Figure 126: East Asia Market Value (US$ Million) Analysis by Country, 2017 to 2033

Figure 127: East Asia Market Volume (MT) Analysis by Country, 2017 to 2033

Figure 128: East Asia Market Value Share (%) and BPS Analysis by Country, 2023 to 2033

Figure 129: East Asia Market Y-o-Y Growth (%) Projections by Country, 2023 to 2033

Figure 130: East Asia Market Value (US$ Million) Analysis by Processing Technique, 2017 to 2033

Figure 131: East Asia Market Volume (MT) Analysis by Processing Technique, 2017 to 2033

Figure 132: East Asia Market Value Share (%) and BPS Analysis by Processing Technique, 2023 to 2033

Figure 133: East Asia Market Y-o-Y Growth (%) Projections by Processing Technique, 2023 to 2033

Figure 134: East Asia Market Value (US$ Million) Analysis by Process Components, 2017 to 2033

Figure 135: East Asia Market Volume (MT) Analysis by Process Components, 2017 to 2033

Figure 136: East Asia Market Value Share (%) and BPS Analysis by Process Components, 2023 to 2033

Figure 137: East Asia Market Y-o-Y Growth (%) Projections by Process Components, 2023 to 2033

Figure 138: East Asia Market Value (US$ Million) Analysis by End-Use Industry, 2017 to 2033

Figure 139: East Asia Market Volume (MT) Analysis by End-Use Industry, 2017 to 2033

Figure 140: East Asia Market Value Share (%) and BPS Analysis by End-Use Industry, 2023 to 2033

Figure 141: East Asia Market Y-o-Y Growth (%) Projections by End-Use Industry, 2023 to 2033

Figure 142: East Asia Market Value (US$ Million) Analysis by Automation Grade, 2017 to 2033

Figure 143: East Asia Market Volume (MT) Analysis by Automation Grade, 2017 to 2033

Figure 144: East Asia Market Value Share (%) and BPS Analysis by Automation Grade, 2023 to 2033

Figure 145: East Asia Market Y-o-Y Growth (%) Projections by Automation Grade, 2023 to 2033

Figure 146: East Asia Market Attractiveness by Processing Technique, 2023 to 2033

Figure 147: East Asia Market Attractiveness by Process Components, 2023 to 2033

Figure 148: East Asia Market Attractiveness by End-Use Industry, 2023 to 2033

Figure 149: East Asia Market Attractiveness by Automation Grade, 2023 to 2033

Figure 150: East Asia Market Attractiveness by Country, 2023 to 2033

Figure 151: South Asia Market Value (US$ Million) by Processing Technique, 2023 to 2033

Figure 152: South Asia Market Value (US$ Million) by Process Components, 2023 to 2033

Figure 153: South Asia Market Value (US$ Million) by End-Use Industry, 2023 to 2033

Figure 154: South Asia Market Value (US$ Million) by Automation Grade, 2023 to 2033

Figure 155: South Asia Market Value (US$ Million) by Country, 2023 to 2033

Figure 156: South Asia Market Value (US$ Million) Analysis by Country, 2017 to 2033

Figure 157: South Asia Market Volume (MT) Analysis by Country, 2017 to 2033

Figure 158: South Asia Market Value Share (%) and BPS Analysis by Country, 2023 to 2033

Figure 159: South Asia Market Y-o-Y Growth (%) Projections by Country, 2023 to 2033

Figure 160: South Asia Market Value (US$ Million) Analysis by Processing Technique, 2017 to 2033

Figure 161: South Asia Market Volume (MT) Analysis by Processing Technique, 2017 to 2033

Figure 162: South Asia Market Value Share (%) and BPS Analysis by Processing Technique, 2023 to 2033

Figure 163: South Asia Market Y-o-Y Growth (%) Projections by Processing Technique, 2023 to 2033

Figure 164: South Asia Market Value (US$ Million) Analysis by Process Components, 2017 to 2033

Figure 165: South Asia Market Volume (MT) Analysis by Process Components, 2017 to 2033

Figure 166: South Asia Market Value Share (%) and BPS Analysis by Process Components, 2023 to 2033

Figure 167: South Asia Market Y-o-Y Growth (%) Projections by Process Components, 2023 to 2033

Figure 168: South Asia Market Value (US$ Million) Analysis by End-Use Industry, 2017 to 2033

Figure 169: South Asia Market Volume (MT) Analysis by End-Use Industry, 2017 to 2033

Figure 170: South Asia Market Value Share (%) and BPS Analysis by End-Use Industry, 2023 to 2033

Figure 171: South Asia Market Y-o-Y Growth (%) Projections by End-Use Industry, 2023 to 2033

Figure 172: South Asia Market Value (US$ Million) Analysis by Automation Grade, 2017 to 2033

Figure 173: South Asia Market Volume (MT) Analysis by Automation Grade, 2017 to 2033

Figure 174: South Asia Market Value Share (%) and BPS Analysis by Automation Grade, 2023 to 2033

Figure 175: South Asia Market Y-o-Y Growth (%) Projections by Automation Grade, 2023 to 2033

Figure 176: South Asia Market Attractiveness by Processing Technique, 2023 to 2033

Figure 177: South Asia Market Attractiveness by Process Components, 2023 to 2033

Figure 178: South Asia Market Attractiveness by End-Use Industry, 2023 to 2033

Figure 179: South Asia Market Attractiveness by Automation Grade, 2023 to 2033

Figure 180: South Asia Market Attractiveness by Country, 2023 to 2033

Figure 181: Oceania Market Value (US$ Million) by Processing Technique, 2023 to 2033

Figure 182: Oceania Market Value (US$ Million) by Process Components, 2023 to 2033

Figure 183: Oceania Market Value (US$ Million) by End-Use Industry, 2023 to 2033

Figure 184: Oceania Market Value (US$ Million) by Automation Grade, 2023 to 2033

Figure 185: Oceania Market Value (US$ Million) by Country, 2023 to 2033

Figure 186: Oceania Market Value (US$ Million) Analysis by Country, 2017 to 2033

Figure 187: Oceania Market Volume (MT) Analysis by Country, 2017 to 2033

Figure 188: Oceania Market Value Share (%) and BPS Analysis by Country, 2023 to 2033

Figure 189: Oceania Market Y-o-Y Growth (%) Projections by Country, 2023 to 2033

Figure 190: Oceania Market Value (US$ Million) Analysis by Processing Technique, 2017 to 2033

Figure 191: Oceania Market Volume (MT) Analysis by Processing Technique, 2017 to 2033

Figure 192: Oceania Market Value Share (%) and BPS Analysis by Processing Technique, 2023 to 2033

Figure 193: Oceania Market Y-o-Y Growth (%) Projections by Processing Technique, 2023 to 2033

Figure 194: Oceania Market Value (US$ Million) Analysis by Process Components, 2017 to 2033

Figure 195: Oceania Market Volume (MT) Analysis by Process Components, 2017 to 2033

Figure 196: Oceania Market Value Share (%) and BPS Analysis by Process Components, 2023 to 2033

Figure 197: Oceania Market Y-o-Y Growth (%) Projections by Process Components, 2023 to 2033

Figure 198: Oceania Market Value (US$ Million) Analysis by End-Use Industry, 2017 to 2033

Figure 199: Oceania Market Volume (MT) Analysis by End-Use Industry, 2017 to 2033

Figure 200: Oceania Market Value Share (%) and BPS Analysis by End-Use Industry, 2023 to 2033

Figure 201: Oceania Market Y-o-Y Growth (%) Projections by End-Use Industry, 2023 to 2033

Figure 202: Oceania Market Value (US$ Million) Analysis by Automation Grade, 2017 to 2033

Figure 203: Oceania Market Volume (MT) Analysis by Automation Grade, 2017 to 2033

Figure 204: Oceania Market Value Share (%) and BPS Analysis by Automation Grade, 2023 to 2033

Figure 205: Oceania Market Y-o-Y Growth (%) Projections by Automation Grade, 2023 to 2033

Figure 206: Oceania Market Attractiveness by Processing Technique, 2023 to 2033

Figure 207: Oceania Market Attractiveness by Process Components, 2023 to 2033

Figure 208: Oceania Market Attractiveness by End-Use Industry, 2023 to 2033

Figure 209: Oceania Market Attractiveness by Automation Grade, 2023 to 2033

Figure 210: Oceania Market Attractiveness by Country, 2023 to 2033

Figure 211: MEA Market Value (US$ Million) by Processing Technique, 2023 to 2033

Figure 212: MEA Market Value (US$ Million) by Process Components, 2023 to 2033

Figure 213: MEA Market Value (US$ Million) by End-Use Industry, 2023 to 2033

Figure 214: MEA Market Value (US$ Million) by Automation Grade, 2023 to 2033

Figure 215: MEA Market Value (US$ Million) by Country, 2023 to 2033

Figure 216: MEA Market Value (US$ Million) Analysis by Country, 2017 to 2033

Figure 217: MEA Market Volume (MT) Analysis by Country, 2017 to 2033

Figure 218: MEA Market Value Share (%) and BPS Analysis by Country, 2023 to 2033

Figure 219: MEA Market Y-o-Y Growth (%) Projections by Country, 2023 to 2033

Figure 220: MEA Market Value (US$ Million) Analysis by Processing Technique, 2017 to 2033

Figure 221: MEA Market Volume (MT) Analysis by Processing Technique, 2017 to 2033

Figure 222: MEA Market Value Share (%) and BPS Analysis by Processing Technique, 2023 to 2033

Figure 223: MEA Market Y-o-Y Growth (%) Projections by Processing Technique, 2023 to 2033

Figure 224: MEA Market Value (US$ Million) Analysis by Process Components, 2017 to 2033

Figure 225: MEA Market Volume (MT) Analysis by Process Components, 2017 to 2033

Figure 226: MEA Market Value Share (%) and BPS Analysis by Process Components, 2023 to 2033

Figure 227: MEA Market Y-o-Y Growth (%) Projections by Process Components, 2023 to 2033

Figure 228: MEA Market Value (US$ Million) Analysis by End-Use Industry, 2017 to 2033

Figure 229: MEA Market Volume (MT) Analysis by End-Use Industry, 2017 to 2033

Figure 230: MEA Market Value Share (%) and BPS Analysis by End-Use Industry, 2023 to 2033

Figure 231: MEA Market Y-o-Y Growth (%) Projections by End-Use Industry, 2023 to 2033

Figure 232: MEA Market Value (US$ Million) Analysis by Automation Grade, 2017 to 2033

Figure 233: MEA Market Volume (MT) Analysis by Automation Grade, 2017 to 2033

Figure 234: MEA Market Value Share (%) and BPS Analysis by Automation Grade, 2023 to 2033

Figure 235: MEA Market Y-o-Y Growth (%) Projections by Automation Grade, 2023 to 2033

Figure 236: MEA Market Attractiveness by Processing Technique, 2023 to 2033

Figure 237: MEA Market Attractiveness by Process Components, 2023 to 2033

Figure 238: MEA Market Attractiveness by End-Use Industry, 2023 to 2033

Figure 239: MEA Market Attractiveness by Automation Grade, 2023 to 2033

Figure 240: MEA Market Attractiveness by Country, 2023 to 2033

Frequently Asked Questions

What is the current size of the tea processing equipment market?

The global tea processing equipment market size is expected to reach USD 12.8 Billion in 2023.

At what rate will the global tea processing equipment market grow during the forecast period?

As per FMI, the worldwide tea processing equipment market is anticipated to grow at a CAGR of 6.4% during the forecast period.

What is the projected valuation for tea processing equipment market in 2032?

The global tea processing equipment market is projected to surpass a valuation of USD 25 Billion by the end of 2033.

What is the North America tea processing equipment market outlook?

Currently, North American tea processing equipment market is valued at USD 3,584.0 Million and it holds around 28% share of the global market.

Which are the major countries driving demand for tea processing equipment?

The USA, China, Canada, India, Kenya, and the UK are the major countries driving demand for tea processing equipment.

How big is the China tea processing equipment market?

China holds approximately 32% share in the Asia Pacific tea processing equipment market.

Who are some of the top players operating in the tea processing equipment market?

Steelsworth,Marshall Fowler Engineers,Kawasaki Kiko,Bharat Engineering Works,G.K Tea Industries are some of the top players operating in the tea processing equipment market.

Explore Similar Insights

Future Market Insights

Tea Processing Equipment Market