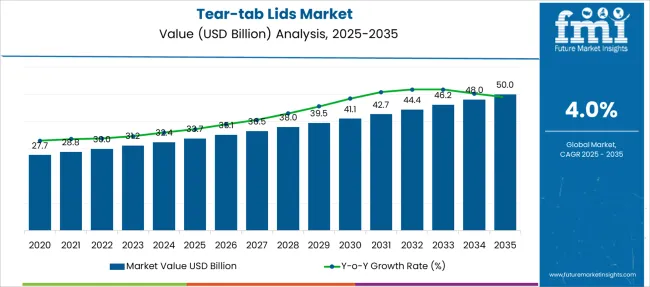
The tear tab lids market is likely to record a strong CAGR of 4% during the forecast period. The tear tab lids market is currently valued at USD 30 Billion in 2021 and is likely to reach USD 49.20 Billion by 2032.
Report Attribute | Details |
---|---|
Estimated Base Year Value (2022) | USD 30 Billion |
Anticipated Forecast Value (2032) | USD 49.20 Billion |
Projected Growth Rate (2022 to 2032) | 4% CAGR |
Sales of tear tab lids are expected to rise owing to the growth in the amount of secure packaging. In addition to this, demand for tear tab lids is rising on account of the lookout for more efficient packaging options that prioritize security for various companies.
Increasing beverage consumption is also projected to contribute to the growth of the tear tab lids market share.
The report sheds light on the factors improving the sales of tear tab lids, and, in turn, the opportunities for the market players. However, the tear tab lid market also faces some challenges, which might limit the tear tab lids market share from reaching its potential.
Some of the key tear tab lid market trends promoting the demand for tear tab lids include the change in manufacturers’ preferences regarding plastic usage.
Aesthetic packaging along with tamper evidence security is gaining attraction, which is expected to boost the sales of tear-tab lids in the global lids market.
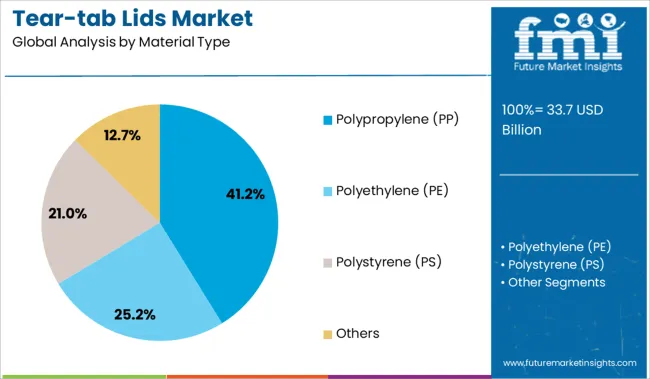
However, decreasing plastic consumption due to the single-use plastic ban is anticipated to reduce the demand for tear-tab lids. The manufacturers in the packaging industry are providing tear-tab lids made up of various materials which primarily include high-density polyethylene.
The tear-tab lids market is anticipated to expand during the forecast period, as per the increasing beverage consumption. Manufacturing sector growth is also expected to impact the growth in the sales of tear-tab lids in an indirect way, wherein, the growth of protective packaging is triggering market growth.
The food & beverage industry growth is anticipated to drive the sales of tear-tab lids in the market during the forecast period.
The demand for tear-tab lids is anticipated to expand with a moderate CAGR during the forecast period, owing to a change in manufacturers’ preference regarding plastic usage.
Increasing consumption of soft drinks, energy drinks, as well as carbonated drinks is expected to create a demand for tear-tab lids.
The rise in beverage consumption is anticipated to boost the sales of tear-tab lids in North America during the forecast period.
In Europe, the decrease in the usage of disposable plastic products is expected to hinder the demand for tear-tab lids. However, sustainable product offerings such as bio-based plastic lids and recyclable plastic lids may gear up the sales of tear-tab lids in the upcoming years.
In European countries such as Germany, Belgium, and the United Kingdom, a ban on single-use plastic products may affect the tear-tab lids market growth during the forecast period.
Owing to increasing urbanization and demand for secure & sustainable packaging in emerging regions including India, Mexico & China, the tear-tab lids market to gain attraction in the near future.
East Asia is expected to create higher incremental opportunities than Latin America in terms of beverage packaging market growth during the forecast period.
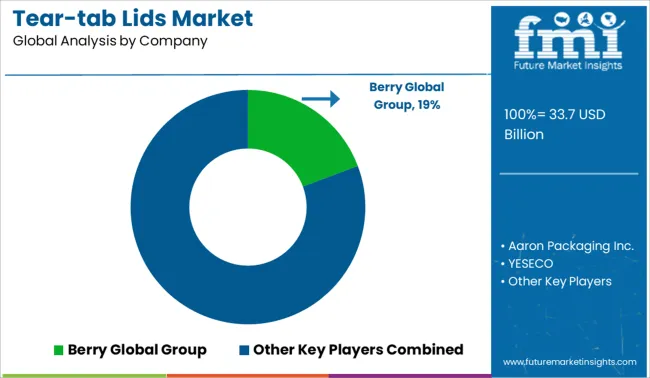
Some of the leading manufacturers in the tear-tab lids market are Essentra Pty Ltd., Aaron Packaging Inc., Letica Corporation, etc.
Key manufacturers are offering resealable tear-tab lids with a snug and secure fit design, which is expected to impact the brand owner’s choice during mass purchase. Some of the manufacturers are offering tear-tab lids with Styrene-Butadiene Rubber gaskets which help preserve the contents inside the packaging.
The report consists of key players contributing to the dual chamber bottles market share. It also consists of organic and inorganic growth strategies adopted by market players to improve their market positions. This exclusive report analyses the competitive landscape and dual chamber bottles market share acquired by players to strengthen their market position.
Report Attribute | Details |
---|---|
Growth Rate | CAGR of 4% from 2022 to 2032 |
The base year for estimation | 2021 |
Historical data | 2015 to 2020 |
Forecast period | 2022 to 2032 |
Quantitative units | Revenue in USD million and CAGR from 2022 to 2032 |
Report Coverage | Revenue forecast, volume forecast, company ranking, competitive landscape, growth factors, and trends, Pricing Analysis |
Segments Covered | Material Used, Sales Channel, Application, Region |
Regional scope | North America; Latin America; Europe; Middle East and Africa; East Asia; South Asia; Oceania |
Country scope | USA, Canada, Mexico, Europe, Germany, UK, France, Russia, Italy, Rest of Europe, China, Japan, South Korea, India, Southeast Asia, Rest of Asia-Pacific, South America, Brazil, Argentina, Columbia, Rest of South America, Saudi Arabia, UAE, Egypt, Nigeria, South Africa, Rest of Middle East and Africa |
Key companies profiled | Essentra Pty Ltd.; Aaron Packaging Inc.; Letica Corporation |
Customization scope | Free report customization (equivalent to up to 8 analysts' working days) with purchase. Addition or alteration to country, regional & segment scope. |
Pricing and purchase options | Avail customized purchase options to meet your exact research needs. |
Table 01: Global Market Value (US$ Million) Forecast by Region, 2015 to 2032
Table 02: Global Market Volume (Units) Forecast by Region, 2015 to 2032
Table 03: Global Market Value (US$ Million) Forecast by Material, 2015 to 2032
Table 04: Global Market Volume (Units) Forecast by Material, 2015 to 2032
Table 05: Global Market Value (US$ Million) Forecast by Application, 2015 to 2032
Table 06: Global Market Volume (Units) Forecast by Application, 2015 to 2032
Table 07: Global Market Value (US$ Million) Forecast by End Use, 2015 to 2032
Table 08: Global Market Volume (Units) Forecast by End Use, 2015 to 2032
Table 09: North America Market Value (US$ Million) Forecast by Country, 2015 to 2032
Table 10: North America Market Volume (Units) Forecast by Country, 2015 to 2032
Table 11: North America Market Value (US$ Million) Forecast by Material, 2015 to 2032
Table 12: North America Market Volume (Units) Forecast by Material, 2015 to 2032
Table 13: North America Market Value (US$ Million) Forecast by Application, 2015 to 2032
Table 14: North America Market Volume (Units) Forecast by Application, 2015 to 2032
Table 15: North America Market Value (US$ Million) Forecast by End Use, 2015 to 2032
Table 16: North America Market Volume (Units) Forecast by End Use, 2015 to 2032
Table 17: Latin America Market Value (US$ Million) Forecast by Country, 2015 to 2032
Table 18: Latin America Market Volume (Units) Forecast by Country, 2015 to 2032
Table 19: Latin America Market Value (US$ Million) Forecast by Material, 2015 to 2032
Table 20: Latin America Market Volume (Units) Forecast by Material, 2015 to 2032
Table 21: Latin America Market Value (US$ Million) Forecast by Application, 2015 to 2032
Table 22: Latin America Market Volume (Units) Forecast by Application, 2015 to 2032
Table 23: Latin America Market Value (US$ Million) Forecast by End Use, 2015 to 2032
Table 24: Latin America Market Volume (Units) Forecast by End Use, 2015 to 2032
Table 25: Europe Market Value (US$ Million) Forecast by Country, 2015 to 2032
Table 26: Europe Market Volume (Units) Forecast by Country, 2015 to 2032
Table 27: Europe Market Value (US$ Million) Forecast by Material, 2015 to 2032
Table 28: Europe Market Volume (Units) Forecast by Material, 2015 to 2032
Table 29: Europe Market Value (US$ Million) Forecast by Application, 2015 to 2032
Table 30: Europe Market Volume (Units) Forecast by Application, 2015 to 2032
Table 31: Europe Market Value (US$ Million) Forecast by End Use, 2015 to 2032
Table 32: Europe Market Volume (Units) Forecast by End Use, 2015 to 2032
Table 33: East Asia Market Value (US$ Million) Forecast by Country, 2015 to 2032
Table 34: East Asia Market Volume (Units) Forecast by Country, 2015 to 2032
Table 35: East Asia Market Value (US$ Million) Forecast by Material, 2015 to 2032
Table 36: East Asia Market Volume (Units) Forecast by Material, 2015 to 2032
Table 37: East Asia Market Value (US$ Million) Forecast by Application, 2015 to 2032
Table 38: East Asia Market Volume (Units) Forecast by Application, 2015 to 2032
Table 39: East Asia Market Value (US$ Million) Forecast by End Use, 2015 to 2032
Table 40: East Asia Market Volume (Units) Forecast by End Use, 2015 to 2032
Table 41: South Asia Market Value (US$ Million) Forecast by Country, 2015 to 2032
Table 42: South Asia Market Volume (Units) Forecast by Country, 2015 to 2032
Table 43: South Asia Market Value (US$ Million) Forecast by Material, 2015 to 2032
Table 44: South Asia Market Volume (Units) Forecast by Material, 2015 to 2032
Table 45: South Asia Market Value (US$ Million) Forecast by Application, 2015 to 2032
Table 46: South Asia Market Volume (Units) Forecast by Application, 2015 to 2032
Table 47: South Asia Market Value (US$ Million) Forecast by End Use, 2015 to 2032
Table 48: South Asia Market Volume (Units) Forecast by End Use, 2015 to 2032
Table 49: Oceania Market Value (US$ Million) Forecast by Country, 2015 to 2032
Table 50: Oceania Market Volume (Units) Forecast by Country, 2015 to 2032
Table 51: Oceania Market Value (US$ Million) Forecast by Material, 2015 to 2032
Table 52: Oceania Market Volume (Units) Forecast by Material, 2015 to 2032
Table 53: Oceania Market Value (US$ Million) Forecast by Application, 2015 to 2032
Table 54: Oceania Market Volume (Units) Forecast by Application, 2015 to 2032
Table 55: Oceania Market Value (US$ Million) Forecast by End Use, 2015 to 2032
Table 56: Oceania Market Volume (Units) Forecast by End Use, 2015 to 2032
Table 57: Middle East and Africa Market Value (US$ Million) Forecast by Country, 2015 to 2032
Table 58: Middle East and Africa Market Volume (Units) Forecast by Country, 2015 to 2032
Table 59: Middle East and Africa Market Value (US$ Million) Forecast by Material, 2015 to 2032
Table 60: Middle East and Africa Market Volume (Units) Forecast by Material, 2015 to 2032
Table 61: Middle East and Africa Market Value (US$ Million) Forecast by Application, 2015 to 2032
Table 62: Middle East and Africa Market Volume (Units) Forecast by Application, 2015 to 2032
Table 63: Middle East and Africa Market Value (US$ Million) Forecast by End Use, 2015 to 2032
Table 64: Middle East and Africa Market Volume (Units) Forecast by End Use, 2015 to 2032
Table 65: United States of America Market Value (US$ Million) Forecast by Material, Application, and End Use (2022(E) & 2032(F))
Table 66: Canada Market Value (US$ Million) Forecast by Material, Application, and End Use (2022(E) & 2032(F))
Table 67: Brazil Market Value (US$ Million) Forecast by Material, Application, and End Use (2022(E) & 2032(F))
Table 68: Mexico Market Value (US$ Million) Forecast by Material, Application, and End Use (2022(E) & 2032(F))
Table 69: Germany Market Value (US$ Million) Forecast by Material, Application, and End Use (2022(E) & 2032(F))
Table 70: Italy Market Value (US$ Million) Forecast by Material, Application, and End Use (2022(E) & 2032(F))
Table 71: France Market Value (US$ Million) Forecast by Material, Application, and End Use (2022(E) & 2032(F))
Table 72: Spain Market Value (US$ Million) Forecast by Material, Application, and End Use (2022(E) & 2032(F))
Table 73: United Kingdom Market Value (US$ Million) Forecast by Material, Application, and End Use (2022(E) & 2032(F))
Table 74: Russia Market Value (US$ Million) Forecast by Material, Application, and End Use (2022(E) & 2032(F))
Table 75: China Market Value (US$ Million) Forecast by Material, Application, and End Use (2022(E) & 2032(F))
Table 76: Japan Market Value (US$ Million) Forecast by Material, Application, and End Use (2022(E) & 2032(F))
Table 77: India Market Value (US$ Million) Forecast by Material, Application, and End Use (2022(E) & 2032(F))
Table 78: GCC Countries Market Value (US$ Million) Forecast by Material, Application, and End Use (2022(E) & 2032(F))
Table 79: Australia Market Value (US$ Million) Forecast by Material, Application, and End Use (2022(E) & 2032(F))
Figure 01: Global Market Value (US$ Million) by Material, 2022 to 2032
Figure 02: Global Market Value (US$ Million) by Application, 2022 to 2032
Figure 03: Global Market Value (US$ Million) by End Use, 2022 to 2032
Figure 04: Global Market Value (US$ Million) by Region, 2022 to 2032
Figure 05: Global Market Value (US$ Million) Analysis by Region, 2015 to 2021
Figure 06: Global Market Volume (Units) Analysis by Region, 2015 to 2032
Figure 07: Global Market Value Share (%) and BPS Analysis by Region, 2022 to 2032
Figure 08: Global Market Y-o-Y Growth (%) Projections by Region, 2022 to 2032
Figure 09: Global Market Value (US$ Million) Analysis by Material, 2015 to 2021
Figure 10: Global Market Volume (Units) Analysis by Material, 2015 to 2032
Figure 11: Global Market Value Share (%) and BPS Analysis by Material, 2022 to 2032
Figure 12: Global Market Y-o-Y Growth (%) Projections by Material, 2022 to 2032
Figure 13: Global Market Value (US$ Million) Analysis by Application, 2015 to 2021
Figure 14: Global Market Volume (Units) Analysis by Application, 2015 to 2032
Figure 15: Global Market Value Share (%) and BPS Analysis by Application, 2022 to 2032
Figure 16: Global Market Y-o-Y Growth (%) Projections by Application, 2022 to 2032
Figure 17: Global Market Value (US$ Million) Analysis by End Use, 2015 to 2021
Figure 18: Global Market Volume (Units) Analysis by End Use, 2015 to 2032
Figure 19: Global Market Value Share (%) and BPS Analysis by End Use, 2022 to 2032
Figure 20: Global Market Y-o-Y Growth (%) Projections by End Use, 2022 to 2032
Figure 21: Global Market Attractiveness by Material, 2022 to 2032
Figure 22: Global Market Attractiveness by Application, 2022 to 2032
Figure 23: Global Market Attractiveness by End Use, 2022 to 2032
Figure 24: Global Market Attractiveness by End Use, 2022 to 2032
Figure 25: Global Market Attractiveness by Region, 2022 to 2032
Figure 26: North America Market Value (US$ Million) by Material, 2022 to 2032
Figure 27: North America Market Value (US$ Million) by Application, 2022 to 2032
Figure 28: North America Market Value (US$ Million) by End Use, 2022 to 2032
Figure 29: North America Market Value (US$ Million) by Country, 2022 to 2032
Figure 30: North America Market Value (US$ Million) Analysis by Country, 2015 to 2021
Figure 31: North America Market Volume (Units) Analysis by Country, 2015 to 2032
Figure 32: North America Market Value Share (%) and BPS Analysis by Country, 2022 to 2032
Figure 33: North America Market Y-o-Y Growth (%) Projections by Country, 2022 to 2032
Figure 34: North America Market Value (US$ Million) Analysis by Material, 2015 to 2021
Figure 35: North America Market Volume (Units) Analysis by Material, 2015 to 2032
Figure 36: North America Market Value Share (%) and BPS Analysis by Material, 2022 to 2032
Figure 37: North America Market Y-o-Y Growth (%) Projections by Material, 2022 to 2032
Figure 38: North America Market Value (US$ Million) Analysis by Application, 2015 to 2021
Figure 39: North America Market Volume (Units) Analysis by Application, 2015 to 2032
Figure 40: North America Market Value Share (%) and BPS Analysis by Application, 2022 to 2032
Figure 41: North America Market Y-o-Y Growth (%) Projections by Application, 2022 to 2032
Figure 42: North America Market Value (US$ Million) Analysis by End Use, 2015 to 2021
Figure 43: North America Market Volume (Units) Analysis by End Use, 2015 to 2032
Figure 44: North America Market Value Share (%) and BPS Analysis by End Use, 2022 to 2032
Figure 45: North America Market Y-o-Y Growth (%) Projections by End Use, 2022 to 2032
Figure 46: North America Market Attractiveness by Material, 2022 to 2032
Figure 47: North America Market Attractiveness by Application, 2022 to 2032
Figure 48: North America Market Attractiveness by End Use, 2022 to 2032
Figure 49: North America Market Attractiveness by Country, 2022 to 2032
Figure 50: Latin America Market Value (US$ Million) by Material, 2022 to 2032
Figure 51: Latin America Market Value (US$ Million) by Application, 2022 to 2032
Figure 52: Latin America Market Value (US$ Million) by End Use, 2022 to 2032
Figure 53: Latin America Market Value (US$ Million) by Country, 2022 to 2032
Figure 54: Latin America Market Value (US$ Million) Analysis by Country, 2015 to 2021
Figure 55: Latin America Market Volume (Units) Analysis by Country, 2015 to 2032
Figure 56: Latin America Market Value Share (%) and BPS Analysis by Country, 2022 to 2032
Figure 57: Latin America Market Y-o-Y Growth (%) Projections by Country, 2022 to 2032
Figure 58: Latin America Market Value (US$ Million) Analysis by Material, 2015 to 2021
Figure 59: Latin America Market Volume (Units) Analysis by Material, 2015 to 2032
Figure 60: Latin America Market Value Share (%) and BPS Analysis by Material, 2022 to 2032
Figure 61: Latin America Market Y-o-Y Growth (%) Projections by Material, 2022 to 2032
Figure 62: Latin America Market Value (US$ Million) Analysis by Application, 2015 to 2021
Figure 63: Latin America Market Volume (Units) Analysis by Application, 2015 to 2032
Figure 64: Latin America Market Value Share (%) and BPS Analysis by Application, 2022 to 2032
Figure 65: Latin America Market Y-o-Y Growth (%) Projections by Application, 2022 to 2032
Figure 66: Latin America Market Value (US$ Million) Analysis by End Use, 2015 to 2021
Figure 67: Latin America Market Volume (Units) Analysis by End Use, 2015 to 2032
Figure 68: Latin America Market Value Share (%) and BPS Analysis by End Use, 2022 to 2032
Figure 69: Latin America Market Y-o-Y Growth (%) Projections by End Use, 2022 to 2032
Figure 70: Latin America Market Attractiveness by Material, 2022 to 2032
Figure 71: Latin America Market Attractiveness by Application, 2022 to 2032
Figure 72: Latin America Market Attractiveness by End Use, 2022 to 2032
Figure 73: Latin America Market Attractiveness by Country, 2022 to 2032
Figure 74: Europe Market Value (US$ Million) by Material, 2022 to 2032
Figure 75: Europe Market Value (US$ Million) by Application, 2022 to 2032
Figure 76: Europe Market Value (US$ Million) by End Use, 2022 to 2032
Figure 77: Europe Market Value (US$ Million) by Country, 2022 to 2032
Figure 78: Europe Market Value (US$ Million) Analysis by Country, 2015 to 2021
Figure 79: Europe Market Volume (Units) Analysis by Country, 2015 to 2032
Figure 80: Europe Market Value Share (%) and BPS Analysis by Country, 2022 to 2032
Figure 81: Europe Market Y-o-Y Growth (%) Projections by Country, 2022 to 2032
Figure 82: Europe Market Value (US$ Million) Analysis by Material, 2015 to 2021
Figure 83: Europe Market Volume (Units) Analysis by Material, 2015 to 2032
Figure 84: Europe Market Value Share (%) and BPS Analysis by Material, 2022 to 2032
Figure 85: Europe Market Y-o-Y Growth (%) Projections by Material, 2022 to 2032
Figure 86: Europe Market Value (US$ Million) Analysis by Application, 2015 to 2021
Figure 87: Europe Market Volume (Units) Analysis by Application, 2015 to 2032
Figure 88: Europe Market Value Share (%) and BPS Analysis by Application, 2022 to 2032
Figure 89: Europe Market Y-o-Y Growth (%) Projections by Application, 2022 to 2032
Figure 90: Europe Market Value (US$ Million) Analysis by End Use, 2015 to 2021
Figure 91: Europe Market Volume (Units) Analysis by End Use, 2015 to 2032
Figure 92: Europe Market Value Share (%) and BPS Analysis by End Use, 2022 to 2032
Figure 93: Europe Market Y-o-Y Growth (%) Projections by End Use, 2022 to 2032
Figure 94: Europe Market Attractiveness by Material, 2022 to 2032
Figure 95: Europe Market Attractiveness by Application, 2022 to 2032
Figure 96: Europe Market Attractiveness by End Use, 2022 to 2032
Figure 97: Europe Market Attractiveness by Country, 2022 to 2032
Figure 98: East Asia Market Value (US$ Million) by Material, 2022 to 2032
Figure 99: East Asia Market Value (US$ Million) by Application, 2022 to 2032
Figure 100: East Asia Market Value (US$ Million) by End Use, 2022 to 2032
Figure 101: East Asia Market Value (US$ Million) by Country, 2022 to 2032
Figure 102: East Asia Market Value (US$ Million) Analysis by Country, 2015 to 2021
Figure 103: East Asia Market Volume (Units) Analysis by Country, 2015 to 2032
Figure 104: East Asia Market Value Share (%) and BPS Analysis by Country, 2022 to 2032
Figure 105: East Asia Market Y-o-Y Growth (%) Projections by Country, 2022 to 2032
Figure 106: East Asia Market Value (US$ Million) Analysis by Material, 2015 to 2021
Figure 107: East Asia Market Volume (Units) Analysis by Material, 2015 to 2032
Figure 108: East Asia Market Value Share (%) and BPS Analysis by Material, 2022 to 2032
Figure 109: East Asia Market Y-o-Y Growth (%) Projections by Material, 2022 to 2032
Figure 110: East Asia Market Value (US$ Million) Analysis by Application, 2015 to 2021
Figure 111: East Asia Market Volume (Units) Analysis by Application, 2015 to 2032
Figure 112: East Asia Market Value Share (%) and BPS Analysis by Application, 2022 to 2032
Figure 113: East Asia Market Y-o-Y Growth (%) Projections by Application, 2022 to 2032
Figure 114: East Asia Market Value (US$ Million) Analysis by End Use, 2015 to 2021
Figure 115: East Asia Market Volume (Units) Analysis by End Use, 2015 to 2032
Figure 116: East Asia Market Value Share (%) and BPS Analysis by End Use, 2022 to 2032
Figure 117: East Asia Market Y-o-Y Growth (%) Projections by End Use, 2022 to 2032
Figure 118: East Asia Market Attractiveness by Material, 2022 to 2032
Figure 119: East Asia Market Attractiveness by Application, 2022 to 2032
Figure 120: East Asia Market Attractiveness by End Use, 2022 to 2032
Figure 121: East Asia Market Attractiveness by Country, 2022 to 2032
Figure 122: South Asia Market Value (US$ Million) by Material, 2022 to 2032
Figure 123: South Asia Market Value (US$ Million) by Application, 2022 to 2032
Figure 124: South Asia Market Value (US$ Million) by End Use, 2022 to 2032
Figure 125: South Asia Market Value (US$ Million) by Country, 2022 to 2032
Figure 126: South Asia Market Value (US$ Million) Analysis by Country, 2015 to 2021
Figure 127: South Asia Market Volume (Units) Analysis by Country, 2015 to 2032
Figure 128: South Asia Market Value Share (%) and BPS Analysis by Country, 2022 to 2032
Figure 129: South Asia Market Y-o-Y Growth (%) Projections by Country, 2022 to 2032
Figure 130: South Asia Market Value (US$ Million) Analysis by Material, 2015 to 2021
Figure 131: South Asia Market Volume (Units) Analysis by Material, 2015 to 2032
Figure 132: South Asia Market Value Share (%) and BPS Analysis by Material, 2022 to 2032
Figure 133: South Asia Market Y-o-Y Growth (%) Projections by Material, 2022 to 2032
Figure 134: South Asia Market Value (US$ Million) Analysis by Application, 2015 to 2021
Figure 135: South Asia Market Volume (Units) Analysis by Application, 2015 to 2032
Figure 136: South Asia Market Value Share (%) and BPS Analysis by Application, 2022 to 2032
Figure 137: South Asia Market Y-o-Y Growth (%) Projections by Application, 2022 to 2032
Figure 138: South Asia Market Value (US$ Million) Analysis by End Use, 2015 to 2021
Figure 139: South Asia Market Volume (Units) Analysis by End Use, 2015 to 2032
Figure 140: South Asia Market Value Share (%) and BPS Analysis by End Use, 2022 to 2032
Figure 141: South Asia Market Y-o-Y Growth (%) Projections by End Use, 2022 to 2032
Figure 142: South Asia Market Attractiveness by Material, 2022 to 2032
Figure 143: South Asia Market Attractiveness by Application, 2022 to 2032
Figure 144: South Asia Market Attractiveness by End Use, 2022 to 2032
Figure 145: South Asia Market Attractiveness by Country, 2022 to 2032
Figure 146: Oceania Market Value (US$ Million) by Material, 2022 to 2032
Figure 147: Oceania Market Value (US$ Million) by Application, 2022 to 2032
Figure 148: Oceania Market Value (US$ Million) by End Use, 2022 to 2032
Figure 149: Oceania Market Value (US$ Million) by Country, 2022 to 2032
Figure 150: Oceania Market Value (US$ Million) Analysis by Country, 2015 to 2021
Figure 151: Oceania Market Volume (Units) Analysis by Country, 2015 to 2032
Figure 152: Oceania Market Value Share (%) and BPS Analysis by Country, 2022 to 2032
Figure 153: Oceania Market Y-o-Y Growth (%) Projections by Country, 2022 to 2032
Figure 154: Oceania Market Value (US$ Million) Analysis by Material, 2015 to 2021
Figure 155: Oceania Market Volume (Units) Analysis by Material, 2015 to 2032
Figure 156: Oceania Market Value Share (%) and BPS Analysis by Material, 2022 to 2032
Figure 157: Oceania Market Y-o-Y Growth (%) Projections by Material, 2022 to 2032
Figure 158: Oceania Market Value (US$ Million) Analysis by Application, 2015 to 2021
Figure 159: Oceania Market Volume (Units) Analysis by Application, 2015 to 2032
Figure 160: Oceania Market Value Share (%) and BPS Analysis by Application, 2022 to 2032
Figure 161: Oceania Market Y-o-Y Growth (%) Projections by Application, 2022 to 2032
Figure 162: Oceania Market Value (US$ Million) Analysis by End Use, 2015 to 2021
Figure 163: Oceania Market Volume (Units) Analysis by End Use, 2015 to 2032
Figure 164: Oceania Market Value Share (%) and BPS Analysis by End Use, 2022 to 2032
Figure 165: Oceania Market Y-o-Y Growth (%) Projections by End Use, 2022 to 2032
Figure 166: Oceania Market Attractiveness by Material, 2022 to 2032
Figure 167: Oceania Market Attractiveness by Application, 2022 to 2032
Figure 168: Oceania Market Attractiveness by End Use, 2022 to 2032
Figure 169: Oceania Market Attractiveness by Country, 2022 to 2032
Figure 170: Middle East and Africa Market Value (US$ Million) by Material, 2022 to 2032
Figure 171: Middle East and Africa Market Value (US$ Million) by Application, 2022 to 2032
Figure 172: Middle East and Africa Market Value (US$ Million) by End Use, 2022 to 2032
Figure 173: Middle East and Africa Market Value (US$ Million) by Country, 2022 to 2032
Figure 174: Middle East and Africa Market Value (US$ Million) Analysis by Country, 2015 to 2021
Figure 175: Middle East and Africa Market Volume (Units) Analysis by Country, 2015 to 2032
Figure 176: Middle East and Africa Market Value Share (%) and BPS Analysis by Country, 2022 to 2032
Figure 177: Middle East and Africa Market Y-o-Y Growth (%) Projections by Country, 2022 to 2032
Figure 178: Middle East and Africa Market Value (US$ Million) Analysis by Material, 2015 to 2021
Figure 179: Middle East and Africa Market Volume (Units) Analysis by Material, 2015 to 2032
Figure 180: Middle East and Africa Market Value Share (%) and BPS Analysis by Material, 2022 to 2032
Figure 181: Middle East and Africa Market Y-o-Y Growth (%) Projections by Material, 2022 to 2032
Figure 182: Middle East and Africa Market Value (US$ Million) Analysis by Application, 2015 to 2021
Figure 183: Middle East and Africa Market Volume (Units) Analysis by Application, 2015 to 2032
Figure 184: Middle East and Africa Market Value Share (%) and BPS Analysis by Application, 2022 to 2032
Figure 185: Middle East and Africa Market Y-o-Y Growth (%) Projections by Application, 2022 to 2032
Figure 186: Middle East and Africa Market Value (US$ Million) Analysis by End Use, 2015 to 2021
Figure 187: Middle East and Africa Market Volume (Units) Analysis by End Use, 2015 to 2032
Figure 188: Middle East and Africa Market Value Share (%) and BPS Analysis by End Use, 2022 to 2032
Figure 189: Middle East and Africa Market Y-o-Y Growth (%) Projections by End Use, 2022 to 2032
Figure 190: Middle East and Africa Market Attractiveness by Material, 2022 to 2032
Figure 191: Middle East and Africa Market Attractiveness by Application, 2022 to 2032
Figure 192: Middle East and Africa Market Attractiveness by End Use, 2022 to 2032
Figure 193: Middle East and Africa Market Attractiveness by Country, 2022 to 2032
The tear-tab lids market is predicted to grow at 4% CAGR through 2032.
The North America tear-tab lids market holds the highest revenue potential.
The tear-tab lids market is expected to surpass USD 49.20 Billion by 2032.
The tear-tab lids market size is anticipated to be over USD 30 Billion in 2022.
Explore Similar Insights
Thank you!
You will receive an email from our Business Development Manager. Please be sure to check your SPAM/JUNK folder too.