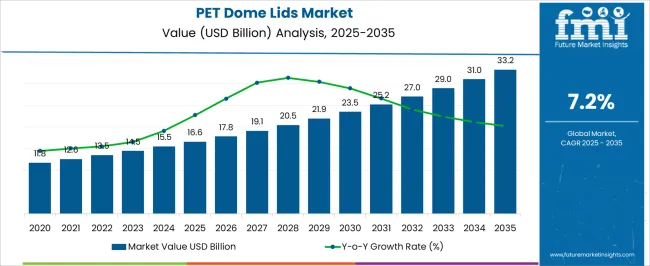
The global PET dome lids market size is expected to be valued at USD 14.4 billion in 2023. eCommerce and delivery services, bolsters the overall scope for the PET dome lids market, which is projected to grow at a CAGR of 7.5% between 2023 and 2033, totaling around USD 29.6 billion by 2033.
Data Points | Key Statistics |
---|---|
PET Dome Lids Market Value 2023 | USD 14.4 billion |
PET Dome Lids Market Projected Value (2033) | USD 29.6 billion |
PET Dome Lids Market CAGR (2023 to 2033) | 7.5% |
The increased prevalence of food delivery and takeout services has transformed the way people access and consume their meals. The trend, accelerated by changing consumer lifestyles and has led to a substantial shift in the food industry landscape. One of the critical components of the success of food delivery and takeout services is the packaging used to ensure that meals arrive at their destination in optimal condition. In this context, PET dome lids have emerged as a key solution to address the unique challenges posed by these services.
One of the foremost concerns in food delivery and takeout is maintaining the integrity of the packaged food during transit. PET dome lids offer a secure and spill-resistant packaging solution that minimizes the risk of leaks, spills, and contamination. The lids create a protective barrier that prevents the escape of liquids, dressings, sauces, or other components of the meal, ensuring that the food remains intact and appetizing upon arrival.
Presentation plays a crucial role in the food industry, even when meals are being enjoyed off-premises. PET dome lids provide a clear view of the contents inside the container, allowing customers to see the freshness and quality of the food they have ordered. The visual appeal of a well-presented meal contributes to customer satisfaction and enhances the overall dining experience, even when the meal is consumed at home.
The global demand for PET dome lids increased at a CAGR of 3.5% during the forecast period between 2018 and 2022, reaching a total of USD 29.6 billion in 2033. According to Future Market Insights, a market research and competitive intelligence provider the PET dome lids market was valued at USD 13.4 billion in 2022.
Visual appeal and branding are integral components of marketing and customer engagement, and in the context of the food industry, they play a crucial role in influencing consumer perceptions and driving purchasing decisions. The transparent and aesthetically pleasing design of PET dome lids contributes significantly to enhancing the visual appeal of packaged products, thereby creating a positive impact on the overall branding strategy of businesses.
PET dome lids offer a clear view of the contents within the packaging, allowing customers to visually assess the quality, freshness, and presentation of the food items. For restaurants and food businesses, this provides an opportunity to showcase their commitment to using premium ingredients and delivering well-prepared dishes. When customers can see the vibrant colors, textures, and layers of a meal, it builds trust and confidence in the brand's offerings.
The saying "we eat with our eyes first" holds true in the world of food. PET dome lids create a literal window into the delectable creations inside, tantalizing the senses and arousing appetite. The ability to visually connect with the food can trigger cravings and anticipation, making the dining experience more enjoyable even when customers are eating at home.
Growing QSR and Fast-Casual Drinking is Likely to be Beneficial for Market Growth
The rise of quick-service restaurants (QSR) and fast-casual dining is reshaping the way people eat, emphasizing speed, convenience, and quality. PET dome lids play a pivotal role in meeting the evolving demands of modern consumers who are looking for efficient and portable food options. The use of PET dome lids aligns seamlessly with the operational and customer experience goals of QSR and fast-casual establishments.
Modern lifestyles are increasingly fast-paced, and consumers often find themselves eating on the go. QSR and fast-casual dining cater to this need by providing quick and convenient meal options. PET dome lids provide an ideal solution for packaging these meals, allowing customers to carry their food easily and securely without worrying about spills or leakage.
PET dome lids are designed for easy handling and sealing, making them a convenient choice for customers who want to enjoy their meals without the hassle of traditional lids. The lids snap into place with a user-friendly mechanism, enabling customers to open and close the packaging effortlessly while on the move.
QSR and fast-casual establishments prioritize food quality and freshness, even for takeout or to-go orders. PET dome lids offer a protective barrier that helps retain the flavor, aroma, and temperature of the food, which ensures that customers can enjoy the same level of taste and satisfaction as they would if dining in.
Rise in Micro-Markets and Vending to Fuel the Market Growth
The rise of micro-markets and automated vending machines is transforming the way consumers access and purchase a wide range of products in diverse environments. The compact, self-service retail spaces are becoming increasingly popular in workplaces, educational institutions, healthcare facilities, and public areas. PET dome lids play a significant role in catering to the unique needs of micro-markets and vending, contributing to the growth and success of this retail format.
Micro-markets and vending machines rely on visual presentation to attract and engage consumers. PET dome lids provide a clear and unobstructed view of the products inside, allowing customers to see the freshness, quality, and variety of options available. The visual appeal can entice customers to make spontaneous purchases, enhancing the overall shopping experience.
Micro-markets and vending machines are typically organized with limited shelf space. PET dome lids elevate the visibility of the packaged items, making it easier for customers to identify their preferred products without the need to open doors or compartments. The convenience encourages quicker decision-making and reduces browsing time.
Just like in traditional retail settings, maintaining product freshness is crucial in micro-markets and vending. PET dome lids create a protective barrier that helps preserve the quality and taste of the contents. Customers can confidently select items knowing they are well-sealed and protected.
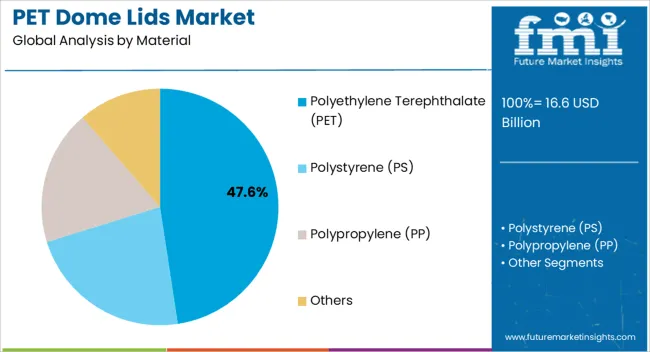
By material, polyethylene terephthalate segment is estimated to be the leading segment at a CAGR of 7.4% during the forecast period. PET is prized for its exceptional clarity and transparency, making it an ideal material for dome lids. The ability to showcase the contents of the container effectively enhances the visual appeal of products, which is crucial in the food and beverage industry.
PET dome lids offer a clear view of the packaged items, allowing customers to easily assess the freshness, quality, and quantity of the contents, and this factor is particularly significant in the retail and foodservice sectors, where visual presentation plays a pivotal role in influencing purchase decisions.
PET is conducive to high-quality printing and labeling, allowing brands to showcase their logos, designs, nutritional information, and other relevant details on the lid's surface. The branding opportunity enhances brand recognition and customer engagement.
The sustainability aspect of PET is a major driver of its adoption. PET is widely recognized for its recyclability and compatibility with existing recycling streams. The use of PET aligns with the demand for eco-friendly packaging solutions, as environmental concerns grow.
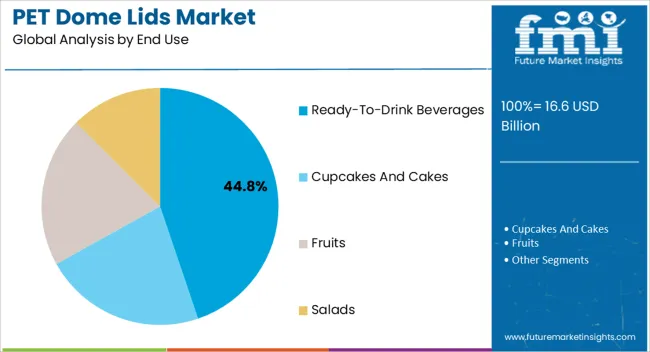
By end use, ready-to-drink beverages segment is estimated to be the leading segment at a CAGR of 7.4% during the forecast period.
The "Ready-to-Drink Beverages" segment is expected to play a pivotal role in boosting the growth of the PET Dome Lids Market. The lids find extensive application in the packaging of a wide range of ready-to-drink beverages, including juices, smoothies, iced coffees, teas, and other refreshing drinks.
Ready-to-drink beverages are often consumed on the go, making convenience and portability critical factors. PET dome lids provide a secure and spill-resistant covering, allowing consumers to enjoy their beverages without the risk of leakage during transportation.
The clarity and transparency of PET dome lids enhance the visual appeal of ready-to-drink beverages. Consumers are drawn to products that allow them to see the vibrant colors and freshness of the contents, contributing to a positive perception of the brand and product quality.
PET dome lids offer a hygienic barrier that protects beverages from contaminants, dust, and external elements. In an era of heightened awareness of health and safety, the sealed and protected nature of these lids assures consumers of product integrity.
The high demand for PET dome lids in the beverage industry, especially in Canada and the United States is set to bode well for the North America market. The increasing usage of these lids to close bottles for storing juices, soda, and beer is anticipated to fuel the growth.
The easy availability of relatively low-cost personalized lids backed by the presence of many new entrants in this region is another crucial factor that is projected to accelerate the market. The growing number of restaurants providing home delivery and takeaway services across the United States is estimated to augment the growth. The region is expected to hold a CAGR of 7.4% over the analysis period.
The increasing number of fast-food chain outlets in emerging economies, such as India and China is anticipated to augur well for the Asia Pacific PET dome lids market share in the assessment period. The ever-increasing population in these countries and their busy lifestyles are also set to influence the growth in this region.
The high demand for dairy products in India owing to their numerous health benefits is expected to push the market across Asia Pacific. The products can surge the shelf life of products, as PET dome lids provide a complete barrier against moisture, light, and oxygen transmission. The factor is likely to affect the market positively in this region. The region is expected to rise at a CAGR of 7.3% over the analysis period.
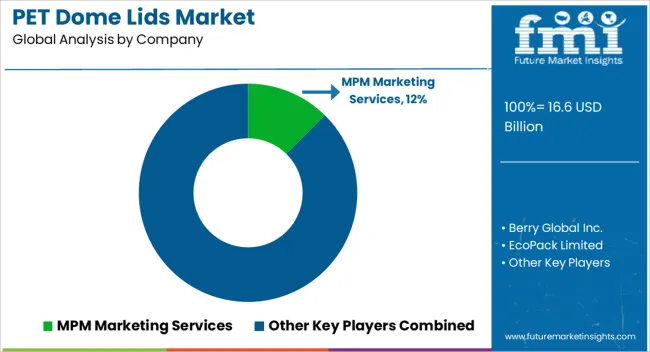
Key players in the PET dome lids market are strongly focusing on profit generation from their existing product portfolios along while exploring potential new applications.
The players are emphasizing on increasing their PET dome lids production capacities, to cater to the demand from numerous end use industries. Prominent players are also pushing for geographical expansion to decrease the dependency on imported PET dome lids.
Recent Developments:
Attributes | Details |
---|---|
Forecast Period | 2023 to 2033 |
Historical Data Available for | 2018 to 2022 |
Expected Value in 2023 | USD 14.4 billion |
Projected Value in 2033 | USD 29.6 billion |
Growth Rate | 7.5 CAGR from 2023 to 2033 |
Market Analysis | USD billion for value and Tons for Volume |
Key Regions Covered | North America; Latin America; Western Europe; Eastern Europe; South Asia & Pacific; East Asia; Middle East & Africa |
Key Countries Covered | United States, Canada, Brazil, Mexico, Germany, United Kingdom, France, Spain, Italy, Poland, Russia, Czech Republic, Romania, India, Bangladesh, Australia, New Zealand, China, Japan, South Korea, GCC Countries, South Africa, Israel |
Key Segments Covered | Material, Design, End Use, Sales Channel, Region |
Key Companies Profiled | MPM Marketing Services; Berry Global Inc.; EcoPack Limited; Sam's Club, Inc.; Georgia-Pacific LLC; Sabert Corporation; Dart Container Corporation; Amhil Europe; Aveco Packaging; YESECO |
Customization & Pricing | Available upon Request |
Table 1: Global Market Value (US$ Million) Forecast by Region, 2018 to 2033
Table 2: Global Market Volume (Units) Forecast by Region, 2018 to 2033
Table 3: Global Market Value (US$ Million) Forecast by Material, 2018 to 2033
Table 4: Global Market Volume (Units) Forecast by Material, 2018 to 2033
Table 5: Global Market Value (US$ Million) Forecast by Design, 2018 to 2033
Table 6: Global Market Volume (Units) Forecast by Design, 2018 to 2033
Table 7: Global Market Value (US$ Million) Forecast by End Use, 2018 to 2033
Table 8: Global Market Volume (Units) Forecast by End Use, 2018 to 2033
Table 9: Global Market Value (US$ Million) Forecast by Sales Channel, 2018 to 2033
Table 10: Global Market Volume (Units) Forecast by Sales Channel, 2018 to 2033
Table 11: North America Market Value (US$ Million) Forecast by Country, 2018 to 2033
Table 12: North America Market Volume (Units) Forecast by Country, 2018 to 2033
Table 13: North America Market Value (US$ Million) Forecast by Material, 2018 to 2033
Table 14: North America Market Volume (Units) Forecast by Material, 2018 to 2033
Table 15: North America Market Value (US$ Million) Forecast by Design, 2018 to 2033
Table 16: North America Market Volume (Units) Forecast by Design, 2018 to 2033
Table 17: North America Market Value (US$ Million) Forecast by End Use, 2018 to 2033
Table 18: North America Market Volume (Units) Forecast by End Use, 2018 to 2033
Table 19: North America Market Value (US$ Million) Forecast by Sales Channel, 2018 to 2033
Table 20: North America Market Volume (Units) Forecast by Sales Channel, 2018 to 2033
Table 21: Latin America Market Value (US$ Million) Forecast by Country, 2018 to 2033
Table 22: Latin America Market Volume (Units) Forecast by Country, 2018 to 2033
Table 23: Latin America Market Value (US$ Million) Forecast by Material, 2018 to 2033
Table 24: Latin America Market Volume (Units) Forecast by Material, 2018 to 2033
Table 25: Latin America Market Value (US$ Million) Forecast by Design, 2018 to 2033
Table 26: Latin America Market Volume (Units) Forecast by Design, 2018 to 2033
Table 27: Latin America Market Value (US$ Million) Forecast by End Use, 2018 to 2033
Table 28: Latin America Market Volume (Units) Forecast by End Use, 2018 to 2033
Table 29: Latin America Market Value (US$ Million) Forecast by Sales Channel, 2018 to 2033
Table 30: Latin America Market Volume (Units) Forecast by Sales Channel, 2018 to 2033
Table 31: Western Europe Market Value (US$ Million) Forecast by Country, 2018 to 2033
Table 32: Western Europe Market Volume (Units) Forecast by Country, 2018 to 2033
Table 33: Western Europe Market Value (US$ Million) Forecast by Material, 2018 to 2033
Table 34: Western Europe Market Volume (Units) Forecast by Material, 2018 to 2033
Table 35: Western Europe Market Value (US$ Million) Forecast by Design, 2018 to 2033
Table 36: Western Europe Market Volume (Units) Forecast by Design, 2018 to 2033
Table 37: Western Europe Market Value (US$ Million) Forecast by End Use, 2018 to 2033
Table 38: Western Europe Market Volume (Units) Forecast by End Use, 2018 to 2033
Table 39: Western Europe Market Value (US$ Million) Forecast by Sales Channel, 2018 to 2033
Table 40: Western Europe Market Volume (Units) Forecast by Sales Channel, 2018 to 2033
Table 41: Eastern Europe Market Value (US$ Million) Forecast by Country, 2018 to 2033
Table 42: Eastern Europe Market Volume (Units) Forecast by Country, 2018 to 2033
Table 43: Eastern Europe Market Value (US$ Million) Forecast by Material, 2018 to 2033
Table 44: Eastern Europe Market Volume (Units) Forecast by Material, 2018 to 2033
Table 45: Eastern Europe Market Value (US$ Million) Forecast by Design, 2018 to 2033
Table 46: Eastern Europe Market Volume (Units) Forecast by Design, 2018 to 2033
Table 47: Eastern Europe Market Value (US$ Million) Forecast by End Use, 2018 to 2033
Table 48: Eastern Europe Market Volume (Units) Forecast by End Use, 2018 to 2033
Table 49: Eastern Europe Market Value (US$ Million) Forecast by Sales Channel, 2018 to 2033
Table 50: Eastern Europe Market Volume (Units) Forecast by Sales Channel, 2018 to 2033
Table 51: South Asia and Pacific Market Value (US$ Million) Forecast by Country, 2018 to 2033
Table 52: South Asia and Pacific Market Volume (Units) Forecast by Country, 2018 to 2033
Table 53: South Asia and Pacific Market Value (US$ Million) Forecast by Material, 2018 to 2033
Table 54: South Asia and Pacific Market Volume (Units) Forecast by Material, 2018 to 2033
Table 55: South Asia and Pacific Market Value (US$ Million) Forecast by Design, 2018 to 2033
Table 56: South Asia and Pacific Market Volume (Units) Forecast by Design, 2018 to 2033
Table 57: South Asia and Pacific Market Value (US$ Million) Forecast by End Use, 2018 to 2033
Table 58: South Asia and Pacific Market Volume (Units) Forecast by End Use, 2018 to 2033
Table 59: South Asia and Pacific Market Value (US$ Million) Forecast by Sales Channel, 2018 to 2033
Table 60: South Asia and Pacific Market Volume (Units) Forecast by Sales Channel, 2018 to 2033
Table 61: East Asia Market Value (US$ Million) Forecast by Country, 2018 to 2033
Table 62: East Asia Market Volume (Units) Forecast by Country, 2018 to 2033
Table 63: East Asia Market Value (US$ Million) Forecast by Material, 2018 to 2033
Table 64: East Asia Market Volume (Units) Forecast by Material, 2018 to 2033
Table 65: East Asia Market Value (US$ Million) Forecast by Design, 2018 to 2033
Table 66: East Asia Market Volume (Units) Forecast by Design, 2018 to 2033
Table 67: East Asia Market Value (US$ Million) Forecast by End Use, 2018 to 2033
Table 68: East Asia Market Volume (Units) Forecast by End Use, 2018 to 2033
Table 69: East Asia Market Value (US$ Million) Forecast by Sales Channel, 2018 to 2033
Table 70: East Asia Market Volume (Units) Forecast by Sales Channel, 2018 to 2033
Table 71: Middle East and Africa Market Value (US$ Million) Forecast by Country, 2018 to 2033
Table 72: Middle East and Africa Market Volume (Units) Forecast by Country, 2018 to 2033
Table 73: Middle East and Africa Market Value (US$ Million) Forecast by Material, 2018 to 2033
Table 74: Middle East and Africa Market Volume (Units) Forecast by Material, 2018 to 2033
Table 75: Middle East and Africa Market Value (US$ Million) Forecast by Design, 2018 to 2033
Table 76: Middle East and Africa Market Volume (Units) Forecast by Design, 2018 to 2033
Table 77: Middle East and Africa Market Value (US$ Million) Forecast by End Use, 2018 to 2033
Table 78: Middle East and Africa Market Volume (Units) Forecast by End Use, 2018 to 2033
Table 79: Middle East and Africa Market Value (US$ Million) Forecast by Sales Channel, 2018 to 2033
Table 80: Middle East and Africa Market Volume (Units) Forecast by Sales Channel, 2018 to 2033
Figure 1: Global Market Value (US$ Million) by Material, 2023 to 2033
Figure 2: Global Market Value (US$ Million) by Design, 2023 to 2033
Figure 3: Global Market Value (US$ Million) by End Use, 2023 to 2033
Figure 4: Global Market Value (US$ Million) by Sales Channel, 2023 to 2033
Figure 5: Global Market Value (US$ Million) by Region, 2023 to 2033
Figure 6: Global Market Value (US$ Million) Analysis by Region, 2018 to 2033
Figure 7: Global Market Volume (Units) Analysis by Region, 2018 to 2033
Figure 8: Global Market Value Share (%) and BPS Analysis by Region, 2023 to 2033
Figure 9: Global Market Y-o-Y Growth (%) Projections by Region, 2023 to 2033
Figure 10: Global Market Value (US$ Million) Analysis by Material, 2018 to 2033
Figure 11: Global Market Volume (Units) Analysis by Material, 2018 to 2033
Figure 12: Global Market Value Share (%) and BPS Analysis by Material, 2023 to 2033
Figure 13: Global Market Y-o-Y Growth (%) Projections by Material, 2023 to 2033
Figure 14: Global Market Value (US$ Million) Analysis by Design, 2018 to 2033
Figure 15: Global Market Volume (Units) Analysis by Design, 2018 to 2033
Figure 16: Global Market Value Share (%) and BPS Analysis by Design, 2023 to 2033
Figure 17: Global Market Y-o-Y Growth (%) Projections by Design, 2023 to 2033
Figure 18: Global Market Value (US$ Million) Analysis by End Use, 2018 to 2033
Figure 19: Global Market Volume (Units) Analysis by End Use, 2018 to 2033
Figure 20: Global Market Value Share (%) and BPS Analysis by End Use, 2023 to 2033
Figure 21: Global Market Y-o-Y Growth (%) Projections by End Use, 2023 to 2033
Figure 22: Global Market Value (US$ Million) Analysis by Sales Channel, 2018 to 2033
Figure 23: Global Market Volume (Units) Analysis by Sales Channel, 2018 to 2033
Figure 24: Global Market Value Share (%) and BPS Analysis by Sales Channel, 2023 to 2033
Figure 25: Global Market Y-o-Y Growth (%) Projections by Sales Channel, 2023 to 2033
Figure 26: Global Market Attractiveness by Material, 2023 to 2033
Figure 27: Global Market Attractiveness by Design, 2023 to 2033
Figure 28: Global Market Attractiveness by End Use, 2023 to 2033
Figure 29: Global Market Attractiveness by Sales Channel, 2023 to 2033
Figure 30: Global Market Attractiveness by Region, 2023 to 2033
Figure 31: North America Market Value (US$ Million) by Material, 2023 to 2033
Figure 32: North America Market Value (US$ Million) by Design, 2023 to 2033
Figure 33: North America Market Value (US$ Million) by End Use, 2023 to 2033
Figure 34: North America Market Value (US$ Million) by Sales Channel, 2023 to 2033
Figure 35: North America Market Value (US$ Million) by Country, 2023 to 2033
Figure 36: North America Market Value (US$ Million) Analysis by Country, 2018 to 2033
Figure 37: North America Market Volume (Units) Analysis by Country, 2018 to 2033
Figure 38: North America Market Value Share (%) and BPS Analysis by Country, 2023 to 2033
Figure 39: North America Market Y-o-Y Growth (%) Projections by Country, 2023 to 2033
Figure 40: North America Market Value (US$ Million) Analysis by Material, 2018 to 2033
Figure 41: North America Market Volume (Units) Analysis by Material, 2018 to 2033
Figure 42: North America Market Value Share (%) and BPS Analysis by Material, 2023 to 2033
Figure 43: North America Market Y-o-Y Growth (%) Projections by Material, 2023 to 2033
Figure 44: North America Market Value (US$ Million) Analysis by Design, 2018 to 2033
Figure 45: North America Market Volume (Units) Analysis by Design, 2018 to 2033
Figure 46: North America Market Value Share (%) and BPS Analysis by Design, 2023 to 2033
Figure 47: North America Market Y-o-Y Growth (%) Projections by Design, 2023 to 2033
Figure 48: North America Market Value (US$ Million) Analysis by End Use, 2018 to 2033
Figure 49: North America Market Volume (Units) Analysis by End Use, 2018 to 2033
Figure 50: North America Market Value Share (%) and BPS Analysis by End Use, 2023 to 2033
Figure 51: North America Market Y-o-Y Growth (%) Projections by End Use, 2023 to 2033
Figure 52: North America Market Value (US$ Million) Analysis by Sales Channel, 2018 to 2033
Figure 53: North America Market Volume (Units) Analysis by Sales Channel, 2018 to 2033
Figure 54: North America Market Value Share (%) and BPS Analysis by Sales Channel, 2023 to 2033
Figure 55: North America Market Y-o-Y Growth (%) Projections by Sales Channel, 2023 to 2033
Figure 56: North America Market Attractiveness by Material, 2023 to 2033
Figure 57: North America Market Attractiveness by Design, 2023 to 2033
Figure 58: North America Market Attractiveness by End Use, 2023 to 2033
Figure 59: North America Market Attractiveness by Sales Channel, 2023 to 2033
Figure 60: North America Market Attractiveness by Country, 2023 to 2033
Figure 61: Latin America Market Value (US$ Million) by Material, 2023 to 2033
Figure 62: Latin America Market Value (US$ Million) by Design, 2023 to 2033
Figure 63: Latin America Market Value (US$ Million) by End Use, 2023 to 2033
Figure 64: Latin America Market Value (US$ Million) by Sales Channel, 2023 to 2033
Figure 65: Latin America Market Value (US$ Million) by Country, 2023 to 2033
Figure 66: Latin America Market Value (US$ Million) Analysis by Country, 2018 to 2033
Figure 67: Latin America Market Volume (Units) Analysis by Country, 2018 to 2033
Figure 68: Latin America Market Value Share (%) and BPS Analysis by Country, 2023 to 2033
Figure 69: Latin America Market Y-o-Y Growth (%) Projections by Country, 2023 to 2033
Figure 70: Latin America Market Value (US$ Million) Analysis by Material, 2018 to 2033
Figure 71: Latin America Market Volume (Units) Analysis by Material, 2018 to 2033
Figure 72: Latin America Market Value Share (%) and BPS Analysis by Material, 2023 to 2033
Figure 73: Latin America Market Y-o-Y Growth (%) Projections by Material, 2023 to 2033
Figure 74: Latin America Market Value (US$ Million) Analysis by Design, 2018 to 2033
Figure 75: Latin America Market Volume (Units) Analysis by Design, 2018 to 2033
Figure 76: Latin America Market Value Share (%) and BPS Analysis by Design, 2023 to 2033
Figure 77: Latin America Market Y-o-Y Growth (%) Projections by Design, 2023 to 2033
Figure 78: Latin America Market Value (US$ Million) Analysis by End Use, 2018 to 2033
Figure 79: Latin America Market Volume (Units) Analysis by End Use, 2018 to 2033
Figure 80: Latin America Market Value Share (%) and BPS Analysis by End Use, 2023 to 2033
Figure 81: Latin America Market Y-o-Y Growth (%) Projections by End Use, 2023 to 2033
Figure 82: Latin America Market Value (US$ Million) Analysis by Sales Channel, 2018 to 2033
Figure 83: Latin America Market Volume (Units) Analysis by Sales Channel, 2018 to 2033
Figure 84: Latin America Market Value Share (%) and BPS Analysis by Sales Channel, 2023 to 2033
Figure 85: Latin America Market Y-o-Y Growth (%) Projections by Sales Channel, 2023 to 2033
Figure 86: Latin America Market Attractiveness by Material, 2023 to 2033
Figure 87: Latin America Market Attractiveness by Design, 2023 to 2033
Figure 88: Latin America Market Attractiveness by End Use, 2023 to 2033
Figure 89: Latin America Market Attractiveness by Sales Channel, 2023 to 2033
Figure 90: Latin America Market Attractiveness by Country, 2023 to 2033
Figure 91: Western Europe Market Value (US$ Million) by Material, 2023 to 2033
Figure 92: Western Europe Market Value (US$ Million) by Design, 2023 to 2033
Figure 93: Western Europe Market Value (US$ Million) by End Use, 2023 to 2033
Figure 94: Western Europe Market Value (US$ Million) by Sales Channel, 2023 to 2033
Figure 95: Western Europe Market Value (US$ Million) by Country, 2023 to 2033
Figure 96: Western Europe Market Value (US$ Million) Analysis by Country, 2018 to 2033
Figure 97: Western Europe Market Volume (Units) Analysis by Country, 2018 to 2033
Figure 98: Western Europe Market Value Share (%) and BPS Analysis by Country, 2023 to 2033
Figure 99: Western Europe Market Y-o-Y Growth (%) Projections by Country, 2023 to 2033
Figure 100: Western Europe Market Value (US$ Million) Analysis by Material, 2018 to 2033
Figure 101: Western Europe Market Volume (Units) Analysis by Material, 2018 to 2033
Figure 102: Western Europe Market Value Share (%) and BPS Analysis by Material, 2023 to 2033
Figure 103: Western Europe Market Y-o-Y Growth (%) Projections by Material, 2023 to 2033
Figure 104: Western Europe Market Value (US$ Million) Analysis by Design, 2018 to 2033
Figure 105: Western Europe Market Volume (Units) Analysis by Design, 2018 to 2033
Figure 106: Western Europe Market Value Share (%) and BPS Analysis by Design, 2023 to 2033
Figure 107: Western Europe Market Y-o-Y Growth (%) Projections by Design, 2023 to 2033
Figure 108: Western Europe Market Value (US$ Million) Analysis by End Use, 2018 to 2033
Figure 109: Western Europe Market Volume (Units) Analysis by End Use, 2018 to 2033
Figure 110: Western Europe Market Value Share (%) and BPS Analysis by End Use, 2023 to 2033
Figure 111: Western Europe Market Y-o-Y Growth (%) Projections by End Use, 2023 to 2033
Figure 112: Western Europe Market Value (US$ Million) Analysis by Sales Channel, 2018 to 2033
Figure 113: Western Europe Market Volume (Units) Analysis by Sales Channel, 2018 to 2033
Figure 114: Western Europe Market Value Share (%) and BPS Analysis by Sales Channel, 2023 to 2033
Figure 115: Western Europe Market Y-o-Y Growth (%) Projections by Sales Channel, 2023 to 2033
Figure 116: Western Europe Market Attractiveness by Material, 2023 to 2033
Figure 117: Western Europe Market Attractiveness by Design, 2023 to 2033
Figure 118: Western Europe Market Attractiveness by End Use, 2023 to 2033
Figure 119: Western Europe Market Attractiveness by Sales Channel, 2023 to 2033
Figure 120: Western Europe Market Attractiveness by Country, 2023 to 2033
Figure 121: Eastern Europe Market Value (US$ Million) by Material, 2023 to 2033
Figure 122: Eastern Europe Market Value (US$ Million) by Design, 2023 to 2033
Figure 123: Eastern Europe Market Value (US$ Million) by End Use, 2023 to 2033
Figure 124: Eastern Europe Market Value (US$ Million) by Sales Channel, 2023 to 2033
Figure 125: Eastern Europe Market Value (US$ Million) by Country, 2023 to 2033
Figure 126: Eastern Europe Market Value (US$ Million) Analysis by Country, 2018 to 2033
Figure 127: Eastern Europe Market Volume (Units) Analysis by Country, 2018 to 2033
Figure 128: Eastern Europe Market Value Share (%) and BPS Analysis by Country, 2023 to 2033
Figure 129: Eastern Europe Market Y-o-Y Growth (%) Projections by Country, 2023 to 2033
Figure 130: Eastern Europe Market Value (US$ Million) Analysis by Material, 2018 to 2033
Figure 131: Eastern Europe Market Volume (Units) Analysis by Material, 2018 to 2033
Figure 132: Eastern Europe Market Value Share (%) and BPS Analysis by Material, 2023 to 2033
Figure 133: Eastern Europe Market Y-o-Y Growth (%) Projections by Material, 2023 to 2033
Figure 134: Eastern Europe Market Value (US$ Million) Analysis by Design, 2018 to 2033
Figure 135: Eastern Europe Market Volume (Units) Analysis by Design, 2018 to 2033
Figure 136: Eastern Europe Market Value Share (%) and BPS Analysis by Design, 2023 to 2033
Figure 137: Eastern Europe Market Y-o-Y Growth (%) Projections by Design, 2023 to 2033
Figure 138: Eastern Europe Market Value (US$ Million) Analysis by End Use, 2018 to 2033
Figure 139: Eastern Europe Market Volume (Units) Analysis by End Use, 2018 to 2033
Figure 140: Eastern Europe Market Value Share (%) and BPS Analysis by End Use, 2023 to 2033
Figure 141: Eastern Europe Market Y-o-Y Growth (%) Projections by End Use, 2023 to 2033
Figure 142: Eastern Europe Market Value (US$ Million) Analysis by Sales Channel, 2018 to 2033
Figure 143: Eastern Europe Market Volume (Units) Analysis by Sales Channel, 2018 to 2033
Figure 144: Eastern Europe Market Value Share (%) and BPS Analysis by Sales Channel, 2023 to 2033
Figure 145: Eastern Europe Market Y-o-Y Growth (%) Projections by Sales Channel, 2023 to 2033
Figure 146: Eastern Europe Market Attractiveness by Material, 2023 to 2033
Figure 147: Eastern Europe Market Attractiveness by Design, 2023 to 2033
Figure 148: Eastern Europe Market Attractiveness by End Use, 2023 to 2033
Figure 149: Eastern Europe Market Attractiveness by Sales Channel, 2023 to 2033
Figure 150: Eastern Europe Market Attractiveness by Country, 2023 to 2033
Figure 151: South Asia and Pacific Market Value (US$ Million) by Material, 2023 to 2033
Figure 152: South Asia and Pacific Market Value (US$ Million) by Design, 2023 to 2033
Figure 153: South Asia and Pacific Market Value (US$ Million) by End Use, 2023 to 2033
Figure 154: South Asia and Pacific Market Value (US$ Million) by Sales Channel, 2023 to 2033
Figure 155: South Asia and Pacific Market Value (US$ Million) by Country, 2023 to 2033
Figure 156: South Asia and Pacific Market Value (US$ Million) Analysis by Country, 2018 to 2033
Figure 157: South Asia and Pacific Market Volume (Units) Analysis by Country, 2018 to 2033
Figure 158: South Asia and Pacific Market Value Share (%) and BPS Analysis by Country, 2023 to 2033
Figure 159: South Asia and Pacific Market Y-o-Y Growth (%) Projections by Country, 2023 to 2033
Figure 160: South Asia and Pacific Market Value (US$ Million) Analysis by Material, 2018 to 2033
Figure 161: South Asia and Pacific Market Volume (Units) Analysis by Material, 2018 to 2033
Figure 162: South Asia and Pacific Market Value Share (%) and BPS Analysis by Material, 2023 to 2033
Figure 163: South Asia and Pacific Market Y-o-Y Growth (%) Projections by Material, 2023 to 2033
Figure 164: South Asia and Pacific Market Value (US$ Million) Analysis by Design, 2018 to 2033
Figure 165: South Asia and Pacific Market Volume (Units) Analysis by Design, 2018 to 2033
Figure 166: South Asia and Pacific Market Value Share (%) and BPS Analysis by Design, 2023 to 2033
Figure 167: South Asia and Pacific Market Y-o-Y Growth (%) Projections by Design, 2023 to 2033
Figure 168: South Asia and Pacific Market Value (US$ Million) Analysis by End Use, 2018 to 2033
Figure 169: South Asia and Pacific Market Volume (Units) Analysis by End Use, 2018 to 2033
Figure 170: South Asia and Pacific Market Value Share (%) and BPS Analysis by End Use, 2023 to 2033
Figure 171: South Asia and Pacific Market Y-o-Y Growth (%) Projections by End Use, 2023 to 2033
Figure 172: South Asia and Pacific Market Value (US$ Million) Analysis by Sales Channel, 2018 to 2033
Figure 173: South Asia and Pacific Market Volume (Units) Analysis by Sales Channel, 2018 to 2033
Figure 174: South Asia and Pacific Market Value Share (%) and BPS Analysis by Sales Channel, 2023 to 2033
Figure 175: South Asia and Pacific Market Y-o-Y Growth (%) Projections by Sales Channel, 2023 to 2033
Figure 176: South Asia and Pacific Market Attractiveness by Material, 2023 to 2033
Figure 177: South Asia and Pacific Market Attractiveness by Design, 2023 to 2033
Figure 178: South Asia and Pacific Market Attractiveness by End Use, 2023 to 2033
Figure 179: South Asia and Pacific Market Attractiveness by Sales Channel, 2023 to 2033
Figure 180: South Asia and Pacific Market Attractiveness by Country, 2023 to 2033
Figure 181: East Asia Market Value (US$ Million) by Material, 2023 to 2033
Figure 182: East Asia Market Value (US$ Million) by Design, 2023 to 2033
Figure 183: East Asia Market Value (US$ Million) by End Use, 2023 to 2033
Figure 184: East Asia Market Value (US$ Million) by Sales Channel, 2023 to 2033
Figure 185: East Asia Market Value (US$ Million) by Country, 2023 to 2033
Figure 186: East Asia Market Value (US$ Million) Analysis by Country, 2018 to 2033
Figure 187: East Asia Market Volume (Units) Analysis by Country, 2018 to 2033
Figure 188: East Asia Market Value Share (%) and BPS Analysis by Country, 2023 to 2033
Figure 189: East Asia Market Y-o-Y Growth (%) Projections by Country, 2023 to 2033
Figure 190: East Asia Market Value (US$ Million) Analysis by Material, 2018 to 2033
Figure 191: East Asia Market Volume (Units) Analysis by Material, 2018 to 2033
Figure 192: East Asia Market Value Share (%) and BPS Analysis by Material, 2023 to 2033
Figure 193: East Asia Market Y-o-Y Growth (%) Projections by Material, 2023 to 2033
Figure 194: East Asia Market Value (US$ Million) Analysis by Design, 2018 to 2033
Figure 195: East Asia Market Volume (Units) Analysis by Design, 2018 to 2033
Figure 196: East Asia Market Value Share (%) and BPS Analysis by Design, 2023 to 2033
Figure 197: East Asia Market Y-o-Y Growth (%) Projections by Design, 2023 to 2033
Figure 198: East Asia Market Value (US$ Million) Analysis by End Use, 2018 to 2033
Figure 199: East Asia Market Volume (Units) Analysis by End Use, 2018 to 2033
Figure 200: East Asia Market Value Share (%) and BPS Analysis by End Use, 2023 to 2033
Figure 201: East Asia Market Y-o-Y Growth (%) Projections by End Use, 2023 to 2033
Figure 202: East Asia Market Value (US$ Million) Analysis by Sales Channel, 2018 to 2033
Figure 203: East Asia Market Volume (Units) Analysis by Sales Channel, 2018 to 2033
Figure 204: East Asia Market Value Share (%) and BPS Analysis by Sales Channel, 2023 to 2033
Figure 205: East Asia Market Y-o-Y Growth (%) Projections by Sales Channel, 2023 to 2033
Figure 206: East Asia Market Attractiveness by Material, 2023 to 2033
Figure 207: East Asia Market Attractiveness by Design, 2023 to 2033
Figure 208: East Asia Market Attractiveness by End Use, 2023 to 2033
Figure 209: East Asia Market Attractiveness by Sales Channel, 2023 to 2033
Figure 210: East Asia Market Attractiveness by Country, 2023 to 2033
Figure 211: Middle East and Africa Market Value (US$ Million) by Material, 2023 to 2033
Figure 212: Middle East and Africa Market Value (US$ Million) by Design, 2023 to 2033
Figure 213: Middle East and Africa Market Value (US$ Million) by End Use, 2023 to 2033
Figure 214: Middle East and Africa Market Value (US$ Million) by Sales Channel, 2023 to 2033
Figure 215: Middle East and Africa Market Value (US$ Million) by Country, 2023 to 2033
Figure 216: Middle East and Africa Market Value (US$ Million) Analysis by Country, 2018 to 2033
Figure 217: Middle East and Africa Market Volume (Units) Analysis by Country, 2018 to 2033
Figure 218: Middle East and Africa Market Value Share (%) and BPS Analysis by Country, 2023 to 2033
Figure 219: Middle East and Africa Market Y-o-Y Growth (%) Projections by Country, 2023 to 2033
Figure 220: Middle East and Africa Market Value (US$ Million) Analysis by Material, 2018 to 2033
Figure 221: Middle East and Africa Market Volume (Units) Analysis by Material, 2018 to 2033
Figure 222: Middle East and Africa Market Value Share (%) and BPS Analysis by Material, 2023 to 2033
Figure 223: Middle East and Africa Market Y-o-Y Growth (%) Projections by Material, 2023 to 2033
Figure 224: Middle East and Africa Market Value (US$ Million) Analysis by Design, 2018 to 2033
Figure 225: Middle East and Africa Market Volume (Units) Analysis by Design, 2018 to 2033
Figure 226: Middle East and Africa Market Value Share (%) and BPS Analysis by Design, 2023 to 2033
Figure 227: Middle East and Africa Market Y-o-Y Growth (%) Projections by Design, 2023 to 2033
Figure 228: Middle East and Africa Market Value (US$ Million) Analysis by End Use, 2018 to 2033
Figure 229: Middle East and Africa Market Volume (Units) Analysis by End Use, 2018 to 2033
Figure 230: Middle East and Africa Market Value Share (%) and BPS Analysis by End Use, 2023 to 2033
Figure 231: Middle East and Africa Market Y-o-Y Growth (%) Projections by End Use, 2023 to 2033
Figure 232: Middle East and Africa Market Value (US$ Million) Analysis by Sales Channel, 2018 to 2033
Figure 233: Middle East and Africa Market Volume (Units) Analysis by Sales Channel, 2018 to 2033
Figure 234: Middle East and Africa Market Value Share (%) and BPS Analysis by Sales Channel, 2023 to 2033
Figure 235: Middle East and Africa Market Y-o-Y Growth (%) Projections by Sales Channel, 2023 to 2033
Figure 236: Middle East and Africa Market Attractiveness by Material, 2023 to 2033
Figure 237: Middle East and Africa Market Attractiveness by Design, 2023 to 2033
Figure 238: Middle East and Africa Market Attractiveness by End Use, 2023 to 2033
Figure 239: Middle East and Africa Market Attractiveness by Sales Channel, 2023 to 2033
Figure 240: Middle East and Africa Market Attractiveness by Country, 2023 to 2033
The market is valued at USD 14.4 billion in 2023.
MPM Marketing Services, Berry Global Inc., and EcoPack Limited are key market players.
A CAGR of 3.5% was recorded from 2018 to 2022 in the market.
The market shall reach USD 29.6 billion in 2033.
North America is expected to generate a 7.4% CAGR by 2033.
Explore Similar Insights
Thank you!
You will receive an email from our Business Development Manager. Please be sure to check your SPAM/JUNK folder too.