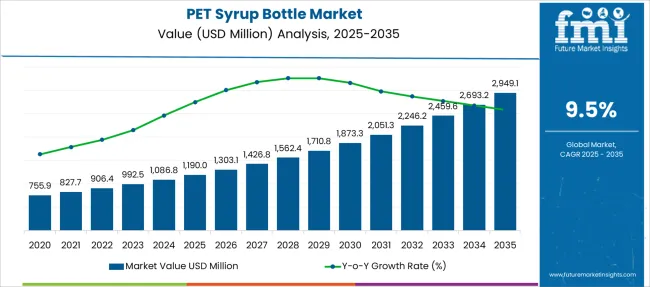
The sales in the global polyethylene terephthalate (PET) syrup bottle market are anticipated to project growth at an impressive CAGR of 9% to 10% CAGR during the assessment period from 2022 to 2032 in comparison to the 4% to 5% CAGR registered between 2013 and 2020. Increasing focus on introduction of sustainable and recyclable pharmaceutical packaging solutions for liquid products is estimated to facilitate the growth in the PET syrup bottle market.
Report Attribute | Details |
---|---|
PET Syrup Bottle Market Registered Growth Rate (2013 to 2020) | 4% to 5% CAGR |
PET Syrup Bottle Market Projected Growth Rate (2022 to 2032) | 9% to 10% CAGR |
Plastic syrup bottles are used for storing liquid food items, beverages, and liquid medicine. The PET syrup bottles are formulated from plastic resins called as Polyethylene Terephthalate (PET). These bottles are increasingly being adopted as an alternative to other rigid packaging solutions, owing to their inherent properties like transparency, lightweight, impact withstanding strength, and ability to provide excellent finished packaging to the products.
There is a significant rise in the prevalence of diseases such as flu, viral infections, cold, cough, and others, due to the depleting immunity of the population across the globe, resulting in propelling the demand for associate therapeutics such as tablets and liquid medicines.
According to a study by the Centers for Disease Control and Prevention (CDC), nearly 39 Million to 56 Million incidences of flu illnesses were estimated to be reported across the USA in the flu season between 2019 and 2020.
PET syrup bottles are extensively used for packaging liquid medicines and other medical products such as cough syrup, antiseptics, antipyretic syrup, and others. Hence, surging demand for liquid medications for the treatment of above-mentioned diseases is projected to create high revenue generation opportunities in the global market.
Due to the growing concerns pertaining to environmental safety and rising awareness regarding the adverse effects on nature because of the use of plastics, governments in several countries are implementing stringent regulations regarding the use of plastics. This is estimated to slow down the demand for PET syrup bottles in the coming years.
In addition to this, rising adoption of alternate packaging solutions like glass and metal bottles is also projected to hinder the sales of PET syrup bottles in the global market.
South Asia is expected to emerge as a highly remunerative market for PET syrup bottles during the forecast period 2022 to 2032, as per the Future Market Insights.
The market for PET syrup bottles is largely driven by rapidly expanding medical and pharmaceutical industries across Asia Pacific. A large number of pharmaceutical product manufacturing companies, increasing adoption of innovative technologies, and rising introduction of three-layered PET bottles for gamma rays irradiation are some of the factors bolstering the market growth in the PET syrup market across South Asia.
In addition to this, the increasing adoption of PET syrup bottles across the food & beverage industry, on account of its high good against chemical reactions, and tamper-proof properties is estimated to augment the demand in the market.
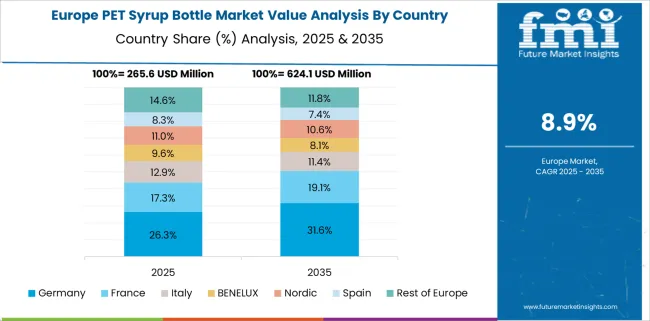
FMI reveals that Europe is estimated to exhibit growth at a rapid CAGR in the PET syrup bottle market during the forecast period 2022 to 2032.
Prominent players in the market are focusing on introducing novel plastic packaging solutions for liquid products to capitalize on the surging demand.
For instance, in January 2022, Berry M&H, a leading manufacturer & supplier of plastic packaging announced introducing a new 250nm PET syrup bottle that can be used for packaging a variety of syrups, sauces, fruit mixes, liqueurs, and others. A slew of such new product launches is anticipated to augment the growth in the Europe market.
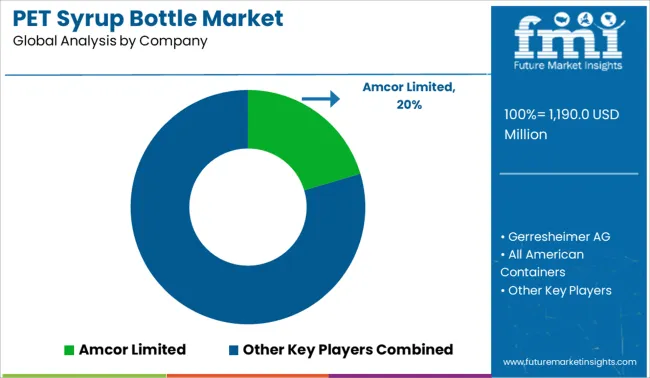
Some of the leading players in the PET syrup bottle market are Amcor Limited, Gerresheimer AG, All American Containers, Alpha Packaging, PET Power (RPC Group), PontEurope, Berry M&H, Graham Packaging Company, and others.
Key participants are focusing at adopting strategies such as new product launch, collaboration, partnership, mergers, and acquisitions to gain edge in the highly competitive PET syrup bottle market.
Report Attribute | Details |
---|---|
Growth Rate | CAGR of 9% to 10% from 2022 to 2032 |
Base Year for Estimation | 2021 |
Historical Data | 2015 to 2020 |
Forecast Period | 2022 to 2032 |
Quantitative Units | Revenue in USD Million, Volume in Kilotons and CAGR from 2022 to 2032 |
Report Coverage | Revenue Forecast, Volume Forecast, Company Ranking, Competitive Landscape, Growth Factors, Trends and Pricing Analysis |
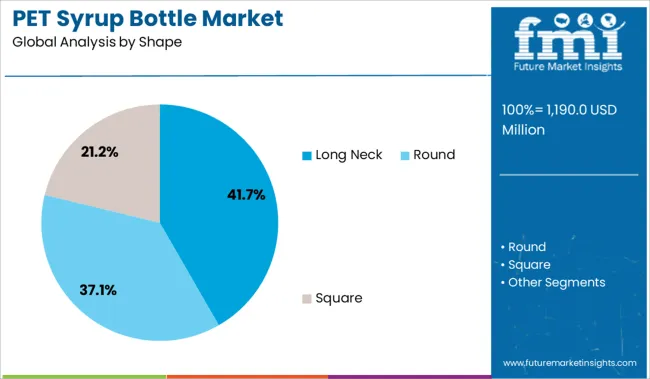
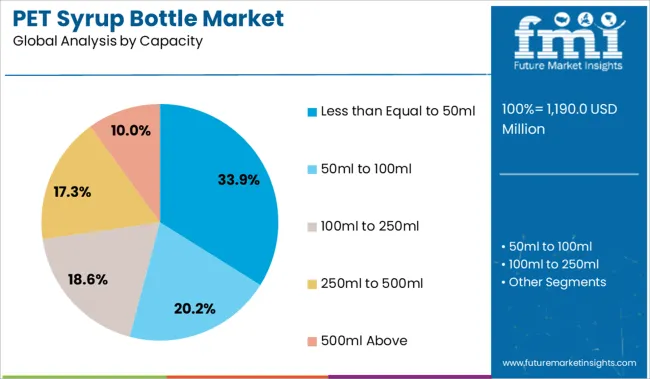
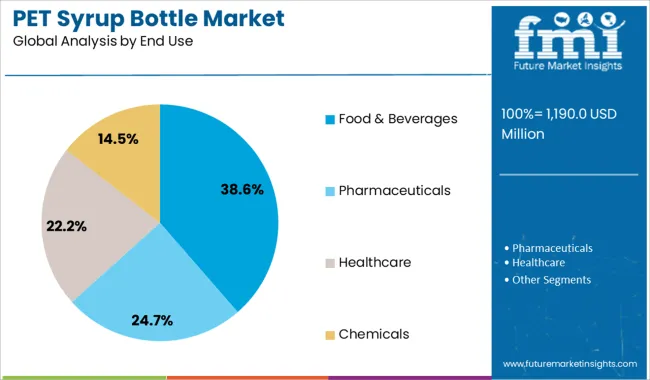
Segments Covered | Shape, Capacity, End Use, Region |
Regions Covered | North America; Latin America; Europe; East Asia; South Asia; Oceania; Middle East and Africa |
Key Companies Profiled | Amcor Limited; Gerresheimer AG; All American Containers; Alpha Packaging; PET Power (RPC Group); PontEurope; Berry M&H; Graham Packaging Company; Others |
Customization | Available Upon Request |
Table 1: Global PET Syrup Bottle Market Value (US$ Mn) Forecast by Region, 2017-2032
Table 2: Global PET Syrup Bottle Market Volume (Units) Forecast by Region, 2017-2032
Table 3: Global PET Syrup Bottle Market Value (US$ Mn) Forecast by Shape, 2017-2032
Table 4: Global PET Syrup Bottle Market Volume (Units) Forecast by Shape, 2017-2032
Table 5: Global PET Syrup Bottle Market Value (US$ Mn) Forecast by Capacity, 2017-2032
Table 6: Global PET Syrup Bottle Market Volume (Units) Forecast by Capacity, 2017-2032
Table 7: Global PET Syrup Bottle Market Value (US$ Mn) Forecast by End Use, 2017-2032
Table 8: Global PET Syrup Bottle Market Volume (Units) Forecast by End Use, 2017-2032
Table 9: North America PET Syrup Bottle Market Value (US$ Mn) Forecast by Country, 2017-2032
Table 10: North America PET Syrup Bottle Market Volume (Units) Forecast by Country, 2017-2032
Table 11: North America PET Syrup Bottle Market Value (US$ Mn) Forecast by Shape, 2017-2032
Table 12: North America PET Syrup Bottle Market Volume (Units) Forecast by Shape, 2017-2032
Table 13: North America PET Syrup Bottle Market Value (US$ Mn) Forecast by Capacity, 2017-2032
Table 14: North America PET Syrup Bottle Market Volume (Units) Forecast by Capacity, 2017-2032
Table 15: North America PET Syrup Bottle Market Value (US$ Mn) Forecast by End Use, 2017-2032
Table 16: North America PET Syrup Bottle Market Volume (Units) Forecast by End Use, 2017-2032
Table 17: Latin America PET Syrup Bottle Market Value (US$ Mn) Forecast by Country, 2017-2032
Table 18: Latin America PET Syrup Bottle Market Volume (Units) Forecast by Country, 2017-2032
Table 19: Latin America PET Syrup Bottle Market Value (US$ Mn) Forecast by Shape, 2017-2032
Table 20: Latin America PET Syrup Bottle Market Volume (Units) Forecast by Shape, 2017-2032
Table 21: Latin America PET Syrup Bottle Market Value (US$ Mn) Forecast by Capacity, 2017-2032
Table 22: Latin America PET Syrup Bottle Market Volume (Units) Forecast by Capacity, 2017-2032
Table 23: Latin America PET Syrup Bottle Market Value (US$ Mn) Forecast by End Use, 2017-2032
Table 24: Latin America PET Syrup Bottle Market Volume (Units) Forecast by End Use, 2017-2032
Table 25: Europe PET Syrup Bottle Market Value (US$ Mn) Forecast by Country, 2017-2032
Table 26: Europe PET Syrup Bottle Market Volume (Units) Forecast by Country, 2017-2032
Table 27: Europe PET Syrup Bottle Market Value (US$ Mn) Forecast by Shape, 2017-2032
Table 28: Europe PET Syrup Bottle Market Volume (Units) Forecast by Shape, 2017-2032
Table 29: Europe PET Syrup Bottle Market Value (US$ Mn) Forecast by Capacity, 2017-2032
Table 30: Europe PET Syrup Bottle Market Volume (Units) Forecast by Capacity, 2017-2032
Table 31: Europe PET Syrup Bottle Market Value (US$ Mn) Forecast by End Use, 2017-2032
Table 32: Europe PET Syrup Bottle Market Volume (Units) Forecast by End Use, 2017-2032
Table 33: Asia Pacific PET Syrup Bottle Market Value (US$ Mn) Forecast by Country, 2017-2032
Table 34: Asia Pacific PET Syrup Bottle Market Volume (Units) Forecast by Country, 2017-2032
Table 35: Asia Pacific PET Syrup Bottle Market Value (US$ Mn) Forecast by Shape, 2017-2032
Table 36: Asia Pacific PET Syrup Bottle Market Volume (Units) Forecast by Shape, 2017-2032
Table 37: Asia Pacific PET Syrup Bottle Market Value (US$ Mn) Forecast by Capacity, 2017-2032
Table 38: Asia Pacific PET Syrup Bottle Market Volume (Units) Forecast by Capacity, 2017-2032
Table 39: Asia Pacific PET Syrup Bottle Market Value (US$ Mn) Forecast by End Use, 2017-2032
Table 40: Asia Pacific PET Syrup Bottle Market Volume (Units) Forecast by End Use, 2017-2032
Table 41: MEA PET Syrup Bottle Market Value (US$ Mn) Forecast by Country, 2017-2032
Table 42: MEA PET Syrup Bottle Market Volume (Units) Forecast by Country, 2017-2032
Table 43: MEA PET Syrup Bottle Market Value (US$ Mn) Forecast by Shape, 2017-2032
Table 44: MEA PET Syrup Bottle Market Volume (Units) Forecast by Shape, 2017-2032
Table 45: MEA PET Syrup Bottle Market Value (US$ Mn) Forecast by Capacity, 2017-2032
Table 46: MEA PET Syrup Bottle Market Volume (Units) Forecast by Capacity, 2017-2032
Table 47: MEA PET Syrup Bottle Market Value (US$ Mn) Forecast by End Use, 2017-2032
Table 48: MEA PET Syrup Bottle Market Volume (Units) Forecast by End Use, 2017-2032
Figure 1: Global PET Syrup Bottle Market Value (US$ Mn) by Shape, 2022-2032
Figure 2: Global PET Syrup Bottle Market Value (US$ Mn) by Capacity, 2022-2032
Figure 3: Global PET Syrup Bottle Market Value (US$ Mn) by End Use, 2022-2032
Figure 4: Global PET Syrup Bottle Market Value (US$ Mn) by Region, 2022-2032
Figure 5: Global PET Syrup Bottle Market Value (US$ Mn) Analysis by Region, 2017-2032
Figure 6: Global PET Syrup Bottle Market Volume (Units) Analysis by Region, 2017-2032
Figure 7: Global PET Syrup Bottle Market Value Share (%) and BPS Analysis by Region, 2022-2032
Figure 8: Global PET Syrup Bottle Market Y-o-Y Growth (%) Projections by Region, 2022-2032
Figure 9: Global PET Syrup Bottle Market Value (US$ Mn) Analysis by Shape, 2017-2032
Figure 10: Global PET Syrup Bottle Market Volume (Units) Analysis by Shape, 2017-2032
Figure 11: Global PET Syrup Bottle Market Value Share (%) and BPS Analysis by Shape, 2022-2032
Figure 12: Global PET Syrup Bottle Market Y-o-Y Growth (%) Projections by Shape, 2022-2032
Figure 13: Global PET Syrup Bottle Market Value (US$ Mn) Analysis by Capacity, 2017-2032
Figure 14: Global PET Syrup Bottle Market Volume (Units) Analysis by Capacity, 2017-2032
Figure 15: Global PET Syrup Bottle Market Value Share (%) and BPS Analysis by Capacity, 2022-2032
Figure 16: Global PET Syrup Bottle Market Y-o-Y Growth (%) Projections by Capacity, 2022-2032
Figure 17: Global PET Syrup Bottle Market Value (US$ Mn) Analysis by End Use, 2017-2032
Figure 18: Global PET Syrup Bottle Market Volume (Units) Analysis by End Use, 2017-2032
Figure 19: Global PET Syrup Bottle Market Value Share (%) and BPS Analysis by End Use, 2022-2032
Figure 20: Global PET Syrup Bottle Market Y-o-Y Growth (%) Projections by End Use, 2022-2032
Figure 21: Global PET Syrup Bottle Market Attractiveness by Shape, 2022-2032
Figure 22: Global PET Syrup Bottle Market Attractiveness by Capacity, 2022-2032
Figure 23: Global PET Syrup Bottle Market Attractiveness by End Use, 2022-2032
Figure 24: Global PET Syrup Bottle Market Attractiveness by Region, 2022-2032
Figure 25: North America PET Syrup Bottle Market Value (US$ Mn) by Shape, 2022-2032
Figure 26: North America PET Syrup Bottle Market Value (US$ Mn) by Capacity, 2022-2032
Figure 27: North America PET Syrup Bottle Market Value (US$ Mn) by End Use, 2022-2032
Figure 28: North America PET Syrup Bottle Market Value (US$ Mn) by Country, 2022-2032
Figure 29: North America PET Syrup Bottle Market Value (US$ Mn) Analysis by Country, 2017-2032
Figure 30: North America PET Syrup Bottle Market Volume (Units) Analysis by Country, 2017-2032
Figure 31: North America PET Syrup Bottle Market Value Share (%) and BPS Analysis by Country, 2022-2032
Figure 32: North America PET Syrup Bottle Market Y-o-Y Growth (%) Projections by Country, 2022-2032
Figure 33: North America PET Syrup Bottle Market Value (US$ Mn) Analysis by Shape, 2017-2032
Figure 34: North America PET Syrup Bottle Market Volume (Units) Analysis by Shape, 2017-2032
Figure 35: North America PET Syrup Bottle Market Value Share (%) and BPS Analysis by Shape, 2022-2032
Figure 36: North America PET Syrup Bottle Market Y-o-Y Growth (%) Projections by Shape, 2022-2032
Figure 37: North America PET Syrup Bottle Market Value (US$ Mn) Analysis by Capacity, 2017-2032
Figure 38: North America PET Syrup Bottle Market Volume (Units) Analysis by Capacity, 2017-2032
Figure 39: North America PET Syrup Bottle Market Value Share (%) and BPS Analysis by Capacity, 2022-2032
Figure 40: North America PET Syrup Bottle Market Y-o-Y Growth (%) Projections by Capacity, 2022-2032
Figure 41: North America PET Syrup Bottle Market Value (US$ Mn) Analysis by End Use, 2017-2032
Figure 42: North America PET Syrup Bottle Market Volume (Units) Analysis by End Use, 2017-2032
Figure 43: North America PET Syrup Bottle Market Value Share (%) and BPS Analysis by End Use, 2022-2032
Figure 44: North America PET Syrup Bottle Market Y-o-Y Growth (%) Projections by End Use, 2022-2032
Figure 45: North America PET Syrup Bottle Market Attractiveness by Shape, 2022-2032
Figure 46: North America PET Syrup Bottle Market Attractiveness by Capacity, 2022-2032
Figure 47: North America PET Syrup Bottle Market Attractiveness by End Use, 2022-2032
Figure 48: North America PET Syrup Bottle Market Attractiveness by Country, 2022-2032
Figure 49: Latin America PET Syrup Bottle Market Value (US$ Mn) by Shape, 2022-2032
Figure 50: Latin America PET Syrup Bottle Market Value (US$ Mn) by Capacity, 2022-2032
Figure 51: Latin America PET Syrup Bottle Market Value (US$ Mn) by End Use, 2022-2032
Figure 52: Latin America PET Syrup Bottle Market Value (US$ Mn) by Country, 2022-2032
Figure 53: Latin America PET Syrup Bottle Market Value (US$ Mn) Analysis by Country, 2017-2032
Figure 54: Latin America PET Syrup Bottle Market Volume (Units) Analysis by Country, 2017-2032
Figure 55: Latin America PET Syrup Bottle Market Value Share (%) and BPS Analysis by Country, 2022-2032
Figure 56: Latin America PET Syrup Bottle Market Y-o-Y Growth (%) Projections by Country, 2022-2032
Figure 57: Latin America PET Syrup Bottle Market Value (US$ Mn) Analysis by Shape, 2017-2032
Figure 58: Latin America PET Syrup Bottle Market Volume (Units) Analysis by Shape, 2017-2032
Figure 59: Latin America PET Syrup Bottle Market Value Share (%) and BPS Analysis by Shape, 2022-2032
Figure 60: Latin America PET Syrup Bottle Market Y-o-Y Growth (%) Projections by Shape, 2022-2032
Figure 61: Latin America PET Syrup Bottle Market Value (US$ Mn) Analysis by Capacity, 2017-2032
Figure 62: Latin America PET Syrup Bottle Market Volume (Units) Analysis by Capacity, 2017-2032
Figure 63: Latin America PET Syrup Bottle Market Value Share (%) and BPS Analysis by Capacity, 2022-2032
Figure 64: Latin America PET Syrup Bottle Market Y-o-Y Growth (%) Projections by Capacity, 2022-2032
Figure 65: Latin America PET Syrup Bottle Market Value (US$ Mn) Analysis by End Use, 2017-2032
Figure 66: Latin America PET Syrup Bottle Market Volume (Units) Analysis by End Use, 2017-2032
Figure 67: Latin America PET Syrup Bottle Market Value Share (%) and BPS Analysis by End Use, 2022-2032
Figure 68: Latin America PET Syrup Bottle Market Y-o-Y Growth (%) Projections by End Use, 2022-2032
Figure 69: Latin America PET Syrup Bottle Market Attractiveness by Shape, 2022-2032
Figure 70: Latin America PET Syrup Bottle Market Attractiveness by Capacity, 2022-2032
Figure 71: Latin America PET Syrup Bottle Market Attractiveness by End Use, 2022-2032
Figure 72: Latin America PET Syrup Bottle Market Attractiveness by Country, 2022-2032
Figure 73: Europe PET Syrup Bottle Market Value (US$ Mn) by Shape, 2022-2032
Figure 74: Europe PET Syrup Bottle Market Value (US$ Mn) by Capacity, 2022-2032
Figure 75: Europe PET Syrup Bottle Market Value (US$ Mn) by End Use, 2022-2032
Figure 76: Europe PET Syrup Bottle Market Value (US$ Mn) by Country, 2022-2032
Figure 77: Europe PET Syrup Bottle Market Value (US$ Mn) Analysis by Country, 2017-2032
Figure 78: Europe PET Syrup Bottle Market Volume (Units) Analysis by Country, 2017-2032
Figure 79: Europe PET Syrup Bottle Market Value Share (%) and BPS Analysis by Country, 2022-2032
Figure 80: Europe PET Syrup Bottle Market Y-o-Y Growth (%) Projections by Country, 2022-2032
Figure 81: Europe PET Syrup Bottle Market Value (US$ Mn) Analysis by Shape, 2017-2032
Figure 82: Europe PET Syrup Bottle Market Volume (Units) Analysis by Shape, 2017-2032
Figure 83: Europe PET Syrup Bottle Market Value Share (%) and BPS Analysis by Shape, 2022-2032
Figure 84: Europe PET Syrup Bottle Market Y-o-Y Growth (%) Projections by Shape, 2022-2032
Figure 85: Europe PET Syrup Bottle Market Value (US$ Mn) Analysis by Capacity, 2017-2032
Figure 86: Europe PET Syrup Bottle Market Volume (Units) Analysis by Capacity, 2017-2032
Figure 87: Europe PET Syrup Bottle Market Value Share (%) and BPS Analysis by Capacity, 2022-2032
Figure 88: Europe PET Syrup Bottle Market Y-o-Y Growth (%) Projections by Capacity, 2022-2032
Figure 89: Europe PET Syrup Bottle Market Value (US$ Mn) Analysis by End Use, 2017-2032
Figure 90: Europe PET Syrup Bottle Market Volume (Units) Analysis by End Use, 2017-2032
Figure 91: Europe PET Syrup Bottle Market Value Share (%) and BPS Analysis by End Use, 2022-2032
Figure 92: Europe PET Syrup Bottle Market Y-o-Y Growth (%) Projections by End Use, 2022-2032
Figure 93: Europe PET Syrup Bottle Market Attractiveness by Shape, 2022-2032
Figure 94: Europe PET Syrup Bottle Market Attractiveness by Capacity, 2022-2032
Figure 95: Europe PET Syrup Bottle Market Attractiveness by End Use, 2022-2032
Figure 96: Europe PET Syrup Bottle Market Attractiveness by Country, 2022-2032
Figure 97: Asia Pacific PET Syrup Bottle Market Value (US$ Mn) by Shape, 2022-2032
Figure 98: Asia Pacific PET Syrup Bottle Market Value (US$ Mn) by Capacity, 2022-2032
Figure 99: Asia Pacific PET Syrup Bottle Market Value (US$ Mn) by End Use, 2022-2032
Figure 100: Asia Pacific PET Syrup Bottle Market Value (US$ Mn) by Country, 2022-2032
Figure 101: Asia Pacific PET Syrup Bottle Market Value (US$ Mn) Analysis by Country, 2017-2032
Figure 102: Asia Pacific PET Syrup Bottle Market Volume (Units) Analysis by Country, 2017-2032
Figure 103: Asia Pacific PET Syrup Bottle Market Value Share (%) and BPS Analysis by Country, 2022-2032
Figure 104: Asia Pacific PET Syrup Bottle Market Y-o-Y Growth (%) Projections by Country, 2022-2032
Figure 105: Asia Pacific PET Syrup Bottle Market Value (US$ Mn) Analysis by Shape, 2017-2032
Figure 106: Asia Pacific PET Syrup Bottle Market Volume (Units) Analysis by Shape, 2017-2032
Figure 107: Asia Pacific PET Syrup Bottle Market Value Share (%) and BPS Analysis by Shape, 2022-2032
Figure 108: Asia Pacific PET Syrup Bottle Market Y-o-Y Growth (%) Projections by Shape, 2022-2032
Figure 109: Asia Pacific PET Syrup Bottle Market Value (US$ Mn) Analysis by Capacity, 2017-2032
Figure 110: Asia Pacific PET Syrup Bottle Market Volume (Units) Analysis by Capacity, 2017-2032
Figure 111: Asia Pacific PET Syrup Bottle Market Value Share (%) and BPS Analysis by Capacity, 2022-2032
Figure 112: Asia Pacific PET Syrup Bottle Market Y-o-Y Growth (%) Projections by Capacity, 2022-2032
Figure 113: Asia Pacific PET Syrup Bottle Market Value (US$ Mn) Analysis by End Use, 2017-2032
Figure 114: Asia Pacific PET Syrup Bottle Market Volume (Units) Analysis by End Use, 2017-2032
Figure 115: Asia Pacific PET Syrup Bottle Market Value Share (%) and BPS Analysis by End Use, 2022-2032
Figure 116: Asia Pacific PET Syrup Bottle Market Y-o-Y Growth (%) Projections by End Use, 2022-2032
Figure 117: Asia Pacific PET Syrup Bottle Market Attractiveness by Shape, 2022-2032
Figure 118: Asia Pacific PET Syrup Bottle Market Attractiveness by Capacity, 2022-2032
Figure 119: Asia Pacific PET Syrup Bottle Market Attractiveness by End Use, 2022-2032
Figure 120: Asia Pacific PET Syrup Bottle Market Attractiveness by Country, 2022-2032
Figure 121: MEA PET Syrup Bottle Market Value (US$ Mn) by Shape, 2022-2032
Figure 122: MEA PET Syrup Bottle Market Value (US$ Mn) by Capacity, 2022-2032
Figure 123: MEA PET Syrup Bottle Market Value (US$ Mn) by End Use, 2022-2032
Figure 124: MEA PET Syrup Bottle Market Value (US$ Mn) by Country, 2022-2032
Figure 125: MEA PET Syrup Bottle Market Value (US$ Mn) Analysis by Country, 2017-2032
Figure 126: MEA PET Syrup Bottle Market Volume (Units) Analysis by Country, 2017-2032
Figure 127: MEA PET Syrup Bottle Market Value Share (%) and BPS Analysis by Country, 2022-2032
Figure 128: MEA PET Syrup Bottle Market Y-o-Y Growth (%) Projections by Country, 2022-2032
Figure 129: MEA PET Syrup Bottle Market Value (US$ Mn) Analysis by Shape, 2017-2032
Figure 130: MEA PET Syrup Bottle Market Volume (Units) Analysis by Shape, 2017-2032
Figure 131: MEA PET Syrup Bottle Market Value Share (%) and BPS Analysis by Shape, 2022-2032
Figure 132: MEA PET Syrup Bottle Market Y-o-Y Growth (%) Projections by Shape, 2022-2032
Figure 133: MEA PET Syrup Bottle Market Value (US$ Mn) Analysis by Capacity, 2017-2032
Figure 134: MEA PET Syrup Bottle Market Volume (Units) Analysis by Capacity, 2017-2032
Figure 135: MEA PET Syrup Bottle Market Value Share (%) and BPS Analysis by Capacity, 2022-2032
Figure 136: MEA PET Syrup Bottle Market Y-o-Y Growth (%) Projections by Capacity, 2022-2032
Figure 137: MEA PET Syrup Bottle Market Value (US$ Mn) Analysis by End Use, 2017-2032
Figure 138: MEA PET Syrup Bottle Market Volume (Units) Analysis by End Use, 2017-2032
Figure 139: MEA PET Syrup Bottle Market Value Share (%) and BPS Analysis by End Use, 2022-2032
Figure 140: MEA PET Syrup Bottle Market Y-o-Y Growth (%) Projections by End Use, 2022-2032
Figure 141: MEA PET Syrup Bottle Market Attractiveness by Shape, 2022-2032
Figure 142: MEA PET Syrup Bottle Market Attractiveness by Capacity, 2022-2032
Figure 143: MEA PET Syrup Bottle Market Attractiveness by End Use, 2022-2032
Figure 144: MEA PET Syrup Bottle Market Attractiveness by Country, 2022-2032
FMI projects the demand for PET syrup bottle market to expand at rapid value CAGR of 9% to 10 over the forecast period 2022 to 2032
The scleroglucan market is PET syrup bottle by South Asia, and this trend is projected to continue for the assessment period.
Amcor Limited, Gerresheimer AG, All American Containers, Alpha Packaging, PET Power (RPC Group), PontEurope, Berry M&H, Graham Packaging Company, and others are some key PET syrup bottle manufacturer.
Explore Similar Insights
Thank you!
You will receive an email from our Business Development Manager. Please be sure to check your SPAM/JUNK folder too.