This site uses cookies, including third-party cookies, that help us to provide and improve our services.

Privacy Policy
- Global Locations -
Headquarters
Future Market Insights, Inc.
Christiana Corporate, 200 Continental Drive, Suite 401, Newark, Delaware - 19713, United States
T: +1-845-579-5705
MEA
Market Access DMCC

1602-6 Jumeirah Bay X2 Tower, Plot No: JLT-PH2-X2A,

Jumeirah Lakes Towers, Dubai,

United Arab Emirates

Americas
Future Market Insights
616 Corporate Way, Suite 2-9018,
Valley Cottage, NY 10989,
United States
T: +1-347-918-3531
Europe
Future Market Insights
3rd Floor, 207 Regent Street,
London W1B 3HH
United Kingdom
T: + 44 (0) 20 8123 9659
D: +44 (0) 20 3287 4268
APAC
Future Market Insights
Office No. 401-A, 4th Floor,
VANTAGE 9, S.No. 36/1/1,
Baner, Pune 411045 India

Beverage Packaging Market

Digitally Printed Beverage Packaging Material offering a plethora of Expansion Opportunities

Beverage Packaging Market By Product Type, by Material, by Application Region | Forecast 2022 to 2032

Beverage Packaging Market Outlook (2022 to 2032)

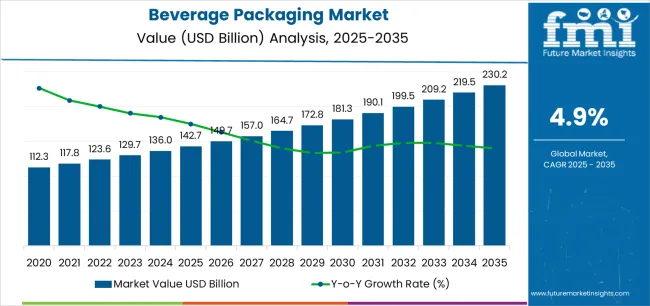
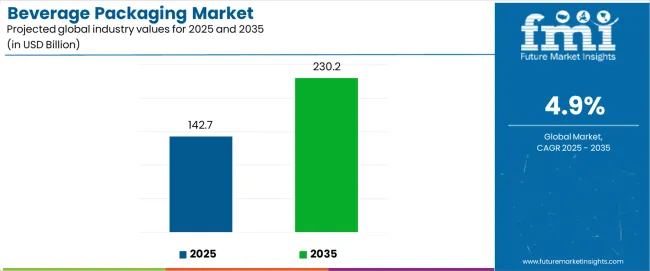
The global beverage packaging market is expected to secure US$ 156.7 Billion in 2032 while expanding at a CAGR of 4.1%. The market is likely to hold a value of US$ 104.8 Billion in 2022. As the market develops, eco-friendly packaging initiatives are being implemented along with various technological innovations in the field of beverage packaging in order to meet the growing consumer demand.

Packaging plays a significant role in the beverage industry. By utilizing advanced decorative techniques and communicating the brand of the company, packaging goes beyond simply protecting and increasing the shelf life of the product. Digital printing has become one of the most popular methods of producing beverage packaging in recent years.

According to the study conducted by FMI, beverage packaging sales will rise 1.3 times from base year value over the forecast period, generating lucrative investment opportunities for the manufacturers. A large share of 37.3% of the global beverage packaging market is expected to come from the Asia Pacific region by 2022.

To enhance the sales of beverage packaging, beverage brands develop a wide range of beverage products to cater to a wide range of consumers. A consumer's decision is heavily influenced by the packaging. A well-designed and efficient packaging system is crucial for the beverage industry in order to ensure that the product is protected during shipping, storing, distributing, and final packaging. This method also ensures that the product retains its quality, freshness, taste, and appearance. Furthermore, the implementation of this system reduces the need for recalls and hazards as well as the traceability of foods.

The beverage packaging industry continues to undergo rapid changes due to consumer demand for lightweight, convenient, and sustainable packaging solutions in the market. Innovations in technology as well as the emergence of new packaging materials drive the beverage packaging market to grow at a rapid pace.

Data Points

Key Statistics

Expected Base Year Value (2022)

US$ 104.8 Billion

Anticipated Forecast Value (2032)

US$ 156.7 Billion

Estimated Growth (2022 to 2032)

4.1% CAGR

Collective Value Share: Top 3 Countries (2022E)

42%

Customize this Report

Let us know your requirement to get
100% FREE customization

What are the Key Factors Contributing to the Beverage Packaging Market Growth?

Customers are more likely to remain loyal when their needs are customized. Depending on the size, texture, color, and design of the beverage packaging, the packaging solutions can be customized. Adding a personal touch to the product adds value to the consumer's experience, strengthens the brand, and helps the consumer learn more about the product. Brands can stand out from their competitors by customizing their products.

Health and hygiene are becoming increasingly important to consumers, so they seek packaging solutions that are both reliable and safe in the market. A variety of container types are used to package beverages, including cans, bottles, and liquid cartons. Both alcoholic and non-alcoholic beverages can be packaged with these solutions. A variety of materials are used for beverage packaging solutions, including plastic, glass, cardboard, and metal.

In the beverage industry, smart technologies are bringing a new era of digitalization to the industry. Consumers can have the convenience of mobile scanning QR codes, smart labels, and other information on beverage packaging embedded directly into the package, which provides more security and convenience for consumers. Manufacturers are introducing new technologies that enhance the consumer experience, contributing to the growth of the beverage packaging market.

A more affluent population and rising per capita incomes, especially in emerging economies, encourage the development of better and more convenient packaging technologies in the market. Further research is underway to determine if recycled plastics may replace virgin plastics in beverage containers. In turn, this will encourage beverage packaging companies to reduce polymer procurement costs while maintaining environmental stability.

Which Factors are the Limiting the Growth of the Global Beverage Packaging Market?

A major problem with packaging is its inability to decompose in a timely manner, which is further leading governments around the world to take governmental actions to address this issue. Strict laws are being imposed on the beverage packing industry to address this issue, further hampering the growth of the market. Taking into account the health and environmental issues associated with the use of synthetic polymers, consumers are demanding sustainable solutions for beverage packaging. Using their available resources, beverage packaging companies strive to ensure that the product is of high quality and safe, but sustainability increases production costs and therefore affects profitability. Increasing the cost of packaging might have a negative impact on the sale of products in the future.

There has been an increasing trend among consumers to search for products made from materials that are more economical, such as metals, glass, and packaging for food and beverages. Several countries are introducing heavier regulations on plastic bans that are forcing brands to shift away from plastics, especially those that are single-use, leading to an increase in prices for consumers and their products. These factors will contribute to the growth of the global beverage packaging market.

Ismail Sutaria
Ismail Sutaria
Principal Consultant
LinkedIn
Talk to Analyst

Find your sweet spots for generating winning opportunities in this market.

Talk to Analyst

Country-wise Insights

How are Health Wellness and Sustainable Packaging shaping the North American Beverage Packaging Landscape?

According to forecasts, North America's beverage packaging market will grow by 3.7% CAGR during the forecast period. FMI estimates that the USA will hold 83% of North American sales until 2032. According to the American Beverage Association, beverage manufacturers are collaborating to make all plastic bottles 100% recyclable and to integrate more PET into these bottles.

PepsiCo, Keurig Dr. Pepper, and Coca-Cola strive to recycle 100% of their beverage plastic packaging across this region. Sustainable beverage companies are more likely to attract USA consumers willing to spend additional money on their beverages. The consumer's preferences are shifting towards healthier drinks with clean labels, naturally sweetened beverages, and immunity-boosting drinks. All these factors are significantly adding to the growth of the market.

It is predicted that the demand for non-alcoholic, healthier drinks will grow in the USA over the next several years as consumers seek portable drinks with low sugar and better nutrient content and on-the-go beverages in the market. With the rise of disposable income and the trend for flavored beverages, there has been an increase in the demand for alcoholic and non-alcoholic beverages in the market. In response to the growing need for bioplastics and environmentally friendly packaging, bio-based alternatives are growing in popularity and helping to reduce the country's dependence on petroleum-based products. The beverage packaging market is on the rise.

Expanding Distribution Channels in the Asia Pacific Helps Increase Beverage Packaging Sales?

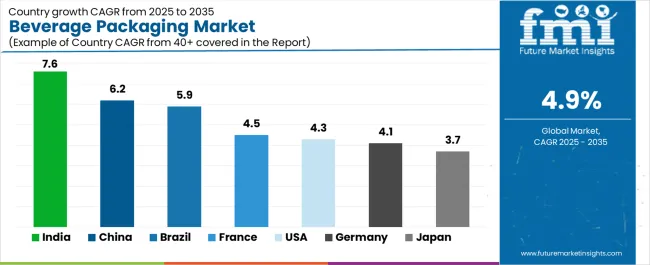
Asia Pacific region is expected to hold the largest beverage packaging market. The increasing demand for local and branded beverages in these regions has contributed to market growth in the beverage packaging industry. Among the countries in this region, India and China have accounted for a large part of the growth of the beverage packaging market.

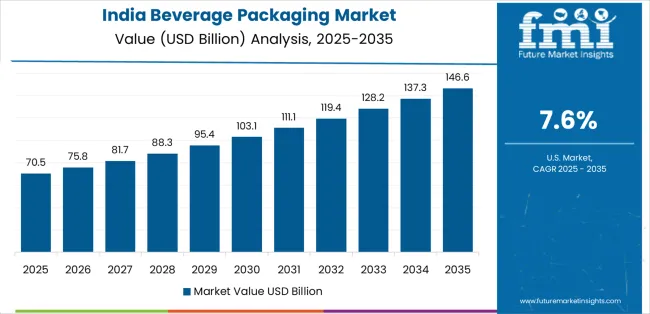
According to the forecast, the Chinese market will grow by 1.4x over the forecast period. In India, the beverage packaging market is expected to grow at a compound annual growth rate of 5.6% over the forecast period. The Indian Beverages Association states that the Indian beverage industry will continue to grow in part because the demand for bioplastics and PET bottle packaging in India will grow as environmentally friendly alternatives and recycling facilities are introduced to the market.

A growing upper middle-class population with increasing purchasing power, rapid urbanization, shifting consumer preferences, as well as an increase in e-commerce will fuel an increase in alcoholic beverage consumption in India. Increasing health consciousness and a desire for wellness among consumers contribute to the growth of premium sports drinks in the market. Increasing access to branded juices and health drinks and a trend toward healthier production consumption will further fuel the market for the beverage packaging market. Globalization will have a positive impact on the Indian food and beverage industry, which will lead to an increase in non-alcoholic beverage consumption.

Category-wise Insights

Which is the Most Dominant Beverage Packaging Product Segment in the Market?

According to the forecast, liquid cartons are expected to hold a market share of 35.5% in the global beverage packaging market by 2032. It is estimated that the liquid carton segment will reach a value of US$ 45.5 Billion by 2032. Drinks that need to remain fresh for a long period of time are often packed in liquid cartons. It ensures the safety of transporting beverages and maintains their nutritional value, quality, and freshness. Liquid cartons will continue to dominate the beverage packaging market as customers prefer safe and reliable packaging solutions in the market.

Various analyses have revealed that the increased demand for dairy beverages in various regions, as well as the high consumption of carton milk, have stimulated the market demand for liquid cartons in the market. Due to the increasing adoption of eco-friendly and relatively light packaging in the beverage industry, the market for liquid beverage packaging is expected to grow in the near future.

Which Application is Likely to Experience Significant Growth for Global Beverage Packaging?

Non-alcoholic drinks are expected to grow at a CAGR of nearly 5.0% from 2022 to 2032, with a market share of 56.8% at the end of 2032. Because of the COVID-19 pandemic, consumers are adopting a healthier lifestyle and taking better care of themselves, which will lead to an increase in demand for non-alcoholic beverages in the market.

PET bottles, stainless steel cans, and other preferred materials for energy drinks, carbonated drinks, juices, and others, are driving the demand for these products. A surge in the working population will push the market to grow as a result of the increasing market demand for RTD beverages and a busy schedule and an active lifestyle will favor its growth in the market.

MarketNage
Become a MarketNgage Insider

A unified Market Research Subscription Platform, built for today's disparate research needs.

What Role do Start-ups Play in the Beverage Packaging Business?

Start-up beverage companies are focused on offering consumers products that are easy to handle, environmentally friendly, and keep their products fresh for long periods of time. An increasing trend of start-ups innovating their packaging by making the package smaller and more situational, as well as multi-packs of beverage products. The product is packed in different ways depending on the type of beverage it contains and the type of packaging material used.

  • Bonito Packaging was founded in 2013 in Dongguan, China. Packaging manufacturer Bonito Packaging manufactures products for a variety of industries, including beverage, medical, industrial, and electronic.
  • TIPA was founded in 2010 in Hod Hasharon, Israel. This company provides sustainable packaging solutions that are both biodegradable and recyclable. A range of products has been developed, including snacks and frozen foods, which are biodegradable and recyclable. A multilayered peel covering orange segments is used as a packaging solution. In industrial compost, its packaging will biologically degrade in 180 days due to its resistance to oxygen and water vapor permeation.
  • Green Creative was founded in 2010, in Sucy-en-brie, France. Technology systems are developed by Green Creative for the management of waste. The company manufactures products that dispose of waste, including FLEXIDRY, a machine that separates organics from packaging in waste to be used as fertilizer or biogas plant feed, as well as R3D3, a connected garbage bin that separates beverage containers into compartments and alerts a central location when full.

Competition Analysis

Key players in the global inositol market include Crown Holdings, Inc., Ardagh Group S.A., Ball Corporation, Gerresheimer AG, Berry Global Inc., Beatson Clark Ltd., Tetra Pak Group, Owens-Illinois, Inc., Toyo Seikan Group Holdings, Ltd., Silgan Containers LLC, Vidrala S.A., Nampak Ltd., BA Glass Germany GmbH, Orora Packaging Australia Pty Ltd., Frugal Limited, Green Creative, TIPA, and Bonito Packaging.

  • In September 2022, a $530 million deal was completed between Ball Corp and Arnest Group for the beverage packaging business in Russia. Immediately following Russia's invasion of Ukraine in March, the sustainable metal packaging maker scaled back its five Russian production facilities. As a result of the sale, Ball's business outside of Russia will remain unaffected by the sale of its Russian-based operations to Arnest Group, which manufactures perfume, cosmetics, and household products in aerosol packaging.
  • In October 2022, Myers Industries, Inc., one of the world's leading innovators of engineered plastics solutions, will participate in the exhibition at Pack Expo in Chicago, Illinois, from October 23-26, 2022. As well as reusable packaging bin-matched shelving, attendees will have the opportunity to assess the quality of Intermediate Bulk Containers (IBC) and high-value storage and handling containers.

Report Scope

Report Attribute

Details

Growth Rate

CAGR of 4.1% from 2022 to 2032

Market Value in 2022

US$ 1104.8 Billion

Market Value in 2032

US$ 156.7 Billion

Base Year for Estimates

2021

Historical Data

2016 to 2021

Forecast Period

2022 to 2032

Quantitative Units

Revenue in US$ Million and CAGR from 2022 to 2032

Report Coverage

Revenue Forecast, Company Ranking, Competitive Landscape, Growth Factors, Trends, and Pricing Analysis

Segments Covered

  • Product Type
  • Material
  • Application
  • Region

Regions Covered

  • North America
  • Latin America
  • Western Europe
  • Eastern Europe
  • Asia Pacific Excluding Japan
  • Japan
  • Middle East & Africa

Key Countries Profiled

  • USA
  • Canada
  • China
  • India
  • ASIAN
  • Australia & New Zealand
  • Germany
  • Italy
  • France
  • Spain
  • United Kingdom
  • Nordics
  • BENELUX
  • Russia
  • Poland
  • Brazil
  • Mexico
  • Argentina
  • GCC Countries
  • South Africa

Key Companies Profiled

  • Crown Holdings Inc.
  • Amcor Limited
  • Ardagh Group S.A
  • Ball Corporation
  • Gerresheimer AG
  • Owens-Illinois Inc.
  • Berry Global Inc.
  • Beatson Clark Ltd.
  • Intrapac International Corporation
  • BA Glass Germany GmbH
  • Nampak Ltd.
  • Vidrala S.A
  • Silgan Containers LLC
  • Orora Packaging Australia Pty Ltd.
  • Mahmood Saeed Beverage Cans & Ends Industry Company Ltd.

Report Customization & Pricing

Available upon Request

Key Segments Profiled in the Global Beverage Packaging Market

Beverage Packaging Market by Product Type:

  • Liquid Cartons
  • Beverage Cans
  • Glass Bottles
  • Plastic Bottles
  • Others

Beverage Packaging Market by Material:

  • Glass
  • Plastic
    • HDPE
    • LDPE
    • PET
    • PP
  • Metal
  • Paper/Paperboard

Beverage Packaging Market by Application:

  • Beverage Packaging for Alcoholic Drinks
    • Beer
    • Wine
    • Spirits
    • Other Alcoholic Beverages
  • Beverage Packaging for Non-Alcoholic Drinks
    • Fruit Juices
    • Carbonated Drinks/Soda
    • RTD Beverages
    • Bottled Water
    • Tea & Coffee
    • Milk Products
    • Others

Beverage Packaging Market by Region:

  • North America Beverage Packaging Market
  • Latin America Beverage Packaging Market
  • Western Europe Beverage Packaging Market
  • Eastern Europe Beverage Packaging Market
  • Middle East and Africa Beverage Packaging Market
  • APEJ Beverage Packaging Market
  • Japan Beverage Packaging Market

Frequently Asked Questions

It is anticipated that the beverage packaging market will reach US$ 104.8 billion by 2022.

According to FMI, beverage packaging will expand at a CAGR of 4.1% from 2022 to 2032.

Beverage packaging is consistently in high demand in the United States, India, China, Japan, and Germany.

A value market share of 54.6% will be held by non-alcoholic beverages in 2022 in the beverage packaging market.

It is expected that North America will hold a 16.6% share of the global beverage packaging market by 2022.

The top five companies operating in the beverage packaging market are Ball Corporation, Crown Holdings, Inc., Owens-Illinois, Inc., Ardagh Group S.A., and Orora Packaging Australia Pty Ltd.

Table of Content

1. Executive Summary | Beverage Packaging Market

    1.1. Market Overview

    1.2. FMI Analysis and Recommendations

    1.3. Wheel of Opportunity

2. Market Introduction

    2.1. Market Definition

    2.2. Market Taxonomy

3. Market Viewpoint

    3.1. Porter’s Five Force Analysis

    3.2. Global Packaging Industry Outlook

    3.3. Market Dynamics

        3.3.1. Drivers

        3.3.2. Restraints

        3.3.3. Trends

        3.3.4. Opportunities

4. Global Market Analysis By Region

    4.1. Introduction

    4.2. Historical Market Size (US$ Million) and Volume (Tonnes) Analysis 2017 to 2021 By Region

        4.2.1. North America

        4.2.2. Asia Pacific Excluding Japan

        4.2.3. Western Europe

        4.2.4. Eastern Europe

        4.2.5. Latin America

        4.2.6. Middle East and Africa

        4.2.7. Japan

    4.3. Current Market Size (US$ Million) and Volume (Tonnes) Forecast 2022 to 2032 By Region

        4.3.1. North America

        4.3.2. Asia Pacific Excluding Japan

        4.3.3. Western Europe

        4.3.4. Eastern Europe

        4.3.5. Latin America

        4.3.6. Middle East and Africa

        4.3.7. Japan

    4.4. Market Attractiveness Analysis By Region

5. Global Market Analysis By Product Type

    5.1. Introduction

    5.2. Historical Market Size (US$ Million) and Volume (Million Units) Analysis 2017 to 2021 By Product Type

        5.2.1. Liquid Cartons

        5.2.2. Beverage Cans

        5.2.3. Glass Bottles

        5.2.4. Plastic Bottles

        5.2.5. Others

    5.3. Current Market Size (US$ Million) and Volume (Million Units) Forecast 2022 to 2032 By Product Type

        5.3.1. Liquid Cartons

        5.3.2. Beverage Cans

        5.3.3. Glass Bottles

        5.3.4. Plastic Bottles

        5.3.5. Others

    5.4. Market Attractiveness Analysis By Product Type

6. Global Market Analysis By Material Type

    6.1. Introduction

    6.2. Historical Market Size (US$ Million) and Volume (Tonnes) Analysis 2017 to 2021 By Material Type

        6.2.1. Glass

        6.2.2. Plastic

            6.2.2.1. HDPE

            6.2.2.2. LDPE

            6.2.2.3. PET

            6.2.2.4. PP

        6.2.3. Metal

        6.2.4. Paper/Paperboard

    6.3. Current Market Size (US$ Million) and Volume (Tonnes) Forecast 2022 to 2032 By Material Type

        6.3.1. Glass

        6.3.2. Plastic

            6.3.2.1. HDPE

            6.3.2.2. LDPE

            6.3.2.3. PET

            6.3.2.4. PP

        6.3.3. Metal

        6.3.4. Paper/Paperboard

    6.4. Market Attractiveness Analysis By Material

7. Global Market Analysis By Application

    7.1. Introduction

    7.2. Historical Market Size (US$ Million) and Volume (Tonnes) Analysis 2017 to 2021 By Application

        7.2.1. Alcoholic Drinks

            7.2.1.1. Beer

            7.2.1.2. Wine

            7.2.1.3. Spirits

            7.2.1.4. Others

        7.2.2. Non-Alcoholic

            7.2.2.1. Fruit Juice

            7.2.2.2. Carbonated/Soda

            7.2.2.3. RTD Beverages

            7.2.2.4. Bottled Water

            7.2.2.5. Tea & Coffee

            7.2.2.6. Milk Products

    7.3. Current Market Size (US$ Million) and Volume (Tonnes) Forecast 2022 to 2032 By Application

        7.3.1. Alcoholic Drinks

            7.3.1.1. Beer

            7.3.1.2. Wine

            7.3.1.3. Spirits

            7.3.1.4. Others

        7.3.2. Non-Alcoholic

            7.3.2.1. Fruit Juice

            7.3.2.2. Carbonated/Soda

            7.3.2.3. RTD Beverages

            7.3.2.4. Bottled Water

            7.3.2.5. Tea & Coffee

            7.3.2.6. Milk Products

    7.4. Market Attractiveness Analysis By Application

8. North America Market Analysis

    8.1. Introduction

    8.2. Historical Market Size (US$ Million) and Volume (Tonnes) Analysis 2017 to 2021 By Country

        8.2.1. USA

        8.2.2. Canada

    8.3. Current Market Size (US$ Million) and Volume (Tonnes) Forecast 2022 to 2032 By Country

        8.3.1. USA

        8.3.2. Canada

    8.4. Historical Market Size (US$ Million) and Volume (Million Units) Analysis 2017 to 2021 By Product Type

        8.4.1. Liquid Cartons

        8.4.2. Beverage Cans

        8.4.3. Glass Bottles

        8.4.4. Plastic Bottles

        8.4.5. Others

    8.5. Current Market Size (US$ Million) and Volume (Million Units) Forecast 2022 to 2032 By Product Type

        8.5.1. Liquid Cartons

        8.5.2. Beverage Cans

        8.5.3. Glass Bottles

        8.5.4. Plastic Bottles

        8.5.5. Others

    8.6. Historical Market Size (US$ Million) and Volume (Tonnes) Analysis 2017 to 2021 By Material Type

        8.6.1. Glass

        8.6.2. Plastic

            8.6.2.1. HDPE

            8.6.2.2. LDPE

            8.6.2.3. PET

            8.6.2.4. PP

        8.6.3. Metal

        8.6.4. Paper/Paperboard

    8.7. Current Market Size (US$ Million) and Volume (Tonnes) Forecast 2022 to 2032 By Material Type

        8.7.1. Glass

        8.7.2. Plastic

            8.7.2.1. HDPE

            8.7.2.2. LDPE

            8.7.2.3. PET

            8.7.2.4. PP

        8.7.3. Metal

        8.7.4. Paper/Paperboard

    8.8. Historical Market Size (US$ Million) and Volume (Tonnes) Analysis 2017 to 2021 By Application

        8.8.1. Alcoholic Drinks

            8.8.1.1. Beer

            8.8.1.2. Wine

            8.8.1.3. Spirits

            8.8.1.4. Others

        8.8.2. Non-Alcoholic

            8.8.2.1. Fruit Juice

            8.8.2.2. Carbonated/Soda

            8.8.2.3. RTD Beverages

            8.8.2.4. Bottled Water

            8.8.2.5. Tea & Coffee

            8.8.2.6. Milk Products

    8.9. Current Market Size (US$ Million) and Volume (Tonnes) Forecast 2022 to 2032 By Application

        8.9.1. Alcoholic Drinks

            8.9.1.1. Beer

            8.9.1.2. Wine

            8.9.1.3. Spirits

            8.9.1.4. Others

        8.9.2. Non-Alcoholic

            8.9.2.1. Fruit Juice

            8.9.2.2. Carbonated/Soda

            8.9.2.3. RTD Beverages

            8.9.2.4. Bottled Water

            8.9.2.5. Tea & Coffee

            8.9.2.6. Milk Products

    8.10. Pricing Analysis

9. Asia Pacific Excluding Japan (APEJ) Market Analysis

    9.1. Introduction

    9.2. Historical Market Size (US$ Million) and Volume (Tonnes) Analysis 2017 to 2021 By Country

        9.2.1. China

        9.2.2. India

        9.2.3. ASEAN

        9.2.4. Australia and New Zealand

        9.2.5. Rest of Asia Pacific Excluding Japan

    9.3. Current Market Size (US$ Million) and Volume (Tonnes) Forecast 2022 to 2032 By Country

        9.3.1. China

        9.3.2. India

        9.3.3. ASEAN

        9.3.4. Australia and New Zealand

        9.3.5. Rest of Asia Pacific Excluding Japan

    9.4. Historical Market Size (US$ Million) and Volume (Million Units) Analysis 2017 to 2021 By Product Type

        9.4.1. Liquid Cartons

        9.4.2. Beverage Cans

        9.4.3. Glass Bottles

        9.4.4. Plastic Bottles

        9.4.5. Others

    9.5. Current Market Size (US$ Million) and Volume (Million Units) Forecast 2022 to 2032 By Product Type

        9.5.1. Liquid Cartons

        9.5.2. Beverage Cans

        9.5.3. Glass Bottles

        9.5.4. Plastic Bottles

        9.5.5. Others

    9.6. Historical Market Size (US$ Million) and Volume (Tonnes) Analysis 2017 to 2021 By Material Type

        9.6.1. Glass

        9.6.2. Plastic

            9.6.2.1. HDPE

            9.6.2.2. LDPE

            9.6.2.3. PET

            9.6.2.4. PP

        9.6.3. Metal

        9.6.4. Paper/Paperboard

    9.7. Current Market Size (US$ Million) and Volume (Tonnes) Forecast 2022 to 2032 By Material Type

        9.7.1. Glass

        9.7.2. Plastic

            9.7.2.1. HDPE

            9.7.2.2. LDPE

            9.7.2.3. PET

            9.7.2.4. PP

        9.7.3. Metal

        9.7.4. Paper/Paperboard

    9.8. Historical Market Size (US$ Million) and Volume (Tonnes) Analysis 2017 to 2021 By Application

        9.8.1. Alcoholic Drinks

            9.8.1.1. Beer

            9.8.1.2. Wine

            9.8.1.3. Spirits

            9.8.1.4. Others

        9.8.2. Non-Alcoholic

            9.8.2.1. Fruit Juice

            9.8.2.2. Carbonated/Soda

            9.8.2.3. RTD Beverages

            9.8.2.4. Bottled Water

            9.8.2.5. Tea & Coffee

            9.8.2.6. Milk Products

    9.9. Current Market Size (US$ Million) and Volume (Tonnes) Forecast 2022 to 2032 By Application

        9.9.1. Alcoholic Drinks

            9.9.1.1. Beer

            9.9.1.2. Wine

            9.9.1.3. Spirits

            9.9.1.4. Others

        9.9.2. Non-Alcoholic

            9.9.2.1. Fruit Juice

            9.9.2.2. Carbonated/Soda

            9.9.2.3. RTD Beverages

            9.9.2.4. Bottled Water

            9.9.2.5. Tea & Coffee

            9.9.2.6. Milk Products

    9.10. Pricing Analysis

10. Western Europe Market Analysis

    10.1. Introduction

    10.2. Historical Market Size (US$ Million) and Volume (Tonnes) Analysis 2017 to 2021 By Country

        10.2.1. Germany

        10.2.2. Italy

        10.2.3. France

        10.2.4. Spain

        10.2.5. Nordic

        10.2.6. United Kingdom

        10.2.7. BENELUX

        10.2.8. Rest of Western Europe

    10.3. Current Market Size (US$ Million) and Volume (Tonnes) Forecast 2022 to 2032 By Country

        10.3.1. Germany

        10.3.2. Italy

        10.3.3. France

        10.3.4. Spain

        10.3.5. Nordic

        10.3.6. United Kingdom

        10.3.7. BENELUX

        10.3.8. Rest of Western Europe

    10.4. Historical Market Size (US$ Million) and Volume (Million Units) Analysis 2017 to 2021 By Product Type

        10.4.1. Liquid Cartons

        10.4.2. Beverage Cans

        10.4.3. Glass Bottles

        10.4.4. Plastic Bottles

        10.4.5. Others

    10.5. Current Market Size (US$ Million) and Volume (Million Units) Forecast 2022 to 2032 By Product Type

        10.5.1. Liquid Cartons

        10.5.2. Beverage Cans

        10.5.3. Glass Bottles

        10.5.4. Plastic Bottles

        10.5.5. Others

    10.6. Historical Market Size (US$ Million) and Volume (Tonnes) Analysis 2017 to 2021 By Material Type

        10.6.1. Glass

        10.6.2. Plastic

            10.6.2.1. HDPE

            10.6.2.2. LDPE

            10.6.2.3. PET

            10.6.2.4. PP

        10.6.3. Metal

        10.6.4. Paper/Paperboard

    10.7. Current Market Size (US$ Million) and Volume (Tonnes) Forecast 2022 to 2032 By Material Type

        10.7.1. Glass

        10.7.2. Plastic

            10.7.2.1. HDPE

            10.7.2.2. LDPE

            10.7.2.3. PET

            10.7.2.4. PP

        10.7.3. Metal

        10.7.4. Paper/Paperboard

    10.8. Historical Market Size (US$ Million) and Volume (Tonnes) Analysis 2017 to 2021 By Application

        10.8.1. Alcoholic Drinks

            10.8.1.1. Beer

            10.8.1.2. Wine

            10.8.1.3. Spirits

            10.8.1.4. Others

        10.8.2. Non-Alcoholic

            10.8.2.1. Fruit Juice

            10.8.2.2. Carbonated/Soda

            10.8.2.3. RTD Beverages

            10.8.2.4. Bottled Water

            10.8.2.5. Tea & Coffee

            10.8.2.6. Milk Products

    10.9. Current Market Size (US$ Million) and Volume (Tonnes) Forecast 2022 to 2032 By Application

        10.9.1. Alcoholic Drinks

            10.9.1.1. Beer

            10.9.1.2. Wine

            10.9.1.3. Spirits

            10.9.1.4. Others

        10.9.2. Non-Alcoholic

            10.9.2.1. Fruit Juice

            10.9.2.2. Carbonated/Soda

            10.9.2.3. RTD Beverages

            10.9.2.4. Bottled Water

            10.9.2.5. Tea & Coffee

            10.9.2.6. Milk Products

    10.10. Pricing Analysis

11. Eastern Europe Market Analysis

    11.1. Introduction

    11.2. Historical Market Size (US$ Million) and Volume (Tonnes) Analysis 2017 to 2021 By Country

        11.2.1. Russia

        11.2.2. Poland

        11.2.3. Rest of Eastern Europe

    11.3. Current Market Size (US$ Million) and Volume (Tonnes) Forecast 2022 to 2032 By Country

        11.3.1. Russia

        11.3.2. Poland

        11.3.3. Rest of Eastern Europe

    11.4. Historical Market Size (US$ Million) and Volume (Million Units) Analysis 2017 to 2021 By Product Type

        11.4.1. Liquid Cartons

        11.4.2. Beverage Cans

        11.4.3. Glass Bottles

        11.4.4. Plastic Bottles

        11.4.5. Others

    11.5. Current Market Size (US$ Million) and Volume (Million Units) Forecast 2022 to 2032 By Product Type

        11.5.1. Liquid Cartons

        11.5.2. Beverage Cans

        11.5.3. Glass Bottles

        11.5.4. Plastic Bottles

        11.5.5. Others

    11.6. Historical Market Size (US$ Million) and Volume (Tonnes) Analysis 2017 to 2021 By Material Type

        11.6.1. Glass

        11.6.2. Plastic

            11.6.2.1. HDPE

            11.6.2.2. LDPE

            11.6.2.3. PET

            11.6.2.4. PP

        11.6.3. Metal

        11.6.4. Paper/Paperboard

    11.7. Current Market Size (US$ Million) and Volume (Tonnes) Forecast 2022 to 2032 By Material Type

        11.7.1. Glass

        11.7.2. Plastic

            11.7.2.1. HDPE

            11.7.2.2. LDPE

            11.7.2.3. PET

            11.7.2.4. PP

        11.7.3. Metal

        11.7.4. Paper/Paperboard

    11.8. Historical Market Size (US$ Million) and Volume (Tonnes) Analysis 2017 to 2021 By Application

        11.8.1. Alcoholic Drinks

            11.8.1.1. Beer

            11.8.1.2. Wine

            11.8.1.3. Spirits

            11.8.1.4. Others

        11.8.2. Non-Alcoholic

            11.8.2.1. Fruit Juice

            11.8.2.2. Carbonated/Soda

            11.8.2.3. RTD Beverages

            11.8.2.4. Bottled Water

            11.8.2.5. Tea & Coffee

            11.8.2.6. Milk Products

    11.9. Current Market Size (US$ Million) and Volume (Tonnes) Forecast 2022 to 2032 By Application

        11.9.1. Alcoholic Drinks

            11.9.1.1. Beer

            11.9.1.2. Wine

            11.9.1.3. Spirits

            11.9.1.4. Others

        11.9.2. Non-Alcoholic

            11.9.2.1. Fruit Juice

            11.9.2.2. Carbonated/Soda

            11.9.2.3. RTD Beverages

            11.9.2.4. Bottled Water

            11.9.2.5. Tea & Coffee

            11.9.2.6. Milk Products

    11.10. Pricing Analysis

12. Latin America Market Analysis

    12.1. Introduction

    12.2. Historical Market Size (US$ Million) and Volume (Tonnes) Analysis 2017 to 2021 By Country

        12.2.1. Brazil

        12.2.2. Mexico

        12.2.3. Argentina

        12.2.4. Rest of Latin America

    12.3. Current Market Size (US$ Million) and Volume (Tonnes) Forecast 2022 to 2032 By Country

        12.3.1. Brazil

        12.3.2. Mexico

        12.3.3. Argentina

        12.3.4. Rest of Latin America

    12.4. Historical Market Size (US$ Million) and Volume (Million Units) Analysis 2017 to 2021 By Product Type

        12.4.1. Liquid Cartons

        12.4.2. Beverage Cans

        12.4.3. Glass Bottles

        12.4.4. Plastic Bottles

        12.4.5. Others

    12.5. Current Market Size (US$ Million) and Volume (Million Units) Forecast 2022 to 2032 By Product Type

        12.5.1. Liquid Cartons

        12.5.2. Beverage Cans

        12.5.3. Glass Bottles

        12.5.4. Plastic Bottles

        12.5.5. Others

    12.6. Historical Market Size (US$ Million) and Volume (Tonnes) Analysis 2017 to 2021 By Material Type

        12.6.1. Glass

        12.6.2. Plastic

            12.6.2.1. HDPE

            12.6.2.2. LDPE

            12.6.2.3. PET

            12.6.2.4. PP

        12.6.3. Metal

        12.6.4. Paper/Paperboard

    12.7. Current Market Size (US$ Million) and Volume (Tonnes) Forecast 2022 to 2032 By Material Type

        12.7.1. Glass

        12.7.2. Plastic

            12.7.2.1. HDPE

            12.7.2.2. LDPE

            12.7.2.3. PET

            12.7.2.4. PP

        12.7.3. Metal

        12.7.4. Paper/Paperboard

    12.8. Historical Market Size (US$ Million) and Volume (Tonnes) Analysis 2017 to 2021 By Application

        12.8.1. Alcoholic Drinks

            12.8.1.1. Beer

            12.8.1.2. Wine

            12.8.1.3. Spirits

            12.8.1.4. Others

        12.8.2. Non-Alcoholic

            12.8.2.1. Fruit Juice

            12.8.2.2. Carbonated/Soda

            12.8.2.3. RTD Beverages

            12.8.2.4. Bottled Water

            12.8.2.5. Tea & Coffee

            12.8.2.6. Milk Products

    12.9. Current Market Size (US$ Million) and Volume (Tonnes) Forecast 2022 to 2032 By Application

        12.9.1. Alcoholic Drinks

            12.9.1.1. Beer

            12.9.1.2. Wine

            12.9.1.3. Spirits

            12.9.1.4. Others

        12.9.2. Non-Alcoholic

            12.9.2.1. Fruit Juice

            12.9.2.2. Carbonated/Soda

            12.9.2.3. RTD Beverages

            12.9.2.4. Bottled Water

            12.9.2.5. Tea & Coffee

            12.9.2.6. Milk Products

    12.10. Pricing Analysis

13. Middle East and Africa Market Analysis

    13.1. Introduction

    13.2. Historical Market Size (US$ Million) and Volume (Tonnes) Analysis 2017 to 2021 By Country

        13.2.1. North Africa

        13.2.2. GCC Countries

        13.2.3. South Africa

        13.2.4. Rest of Middle East and Africa

    13.3. Current Market Size (US$ Million) and Volume (Tonnes) Forecast 2022 to 2032 By Country

        13.3.1. North Africa

        13.3.2. GCC Countries

        13.3.3. South Africa

        13.3.4. Rest of Middle East and Africa

    13.4. Historical Market Size (US$ Million) and Volume (Million Units) Analysis 2017 to 2021 By Product Type

        13.4.1. Liquid Cartons

        13.4.2. Beverage Cans

        13.4.3. Glass Bottles

        13.4.4. Plastic Bottles

        13.4.5. Others

    13.5. Current Market Size (US$ Million) and Volume (Million Units) Forecast 2022 to 2032 By Product Type

        13.5.1. Liquid Cartons

        13.5.2. Beverage Cans

        13.5.3. Glass Bottles

        13.5.4. Plastic Bottles

        13.5.5. Others

    13.6. Historical Market Size (US$ Million) and Volume (Tonnes) Analysis 2017 to 2021 By Material Type

        13.6.1. Glass

        13.6.2. Plastic

            13.6.2.1. HDPE

            13.6.2.2. LDPE

            13.6.2.3. PET

            13.6.2.4. PP

        13.6.3. Metal

        13.6.4. Paper/Paperboard

    13.7. Current Market Size (US$ Million) and Volume (Tonnes) Forecast 2022 to 2032 By Material Type

        13.7.1. Glass

        13.7.2. Plastic

            13.7.2.1. HDPE

            13.7.2.2. LDPE

            13.7.2.3. PET

            13.7.2.4. PP

        13.7.3. Metal

        13.7.4. Paper/Paperboard

    13.8. Historical Market Size (US$ Million) and Volume (Tonnes) Analysis 2017 to 2021 By Application

        13.8.1. Alcoholic Drinks

            13.8.1.1. Beer

            13.8.1.2. Wine

            13.8.1.3. Spirits

            13.8.1.4. Others

        13.8.2. Non-Alcoholic

            13.8.2.1. Fruit Juice

            13.8.2.2. Carbonated/Soda

            13.8.2.3. RTD Beverages

            13.8.2.4. Bottled Water

            13.8.2.5. Tea & Coffee

            13.8.2.6. Milk Products

    13.9. Current Market Size (US$ Million) and Volume (Tonnes) Forecast 2022 to 2032 By Application

        13.9.1. Alcoholic Drinks

            13.9.1.1. Beer

            13.9.1.2. Wine

            13.9.1.3. Spirits

            13.9.1.4. Others

        13.9.2. Non-Alcoholic

            13.9.2.1. Fruit Juice

            13.9.2.2. Carbonated/Soda

            13.9.2.3. RTD Beverages

            13.9.2.4. Bottled Water

            13.9.2.5. Tea & Coffee

            13.9.2.6. Milk Products

    13.10. Pricing Analysis

14. Japan Market Analysis

    14.1. Introduction

    14.2. Historical Market Size (US$ Million) and Volume (Million Units) Analysis 2017 to 2021 By Product Type

        14.2.1. Liquid Cartons

        14.2.2. Beverage Cans

        14.2.3. Glass Bottles

        14.2.4. Plastic Bottles

        14.2.5. Others

    14.3. Current Market Size (US$ Million) and Volume (Million Units) Forecast 2022 to 2032 By Product Type

        14.3.1. Liquid Cartons

        14.3.2. Beverage Cans

        14.3.3. Glass Bottles

        14.3.4. Plastic Bottles

        14.3.5. Others

    14.4. Historical Market Size (US$ Million) and Volume (Tonnes) Analysis 2017 to 2021 By Material Type

        14.4.1. Glass

        14.4.2. Plastic

            14.4.2.1. HDPE

            14.4.2.2. LDPE

            14.4.2.3. PET

            14.4.2.4. PP

        14.4.3. Metal

        14.4.4. Paper/Paperboard

    14.5. Current Market Size (US$ Million) and Volume (Tonnes) Forecast 2022 to 2032 By Material Type

        14.5.1. Glass

        14.5.2. Plastic

            14.5.2.1. HDPE

            14.5.2.2. LDPE

            14.5.2.3. PET

            14.5.2.4. PP

        14.5.3. Metal

        14.5.4. Paper/Paperboard

    14.6. Historical Market Size (US$ Million) and Volume (Tonnes) Analysis 2017 to 2021 By Application

        14.6.1. Alcoholic Drinks

            14.6.1.1. Beer

            14.6.1.2. Wine

            14.6.1.3. Spirits

            14.6.1.4. Others

        14.6.2. Non-Alcoholic

            14.6.2.1. Fruit Juice

            14.6.2.2. Carbonated/Soda

            14.6.2.3. RTD Beverages

            14.6.2.4. Bottled Water

            14.6.2.5. Tea & Coffee

            14.6.2.6. Milk Products

    14.7. Current Market Size (US$ Million) and Volume (Tonnes) Forecast 2022 to 2032 By Application

        14.7.1. Alcoholic Drinks

            14.7.1.1. Beer

            14.7.1.2. Wine

            14.7.1.3. Spirits

            14.7.1.4. Others

        14.7.2. Non-Alcoholic

            14.7.2.1. Fruit Juice

            14.7.2.2. Carbonated/Soda

            14.7.2.3. RTD Beverages

            14.7.2.4. Bottled Water

            14.7.2.5. Tea & Coffee

            14.7.2.6. Milk Products

    14.8. Pricing Analysis

15. Competition Landscape

    15.1. Market Structure

    15.2. Market Share Analysis

    15.3. Competition Intensity Mapping by Market Taxonomy

    15.4. Competition Dashboard

    15.5. Company Profiles (Details – Overview, Financials, Strategy, Recent Developments)

        15.5.1. Crown Holdings, Inc.

        15.5.2. Amcor Limited

        15.5.3. Ardagh Group S.A.

        15.5.4. Ball Corporation

        15.5.5. Gerresheimer AG

        15.5.6. Owens-Illinois, Inc.

        15.5.7. Berry Global, Inc.

        15.5.8. Beatson Clark Ltd.

        15.5.9. Intrapac International Corporation

        15.5.10. BA Glass Germany GmbH

        15.5.11. Nampak Ltd.

        15.5.12. Vidrala S.A.

        15.5.13. Silgan Containers LLC

        15.5.14. Orora Packaging Australia Pty Ltd

        15.5.15. Mahmood Saeed Beverage Cans & Ends Industry Company Ltd.

16. Research Methodology

17. Assumptions and Acronyms
Customize this Report

Let us know your requirement to get
100% FREE customization

List of Tables

Table 01: Global Market Value (US$ Million) and Volume (Tonnes) Forecast, by Region, 2017 to 2032

Table 02: Global Market Value (US$ Million) and Volume (Million units) Forecast, by product type, 2017 to 2032

Table 03: Global Market Value (US$ Million) and Volume (Tonnes) Forecast, by material type, 2017 to 2032

Table 04: Global Market Value (US$ Million) and Volume (Tonnes) Forecast, by material type, 2017 to 2032

Table 05: Global Market Value (US$ Million) and Volume (Tonnes) Forecast, by material type, 2017 to 2032

Table 06: North America Market Value (US$ Million) and Volume (Tonnes) Forecast, by Country, 2017 to 2032

Table 07: North America Market Value (US$ Million) and Volume (Million Units) Forecast, by product type, 2017 to 2032

Table 08: North America Market Value (US$ Million) and Volume (Tonnes) Forecast, by material type, 2017 to 2032

Table 09: North America Market Value (US$ Million) and Volume (Tonnes) Forecast, by material type, 2017 to 2032

Table 10: North America Market Value (US$ Million) and Volume (Tonnes) Forecast, by material type, 2017 to 2032

Table 11: Asia Pacific Excluding Japan Market Value (US$ Million) and Volume (Tonnes) Forecast, by Country, 2017 to 2032

Table 12: Asia Pacific Excluding Japan Market Value (US$ Million) and Volume (Tonnes) Forecast, by Country, 2017 to 2032

Table 13: Asia Pacific Excluding Japan Market Value (US$ Million) and Volume (Million Units) Forecast, by product type, 2017 to 2032

Table 14: Asia Pacific Excluding Japan Market Value (US$ Million) and Volume (Tonnes) Forecast, by material type, 2017 to 2032

Table 15: Asia Pacific Excluding Japan Market Value (US$ Million) and Volume (Tonnes) Forecast, by material type, 2017 to 2032

Table 16: Asia Pacific Excluding Japan Market Value (US$ Million) and Volume (Tonnes) Forecast, by material type, 2017 to 2032

Table 17: Western Europe Market Value (US$ Million) and Volume (Tonnes) Forecast, by Country, 2017 to 2032

Table 18: Western Europe Market Value (US$ Million) and Volume (Million Units) Forecast, by product type, 2017 to 2032

Table 19: Western Europe Market Value (US$ Million) and Volume (Tonnes) Forecast, by material type, 2017 to 2032

Table 20: Western Europe Market Value (US$ Million) and Volume (Tonnes) Forecast, by material type, 2017 to 2032

Table 21: Western Europe Market Value (US$ Million) and Volume (Tonnes) Forecast, by material type, 2017 to 2032

Table 22: Eastern Europe Market Value (US$ Million) and Volume (Tonnes) Forecast, by Country, 2017 to 2032

Table 23: Eastern Europe Market Value (US$ Million) and Volume (Million Units) Forecast, by product type, 2017 to 2032

Table 24: Eastern Europe Market Value (US$ Million) and Volume (Tonnes) Forecast, by material type, 2017 to 2032

Table 25: Eastern Europe Market Value (US$ Million) and Volume (Tonnes) Forecast, by material type, 2017 to 2032

Table 26: Eastern Europe Market Value (US$ Million) and Volume (Tonnes) Forecast, by material type, 2017 to 2032

Table 27: Latin America Market Value (US$ Million) and Volume (Tonnes) Forecast, by Country, 2017 to 2032

Table 28: Latin America Market Value (US$ Million) and Volume (Million Units) Forecast, by product type, 2017 to 2032

Table 29: Latin America Market Value (US$ Million) and Volume (Tonnes) Forecast, by material type, 2017 to 2032

Table 30: Latin America Market Value (US$ Million) and Volume (Tonnes) Forecast, by material type, 2017 to 2032

Table 31: Latin America Market Value (US$ Million) and Volume (Tonnes) Forecast, by material type, 2017 to 2032

Table 32: Middle East and Africa(MEA) Market Value (US$ Million) and Volume (Tonnes) Forecast, by Country, 2017 to 2032

Table 33: Middle East and Africa(MEA) Market Value (US$ Million) and Volume (Million Units) Forecast, by product type, 2017 to 2032

Table 34: Middle East and Africa(MEA) Market Value (US$ Million) and Volume (Tonnes) Forecast, by material type, 2017 to 2032

Table 35: Middle East and Africa(MEA) Market Value (US$ Million) and Volume (Tonnes) Forecast, by material type, 2017 to 2032

Table 36: Middle East and Africa(MEA) Market Value (US$ Million) and Volume (Tonnes) Forecast, by material type, 2017 to 2032

Table 37: Japan Market Value (US$ Million) and Volume (Million Units) Forecast, by product type, 2017 to 2032

Table 38: Japan Market Value (US$ Million) and Volume (Tonnes) Forecast, by material type, 2017 to 2032

Table 39: Japan Market Value (US$ Million) and Volume (Tonnes) Forecast, by material type, 2017 to 2032

Table 40: Japan Market Value (US$ Million) and Volume (Tonnes) Forecast, by material type, 2017 to 2032
Ismail Sutaria
Principal Consultant
LinkedIn
Talk to Analyst

Find your sweet spots for generating winning opportunities in this market.

Talk to Analyst

List of Charts

Figure 01: Global Market, BPS Analysis, by Region, 2022 & 2032

Figure 02: Global Market Attractiveness Analysis, by Region, 2022 to 2032

Figure 03: Global Market Value (US$ Million) and Volume (Tonnes) analysis, 2017 to 2021

Figure 04: Global Market Value (US$ Million) and Volume (Tonnes) Forecast, 2022 to 2032

Figure 05: Global Market, BPS Analysis, by product type, 2022 & 2032

Figure 06: Global Market Attractiveness Analysis, by Product Type, 2022 to 2032

Figure 07: Global Market Value (US$ Million) and Volume (Million units) analysis, by Liquid Cartons Segment, 2017 to 2021

Figure 08: Global Market Value (US$ Million) and Volume (Million units) Forecast, by Liquid Cartons Segment, 2022 to 2032

Figure 09: Global Market Value (US$ Million) and Volume (Million units) analysis, by beverage cans segment, 2017 to 2021

Figure 10: Global Market Value (US$ Million) and Volume (Million units) Forecast, by beverage cans segment, 2022 to 2032

Figure 11: Global Market Value (US$ Million) and Volume (Million units) analysis, by glass bottles segment, 2017 to 2021

Figure 12: Global Market Value (US$ Million) and Volume (Million units) Forecast, by glass bottles segment, 2022 to 2032

Figure 13: Global Market Value (US$ Million) and Volume (Million units) analysis, by plastic bottles segment, 2017 to 2021

Figure 14: Global Market Value (US$ Million) and Volume (Million units) Forecast, by plastic bottles segment, 2022 to 2032

Figure 15: Global Market Value (US$ Million) and Volume (Million units) analysis, by others segment, 2017 to 2021

Figure 16: Global Market Value (US$ Million) and Volume (Million Units) Forecast, by others segment, 2022 to 2032

Figure 17: Global Market, BPS Analysis, by material type, 2022 & 2032

Figure 18: Global Market Attractiveness Analysis, by Material Type, 2022 to 2032

Figure 19: Global Market Value (US$ Million) and Volume (Tonnes) analysis, by glass segment, 2017 to 2021

Figure 20: Global Market Value (US$ Million) and Volume (Tonnes) Forecast, by glass segment, 2022 to 2032

Figure 21: Global Market Value (US$ Million) and Volume (Tonnes) analysis, by plastic segment, 2017 to 2021

Figure 22: Global Market Value (US$ Million) and Volume (Tonnes) Forecast, by plastic segment, 2022 to 2032

Figure 23: Global Market Value (US$ Million) and Volume (Tonnes) analysis, by metal segment, 2017 to 2021

Figure 24: Global Market Value (US$ Million) and Volume (Tonnes) Forecast, by metal segment, 2022 to 2032

Figure 25: Global Market Value (US$ Million) and Volume (Tonnes) analysis, by paper/paperboard segment, 2017 to 2021

Figure 26: Global Market Value (US$ Million) and Volume (Tonnes) Forecast, by paper/paperboard segment, 2022 to 2032

Figure 27: Global Market, BPS Analysis, by application, 2022 & 2032

Figure 28: Global Market Attractiveness Analysis, by application, 2022 to 2032

Figure 29: Global Market Value (US$ Million) and Volume (Tonnes) analysis, by alcoholic drinks segment, 2017 to 2021

Figure 30: Global Market Value (US$ Million) and Volume (Tonnes) Forecast, by alcoholic drinks segment, 2022 to 2032

Figure 31: Global Market Value (US$ Million) by alcoholic drinks sub-segments, 2012–2027

Figure 32: Global Market Volume (Tonnes) by alcoholic drinks sub-segments, 2012–2027

Figure 33: Global Market Value (US$ Million) and Volume (Tonnes) analysis, by non-alcoholic drinks segment, 2017 to 2021

Figure 34: Global Market Value (US$ Million) and Volume (Tonnes) Forecast, by non-alcoholic drinks segment, 2022 to 2032

Figure 35: Global Market Value (US$ Million) by non-alcoholic drinks sub-segments, 2012–2027

Figure 36: Global Market Volume (Tonnes) by non-alcoholic drinks sub-segments, 2012–2027

Figure 37: North America Market Value (US$ Million) and Volume (Tonnes) analysis, 2017 to 2021

Figure 38: North America Market Value (US$ Million) and Volume (Tonnes) Forecast, 2022 to 2032

Figure 39: North America Market, BPS Analysis, by country, 2017, 2022 & 2032

Figure 40: North America Market, Y-o-Y growth, by country, 2017 to 2032

Figure 41: North America Market Value (US$ Million) by country, 2022 to 2032

Figure 42: North America Y-o-Y growth

Figure 43: North America Market attractiveness analysis, by product type, 2022 to 2032

Figure 44: North America Y-o-Y growth

Figure 45: North America Market attractiveness analysis, by material type, 2022 to 2032

Figure 46: North America Y-o-Y growth

Figure 47: North America Market attractiveness analysis, by application, 2022 to 2032

Figure 48: Asia Pacific Excluding Japan Market Value (US$ Million) and Volume (Tonnes) analysis, 2017 to 2021

Figure 49: Asia Pacific Excluding Japan Market Value (US$ Million) and Volume (Tonnes) Forecast, 2022 to 2032

Figure 50: Asia Pacific Excluding Japan Market, BPS Analysis, by country, 2017, 2022 & 2032

Figure 51: Asia Pacific Excluding Japan Market, Y-o-Y growth, by country, 2017 to 2032

Figure 52: Asia Pacific Excluding Japan Market Value (US$ Million) by ASEAN countries, 2012–2027

Figure 53: Asia Pacific Excluding Japan Market Volume (Tonnes) by ASEAN countries, 2012–2027

Figure 54: Asia Pacific Excluding Japan Market Value (US$ Million) by country, 2022 to 2032

Figure 55: Asia Pacific Excluding Japan Y-o-Y growth

Figure 56: Asia Pacific Excluding Japan Market attractiveness analysis, by product type, 2022 to 2032

Figure 57: Asia Pacific Excluding Japan Y-o-Y growth

Figure 58: Asia Pacific Excluding Japan Market attractiveness analysis, by material type, 2022 to 2032

Figure 59: Asia Pacific Excluding Japan Y-o-Y growth

Figure 60: Asia Pacific Excluding Japan Market attractiveness analysis, by application, 2022 to 2032

Figure 61: Western Europe Market Value (US$ Million) and Volume (Tonnes) analysis, 2017 to 2021

Figure 62: Western Europe Market Value (US$ Million) and Volume (Tonnes) Forecast, 2022 to 2032

Figure 63: Western Europe Market, BPS Analysis, by country, 2017, 2022 & 2032

Figure 64: Western Europe Market, Y-o-Y growth, by country, 2017 to 2032

Figure 65: Western Europe Market Value (US$ Million) by country, 2022 to 2032

Figure 66: Western Europe Y-o-Y growth

Figure 67: Western Europe Market attractiveness analysis, by product type, 2022 to 2032

Figure 68: Western Europe Y-o-Y growth

Figure 69: Western Europe Market attractiveness analysis, by material type, 2022 to 2032

Figure 70: Western Europe Y-o-Y growth

Figure 71: Western Europe Market attractiveness analysis, by application, 2022 to 2032

Figure 72: Eastern Europe Market Value (US$ Million) and Volume (Tonnes) analysis, 2017 to 2021

Figure 73: Eastern Europe Market Value (US$ Million) and Volume (Tonnes) Forecast, 2022 to 2032

Figure 74: Eastern Europe Market, BPS Analysis, by country, 2017, 2022 & 2032

Figure 75: Eastern Europe Market, Y-o-Y growth, by country, 2017 to 2032

Figure 76: Eastern Europe Market Value (US$ Million) by country, 2022 to 2032

Figure 77: Eastern Europe Y-o-Y growth

Figure 78: Eastern Europe Market attractiveness analysis, by product type, 2022 to 2032

Figure 79: Eastern Europe Y-o-Y growth

Figure 80: Eastern Europe Market attractiveness analysis, by material type, 2022 to 2032

Figure 81: Eastern Europe Y-o-Y growth

Figure 82: Eastern Europe Market attractiveness analysis, by application, 2022 to 2032

Figure 83: Latin America Market Value (US$ Million) and Volume (Tonnes) analysis, 2017 to 2021

Figure 84: Latin America Market Value (US$ Million) and Volume (Tonnes) Forecast, 2022 to 2032

Figure 85: Latin America Market, BPS Analysis, by country, 2017, 2022 & 2032

Figure 86: Latin America Market, Y-o-Y growth, by country, 2017 to 2032

Figure 87: Latin America Market Value (US$ Million) by country, 2022 to 2032

Figure 88: Latin America Y-o-Y growth

Figure 89: Latin America Market attractiveness analysis, by product type, 2022 to 2032

Figure 90: Latin America Y-o-Y growth

Figure 91: Latin America Market attractiveness analysis, by material type, 2022 to 2032

Figure 92: Latin America Y-o-Y growth

Figure 93: Latin America Market attractiveness analysis, by application, 2022 to 2032

Figure 94: Middle East and Africa(MEA) Market Value (US$ Million) and Volume (Tonnes) analysis, 2017 to 2021

Figure 95: Middle East and Africa(MEA) Market Value (US$ Million) and Volume (Tonnes) Forecast, 2022 to 2032

Figure 96: Middle East and Africa(MEA) Market, BPS Analysis, by country, 2017, 2022 & 2032

Figure 97: Middle East and Africa(MEA) Market, Y-o-Y growth, by country, 2017 to 2032

Figure 98: Middle East and Africa(MEA) Market Value (US$ Million) by country, 2022 to 2032

Figure 99: Middle East and Africa(MEA) Y-o-Y growth

Figure 100: Middle East and Africa(MEA) Market attractiveness analysis, by product type, 2022 to 2032

Figure 101: Middle East and Africa(MEA) Y-o-Y growth

Figure 102: Middle East and Africa(MEA) Market attractiveness analysis, by material type, 2022 to 2032

Figure 103: Middle East and Africa(MEA) Y-o-Y growth

Figure 104: Middle East and Africa(MEA) Market attractiveness analysis, by application, 2022 to 2032

Figure 105: Japan Market Value (US$ Million) and Volume (Tonnes) analysis, 2017 to 2021

Figure 106: Japan Market Value (US$ Million) and Volume (Tonnes) Forecast, 2022 to 2032

Figure 107: Japan's Y-o-Y growth

Figure 108: Japan Market attractiveness analysis, by Product Type, 2022 to 2032

Figure 109: Japan's Y-o-Y growth

Figure 110: Japan Market attractiveness analysis, by Material Type, 2022 to 2032

Figure 111: Japan's Y-o-Y growth

Figure 112: Japan Market attractiveness analysis, by Application, 2022 to 2032

Need specific information?

Request Customization

Explore Packaging Insights

View Reports

Recommendations

Packaging

Cement Packaging Market

Published : December 2019

Packaging

Sanitary Food & Beverage Packaging Market

Published : May 2021

Packaging

Alcohol Packaging Market

Published : September 2017

Packaging

Parenteral Packaging Market

Published : June 2021

Google translate

Beverage Packaging Market