Beverage Clouding Agent Market Outlook (2023 to 2033)

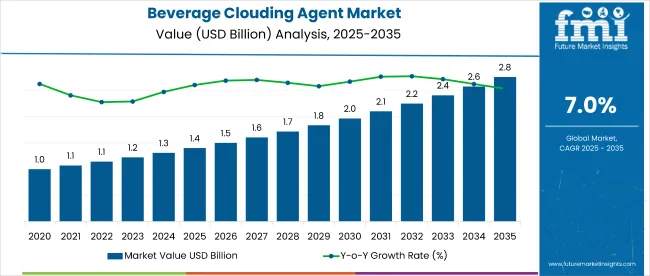
In 2023, the global beverage clouding agent market is valued at US$ 1,293.5 million. The market is anticipated to reach nearly US$ 2,469.7 million by 2033, with a growing CAGR of 7.1% from 2023 to 2033.

Future Market Insights states that the demand for beverage clouding agents from beverage manufacturers is likely to witness sustained growth during the forecast period owing to increasing disposable income amongst consumers. Clouding agents are primary additives added to beverages to give them opacity or cloudiness to a clear beverage. This is done to make the beverage visually appealing to the customers.

Report Attribute Details
Beverage Clouding Agent Market Value (2023) US$ 1,293.5 million
Beverage Clouding Agent Market Anticipated Value (2033) US$ 2,469.7 million
Beverage Clouding Agent Projected Growth Rate (2023 to 2033) 7.1%

These clouding agents can be synthetic, natural, or microbial-derived sources. Generally, the cloudy appearance of beverages is visually not appealing to consumers. Therefore the presence of clouding agents can decrease the consumption of drinks. Several clouding agents, such as palm oil, Arabic gum, citrus fruit extracts, etc., are being widely used across the beverage industry to enhance the overall properties of the beverage.

The aim of many beverage manufacturers to enhance the stability and shelf life of products and make them look as natural as possible will continue to encourage the sales of beverage clouding agents over the forecast period. Moreover, increasing demand for new and exclusive flavored drinks and a swift rise in the global population will also aid in inflating the market size.

Don't pay for what you don't need

Customize your report by selecting specific countries or regions and save 30%!

5 Influential Factors Beverage Clouding Agents Market

  • In the past few years, demand for beverage clouding agents has experienced a considerable increase across the beverages industry as these agents increase the shelf life and stability of the beverages.
  • With the introduction of the invention in the formulation of beverage clouding agents, the demand and application of these agents rely on their end use. Therefore the market is anticipated to grow gradually during the forecast period.
  • Over the forecast period, the demand for cloud agents is said to grow due to their application in lemonades, fresh fruit juices, and guava-based beverages.
  • The beverage clouding agent market is anticipated to experience lasting growth across the globe due to the increasing customer base of the beverages market and rising acceptance of energy drinks and sports drinks.
  • The growing inclination of the population in developing countries towards a high-end lifestyle, which consists of everyday consumption of fresh fruit juices. This is said to be the most crucial driving factor for this industry.

North America Homes the Most Numbers of Key Market Players

North America is accountable for 34% global beverage clouding agent market share. This region is said to be the positively growing market for clouding agents due to the excessive consumption of beverages, the heavy presence of leading market manufacturers, and increasing consumer awareness.

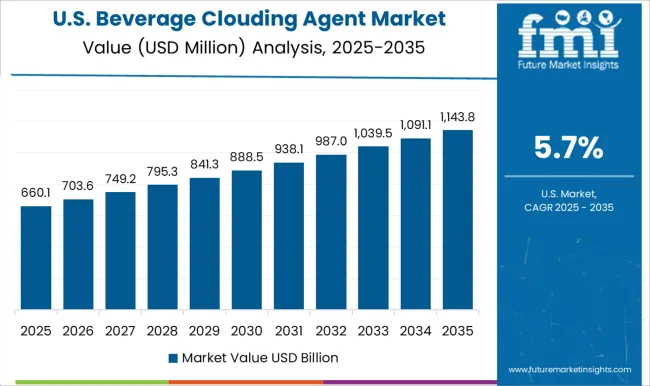
Extremely developed nations such as the USA are known to be the core center where the adoption of beverage clouding agents is more owing to its characteristic of enhancing shelf life, stability, and opacity of beverages, growing preference of consumers towards consuming organic energy drinks, and other beverages. The key market players in this region have come to terms with the fact that the masses prefer non-alcoholic beverages. National Health and Nutrition Examination Survey says that consumption of diet beverages and fruit beverages is progressively increasing among USA adults.

Nandini Roy Choudhury

Principal Consultant

Talk to Analyst

Find your sweet spots for generating winning opportunities in this market.

Asia Pacific Climbing Up at a Significant Pace

Asia Pacific is anticipated to grow fast and steadily with the beverage clouding agent. It is anticipated to grow at a significant CAGR during the forecast period owing to the increasing beverages market and growing popularity of sports drinks in this region.

Additional factors such as rising disposable income, swiftly growing population, altering lifestyle, and growing production and consumption of beverages in this region, the Asia Pacific beverage clouding agent market is like to portray constant growth in the future.

In countries like India and China, demand for beverage clouding agents is specifically increasing due to the fast-expanding food and beverage industry, increasing adoption of sports and energy drinks, and swelling population. Additionally, new entrants across novel regional and domestic beverage manufacturers are backing the growth of this market and this trend is said to stay constant in the future.

An Eye on the Start ups

Who Joywell Foods
When May 2022
What Joywell Foods employs microbes to produce nature-identical ultra-sweet proteins found in fruits and berries, it recently raised US$ 25 million in a funding round that Piva Capital led as it gears up for the launch of its first consumer products which features the sweeteners.
Who De Soi
When July 2022
What De Soi, a start-up in making of non-alcoholic aperitifs, raised $4 million in seed funding. The start-up will make use of the injection of capital to expand its retail footprint across the nation.

Get the data you need at a Fraction of the cost

Personalize your report by choosing insights you need
and save 40%!

Key Players Benchmarking the Beverage Clouding Agent Market

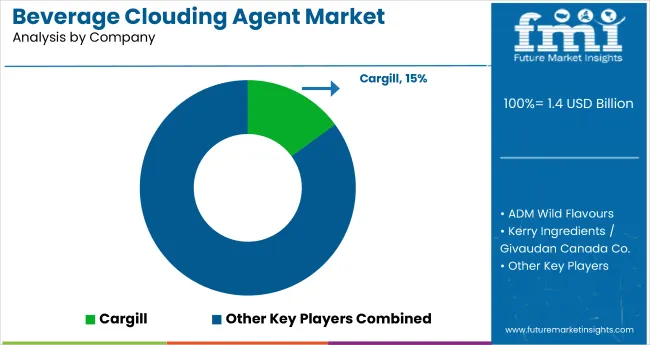
Some of the key players in the beverage clouding agent market are Eastman Chemical Company, Cargill, ADM Wild Flavours, Alsiano, Gat Foods, GLCC Co., Kerry Ingredients Givaudan Canada Co., Danisco (DuPont), Chr. Hansen Holding A/S, and Flachsmann Flavors and Extracts. The buying giants in the market include The Coco-Cola Company, PepsiCo, Del Monte Foods, and Real Fruit Juice (Dabur)

Who Cargill
When July 2022
Strategic Move Cargill and Continental Grain Company announced the completion of the previously announced acquisition of Sanderson Farms, Inc. by a joint venture between the two companies. The acquisition of initially announced in August 2021.
Who Givaudan Canada Co.
When June 2022
Strategic Move Givaudan, a worldwide giant in taste and wellbeing, and Manus Bio, a biomanufacturer of natural products, announced the launch of BioNootkatone. It is an exclusive ingredient that answers market demand for natural, sustainable, clean-label citrus flavor without the cost and supply volatility of traditional citrus extracts.

Recent Developments:

  • May 2023: Kerry Group confirmed the official introduction of its new organic clouding product Innopearl, to use with dairy drinks.
  • April 2023: Cargill revealed the increase in the capacity for manufacturing its organic clouding agent, ClearFlo.
  • March 2023: ADM confirmed the official launch of its newest organic clouding agent, TruCalm.

Report Scope

Report Attribute Details
Growth Rate CAGR of 7.1% from 2023 to 2033
Base Year for Estimation 2022
Historical Data 2018 to 2022
Forecast Period 2023 to 2033
Quantitative Units Revenue in US$ million and CAGR from 2023 to 2033
Report Coverage Revenue Forecast, Volume Forecast, Company Ranking, Competitive Landscape, Growth Factors, Trends, and Pricing Analysis
Segments Covered
  • Source
  • Property
  • Preparation
  • Form
  • Application
  • Region
Regions Covered
  • North America
  • Latin America
  • Europe
  • East Asia
  • South Asia
  • Oceania
  • Middle East and Africa
Key Countries Profiled
  • United States of America
  • Canada
  • Brazil
  • Argentina
  • Germany
  • United Kingdom
  • France
  • Spain
  • Italy
  • Nordics
  • BENELUX
  • Australia & New Zealand
  • China
  • India
  • ASIAN
  • GCC Countries
  • South Africa
Key Companies Profiled
  • Eastman Chemical Company
  • Cargill
  • ADM Wild Flavours
  • Alano
  • Gat Foods
  • GLCC Co.
  • Kerry Ingredients Givaudan Canada Co.
  • Danisco (DuPont)
  • Chr. Hansen Holding A/S
  • Flachsmann Flavors and Extracts
Customization Available Upon Request

Key Segments of the Beverage Clouding Agent Market

By Source:

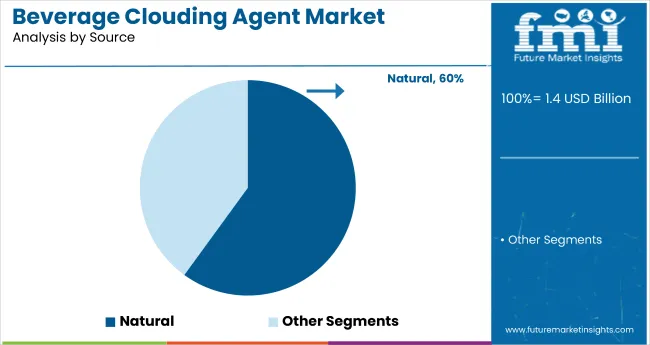
  • Natural Clouding Agents
  • Synthetic Clouding Agents

By Property:

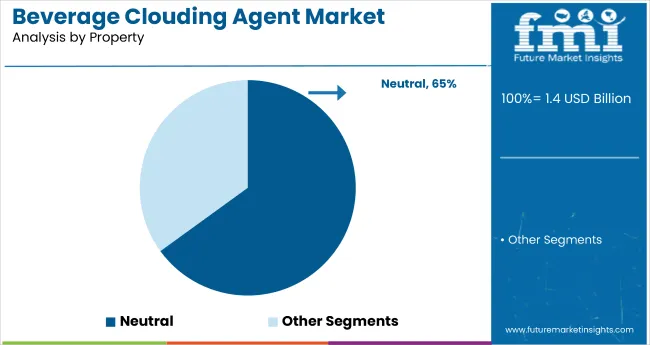
  • Neutral
  • Non-Neutral (Colored) Clouding Agents

By Preparation:

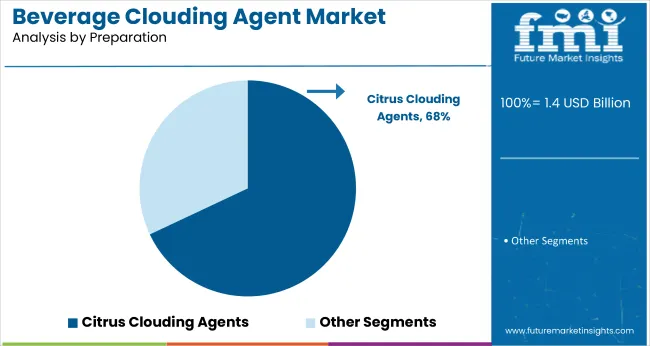
  • Citrus Clouding Agents
  • Non-Citrus Clouding Agents

By Form:

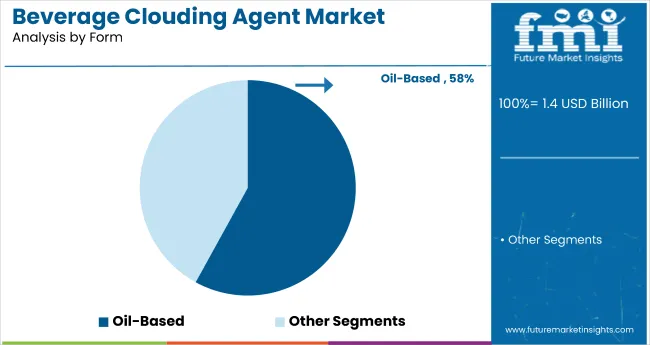
  • Oil-Based
  • Powder

By Application:

  • Instant Beverages
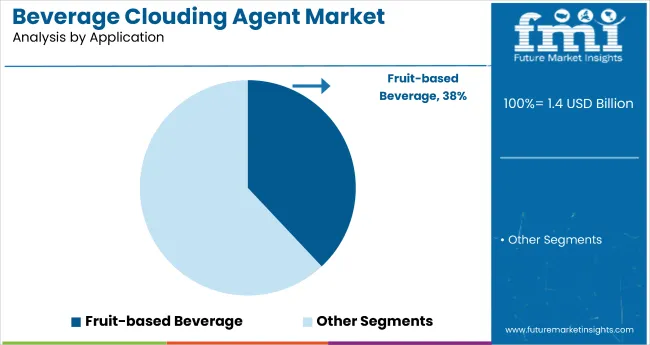
  • Fruit-based Beverage,
  • Energy Drinks
  • Sports Drinks
  • RTD and Smoothies
  • Others

By Region:

  • North America
  • Latin America
  • Asia Pacific
  • Middle East and Africa
  • Europe

Frequently Asked Questions

What is the Present Valuation of the Beverage Clouding Agent Market?

The beverage clouding agent market holds a valuation of US$ 1,293.5 million in 2023.

What is the Beverage Clouding Agent Market Size Projected by 2033?

The projected value of the beverage clouding agent market is anticipated to attain US$ 2,469.7 million by 2033.

What is the CAGR Prediction for the Beverage Clouding Agent Market?

The beverage clouding agent market is anticipated to register a CAGR of 7.1% through 2033.

Which Region Holds High Lucrativeness for Beverage Clouding Agents?

Growing consumer awareness makes North America a highly profitable market, commanding a 34% share of the global beverage clouding agent market.

Which is the Top Trend in the Beverage Clouding Agent Market?

The increasing demand for natural and clean label clouding agents stands as the top trend in the beverage clouding agent market.

Table of Content
1. Executive Summary

    1.1. Global Market Outlook

    1.2. Demand-side Trends

    1.3. Supply-side Trends

    1.4. Technology Roadmap Analysis

    1.5. Analysis and Recommendations

2. Market Overview

    2.1. Market Coverage / Taxonomy

    2.2. Market Definition / Scope / Limitations

3. Market Background

    3.1. Market Dynamics

        3.1.1. Drivers

        3.1.2. Restraints

        3.1.3. Opportunity

        3.1.4. Trends

    3.2. Scenario Forecast

        3.2.1. Demand in Optimistic Scenario

        3.2.2. Demand in Likely Scenario

        3.2.3. Demand in Conservative Scenario

    3.3. Opportunity Map Analysis

    3.4. Product Life Cycle Analysis

    3.5. Supply Chain Analysis

        3.5.1. Supply Side Participants and their Roles

            3.5.1.1. Producers

            3.5.1.2. Mid-Level Participants (Traders/ Agents/ Brokers)

            3.5.1.3. Wholesalers and Distributors

        3.5.2. Value Added and Value Created at Node in the Supply Chain

        3.5.3. List of Raw Material Suppliers

        3.5.4. List of Existing and Potential Buyer’s

    3.6. Investment Feasibility Matrix

    3.7. Value Chain Analysis

        3.7.1. Profit Margin Analysis

        3.7.2. Wholesalers and Distributors

        3.7.3. Retailers

    3.8. PESTLE and Porter’s Analysis

    3.9. Regulatory Landscape

        3.9.1. By Key Regions

        3.9.2. By Key Countries

    3.10. Regional Parent Market Outlook

    3.11. Production and Consumption Statistics

    3.12. Import and Export Statistics

4. Global Market Analysis 2018 to 2022 and Forecast, 2023 to 2033

    4.1. Historical Market Size Value (US$ Million) & Volume (Tons) Analysis, 2018 to 2022

    4.2. Current and Future Market Size Value (US$ Million) & Volume (Tons) Projections, 2023 to 2033

        4.2.1. Y-o-Y Growth Trend Analysis

        4.2.2. Absolute $ Opportunity Analysis

5. Global Market Analysis 2018 to 2022 and Forecast 2023 to 2033, By Source

    5.1. Introduction / Key Findings

    5.2. Historical Market Size Value (US$ Million) & Volume (Tons) Analysis By Source, 2018 to 2022

    5.3. Current and Future Market Size Value (US$ Million) & Volume (Tons) Analysis and Forecast By Source, 2023 to 2033

        5.3.1. Natural

        5.3.2. Synthetic

    5.4. Y-o-Y Growth Trend Analysis By Source, 2018 to 2022

    5.5. Absolute $ Opportunity Analysis By Source, 2023 to 2033

6. Global Market Analysis 2018 to 2022 and Forecast 2023 to 2033, By Property

    6.1. Introduction / Key Findings

    6.2. Historical Market Size Value (US$ Million) & Volume (Tons) Analysis By Property, 2018 to 2022

    6.3. Current and Future Market Size Value (US$ Million) & Volume (Tons) Analysis and Forecast By Property, 2023 to 2033

        6.3.1. Neutral

        6.3.2. Non-Neutral (Colored)

    6.4. Y-o-Y Growth Trend Analysis By Property, 2018 to 2022

    6.5. Absolute $ Opportunity Analysis By Property, 2023 to 2033

7. Global Market Analysis 2018 to 2022 and Forecast 2023 to 2033, By Preparation

    7.1. Introduction / Key Findings

    7.2. Historical Market Size Value (US$ Million) & Volume (Tons) Analysis By Preparation, 2018 to 2022

    7.3. Current and Future Market Size Value (US$ Million) & Volume (Tons) Analysis and Forecast By Preparation, 2023 to 2033

        7.3.1. Citrus Clouding Agents

        7.3.2. Non-Citrus Clouding Agents

    7.4. Y-o-Y Growth Trend Analysis By Preparation, 2018 to 2022

    7.5. Absolute $ Opportunity Analysis By Preparation, 2023 to 2033

8. Global Market Analysis 2018 to 2022 and Forecast 2023 to 2033, By Form

    8.1. Introduction / Key Findings

    8.2. Historical Market Size Value (US$ Million) & Volume (Tons) Analysis By Form, 2018 to 2022

    8.3. Current and Future Market Size Value (US$ Million) & Volume (Tons) Analysis and Forecast By Form, 2023 to 2033

        8.3.1. Oil-Based

        8.3.2. Powder

    8.4. Y-o-Y Growth Trend Analysis By Form, 2018 to 2022

    8.5. Absolute $ Opportunity Analysis By Form, 2023 to 2033

9. Global Market Analysis 2018 to 2022 and Forecast 2023 to 2033, By Application

    9.1. Introduction / Key Findings

    9.2. Historical Market Size Value (US$ Million) & Volume (Tons) Analysis By Application, 2018 to 2022

    9.3. Current and Future Market Size Value (US$ Million) & Volume (Tons) Analysis and Forecast By Application, 2023 to 2033

        9.3.1. Instant Beverages

        9.3.2. Fruit-based Beverage,

        9.3.3. Energy Drinks

        9.3.4. Sports Drinks

        9.3.5. RTD and Smoothies

        9.3.6. Others

    9.4. Y-o-Y Growth Trend Analysis By Application, 2018 to 2022

    9.5. Absolute $ Opportunity Analysis By Application, 2023 to 2033

10. Global Market Analysis 2018 to 2022 and Forecast 2023 to 2033, By Region

    10.1. Introduction

    10.2. Historical Market Size Value (US$ Million) & Volume (Tons) Analysis By Region, 2018 to 2022

    10.3. Current Market Size Value (US$ Million) & Volume (Tons) Analysis and Forecast By Region, 2023 to 2033

        10.3.1. North America

        10.3.2. Latin America

        10.3.3. Western Europe

        10.3.4. Eastern Europe

        10.3.5. South Asia and Pacific

        10.3.6. East Asia

        10.3.7. Middle East and Africa

    10.4. Market Attractiveness Analysis By Region

11. North America Market Analysis 2018 to 2022 and Forecast 2023 to 2033, By Country

    11.1. Historical Market Size Value (US$ Million) & Volume (Tons) Trend Analysis By Market Taxonomy, 2018 to 2022

    11.2. Market Size Value (US$ Million) & Volume (Tons) Forecast By Market Taxonomy, 2023 to 2033

        11.2.1. By Country

            11.2.1.1. USA

            11.2.1.2. Canada

        11.2.2. By Source

        11.2.3. By Property

        11.2.4. By Preparation

        11.2.5. By Form

        11.2.6. By Application

    11.3. Market Attractiveness Analysis

        11.3.1. By Country

        11.3.2. By Source

        11.3.3. By Property

        11.3.4. By Preparation

        11.3.5. By Form

        11.3.6. By Application

    11.4. Key Takeaways

12. Latin America Market Analysis 2018 to 2022 and Forecast 2023 to 2033, By Country

    12.1. Historical Market Size Value (US$ Million) & Volume (Tons) Trend Analysis By Market Taxonomy, 2018 to 2022

    12.2. Market Size Value (US$ Million) & Volume (Tons) Forecast By Market Taxonomy, 2023 to 2033

        12.2.1. By Country

            12.2.1.1. Brazil

            12.2.1.2. Mexico

            12.2.1.3. Rest of Latin America

        12.2.2. By Source

        12.2.3. By Property

        12.2.4. By Preparation

        12.2.5. By Form

        12.2.6. By Application

    12.3. Market Attractiveness Analysis

        12.3.1. By Country

        12.3.2. By Source

        12.3.3. By Property

        12.3.4. By Preparation

        12.3.5. By Form

        12.3.6. By Application

    12.4. Key Takeaways

13. Western Europe Market Analysis 2018 to 2022 and Forecast 2023 to 2033, By Country

    13.1. Historical Market Size Value (US$ Million) & Volume (Tons) Trend Analysis By Market Taxonomy, 2018 to 2022

    13.2. Market Size Value (US$ Million) & Volume (Tons) Forecast By Market Taxonomy, 2023 to 2033

        13.2.1. By Country

            13.2.1.1. Germany

            13.2.1.2. UK

            13.2.1.3. France

            13.2.1.4. Spain

            13.2.1.5. Italy

            13.2.1.6. Rest of Western Europe

        13.2.2. By Source

        13.2.3. By Property

        13.2.4. By Preparation

        13.2.5. By Form

        13.2.6. By Application

    13.3. Market Attractiveness Analysis

        13.3.1. By Country

        13.3.2. By Source

        13.3.3. By Property

        13.3.4. By Preparation

        13.3.5. By Form

        13.3.6. By Application

    13.4. Key Takeaways

14. Eastern Europe Market Analysis 2018 to 2022 and Forecast 2023 to 2033, By Country

    14.1. Historical Market Size Value (US$ Million) & Volume (Tons) Trend Analysis By Market Taxonomy, 2018 to 2022

    14.2. Market Size Value (US$ Million) & Volume (Tons) Forecast By Market Taxonomy, 2023 to 2033

        14.2.1. By Country

            14.2.1.1. Poland

            14.2.1.2. Russia

            14.2.1.3. Czech Republic

            14.2.1.4. Romania

            14.2.1.5. Rest of Eastern Europe

        14.2.2. By Source

        14.2.3. By Property

        14.2.4. By Preparation

        14.2.5. By Form

        14.2.6. By Application

    14.3. Market Attractiveness Analysis

        14.3.1. By Country

        14.3.2. By Source

        14.3.3. By Property

        14.3.4. By Preparation

        14.3.5. By Form

        14.3.6. By Application

    14.4. Key Takeaways

15. South Asia and Pacific Market Analysis 2018 to 2022 and Forecast 2023 to 2033, By Country

    15.1. Historical Market Size Value (US$ Million) & Volume (Tons) Trend Analysis By Market Taxonomy, 2018 to 2022

    15.2. Market Size Value (US$ Million) & Volume (Tons) Forecast By Market Taxonomy, 2023 to 2033

        15.2.1. By Country

            15.2.1.1. India

            15.2.1.2. Bangladesh

            15.2.1.3. Australia

            15.2.1.4. New Zealand

            15.2.1.5. Rest of South Asia and Pacific

        15.2.2. By Source

        15.2.3. By Property

        15.2.4. By Preparation

        15.2.5. By Form

        15.2.6. By Application

    15.3. Market Attractiveness Analysis

        15.3.1. By Country

        15.3.2. By Source

        15.3.3. By Property

        15.3.4. By Preparation

        15.3.5. By Form

        15.3.6. By Application

    15.4. Key Takeaways

16. East Asia Market Analysis 2018 to 2022 and Forecast 2023 to 2033, By Country

    16.1. Historical Market Size Value (US$ Million) & Volume (Tons) Trend Analysis By Market Taxonomy, 2018 to 2022

    16.2. Market Size Value (US$ Million) & Volume (Tons) Forecast By Market Taxonomy, 2023 to 2033

        16.2.1. By Country

            16.2.1.1. China

            16.2.1.2. Japan

            16.2.1.3. South Korea

        16.2.2. By Source

        16.2.3. By Property

        16.2.4. By Preparation

        16.2.5. By Form

        16.2.6. By Application

    16.3. Market Attractiveness Analysis

        16.3.1. By Country

        16.3.2. By Source

        16.3.3. By Property

        16.3.4. By Preparation

        16.3.5. By Form

        16.3.6. By Application

    16.4. Key Takeaways

17. Middle East and Africa Market Analysis 2018 to 2022 and Forecast 2023 to 2033, By Country

    17.1. Historical Market Size Value (US$ Million) & Volume (Tons) Trend Analysis By Market Taxonomy, 2018 to 2022

    17.2. Market Size Value (US$ Million) & Volume (Tons) Forecast By Market Taxonomy, 2023 to 2033

        17.2.1. By Country

            17.2.1.1. GCC Countries

            17.2.1.2. South Africa

            17.2.1.3. Israel

            17.2.1.4. Rest of MEA

        17.2.2. By Source

        17.2.3. By Property

        17.2.4. By Preparation

        17.2.5. By Form

        17.2.6. By Application

    17.3. Market Attractiveness Analysis

        17.3.1. By Country

        17.3.2. By Source

        17.3.3. By Property

        17.3.4. By Preparation

        17.3.5. By Form

        17.3.6. By Application

    17.4. Key Takeaways

18. Key Countries Market Analysis

    18.1. USA

        18.1.1. Pricing Analysis

        18.1.2. Market Share Analysis, 2022

            18.1.2.1. By Source

            18.1.2.2. By Property

            18.1.2.3. By Preparation

            18.1.2.4. By Form

            18.1.2.5. By Application

    18.2. Canada

        18.2.1. Pricing Analysis

        18.2.2. Market Share Analysis, 2022

            18.2.2.1. By Source

            18.2.2.2. By Property

            18.2.2.3. By Preparation

            18.2.2.4. By Form

            18.2.2.5. By Application

    18.3. Brazil

        18.3.1. Pricing Analysis

        18.3.2. Market Share Analysis, 2022

            18.3.2.1. By Source

            18.3.2.2. By Property

            18.3.2.3. By Preparation

            18.3.2.4. By Form

            18.3.2.5. By Application

    18.4. Mexico

        18.4.1. Pricing Analysis

        18.4.2. Market Share Analysis, 2022

            18.4.2.1. By Source

            18.4.2.2. By Property

            18.4.2.3. By Preparation

            18.4.2.4. By Form

            18.4.2.5. By Application

    18.5. Germany

        18.5.1. Pricing Analysis

        18.5.2. Market Share Analysis, 2022

            18.5.2.1. By Source

            18.5.2.2. By Property

            18.5.2.3. By Preparation

            18.5.2.4. By Form

            18.5.2.5. By Application

    18.6. UK

        18.6.1. Pricing Analysis

        18.6.2. Market Share Analysis, 2022

            18.6.2.1. By Source

            18.6.2.2. By Property

            18.6.2.3. By Preparation

            18.6.2.4. By Form

            18.6.2.5. By Application

    18.7. France

        18.7.1. Pricing Analysis

        18.7.2. Market Share Analysis, 2022

            18.7.2.1. By Source

            18.7.2.2. By Property

            18.7.2.3. By Preparation

            18.7.2.4. By Form

            18.7.2.5. By Application

    18.8. Spain

        18.8.1. Pricing Analysis

        18.8.2. Market Share Analysis, 2022

            18.8.2.1. By Source

            18.8.2.2. By Property

            18.8.2.3. By Preparation

            18.8.2.4. By Form

            18.8.2.5. By Application

    18.9. Italy

        18.9.1. Pricing Analysis

        18.9.2. Market Share Analysis, 2022

            18.9.2.1. By Source

            18.9.2.2. By Property

            18.9.2.3. By Preparation

            18.9.2.4. By Form

            18.9.2.5. By Application

    18.10. Poland

        18.10.1. Pricing Analysis

        18.10.2. Market Share Analysis, 2022

            18.10.2.1. By Source

            18.10.2.2. By Property

            18.10.2.3. By Preparation

            18.10.2.4. By Form

            18.10.2.5. By Application

    18.11. Russia

        18.11.1. Pricing Analysis

        18.11.2. Market Share Analysis, 2022

            18.11.2.1. By Source

            18.11.2.2. By Property

            18.11.2.3. By Preparation

            18.11.2.4. By Form

            18.11.2.5. By Application

    18.12. Czech Republic

        18.12.1. Pricing Analysis

        18.12.2. Market Share Analysis, 2022

            18.12.2.1. By Source

            18.12.2.2. By Property

            18.12.2.3. By Preparation

            18.12.2.4. By Form

            18.12.2.5. By Application

    18.13. Romania

        18.13.1. Pricing Analysis

        18.13.2. Market Share Analysis, 2022

            18.13.2.1. By Source

            18.13.2.2. By Property

            18.13.2.3. By Preparation

            18.13.2.4. By Form

            18.13.2.5. By Application

    18.14. India

        18.14.1. Pricing Analysis

        18.14.2. Market Share Analysis, 2022

            18.14.2.1. By Source

            18.14.2.2. By Property

            18.14.2.3. By Preparation

            18.14.2.4. By Form

            18.14.2.5. By Application

    18.15. Bangladesh

        18.15.1. Pricing Analysis

        18.15.2. Market Share Analysis, 2022

            18.15.2.1. By Source

            18.15.2.2. By Property

            18.15.2.3. By Preparation

            18.15.2.4. By Form

            18.15.2.5. By Application

    18.16. Australia

        18.16.1. Pricing Analysis

        18.16.2. Market Share Analysis, 2022

            18.16.2.1. By Source

            18.16.2.2. By Property

            18.16.2.3. By Preparation

            18.16.2.4. By Form

            18.16.2.5. By Application

    18.17. New Zealand

        18.17.1. Pricing Analysis

        18.17.2. Market Share Analysis, 2022

            18.17.2.1. By Source

            18.17.2.2. By Property

            18.17.2.3. By Preparation

            18.17.2.4. By Form

            18.17.2.5. By Application

    18.18. China

        18.18.1. Pricing Analysis

        18.18.2. Market Share Analysis, 2022

            18.18.2.1. By Source

            18.18.2.2. By Property

            18.18.2.3. By Preparation

            18.18.2.4. By Form

            18.18.2.5. By Application

    18.19. Japan

        18.19.1. Pricing Analysis

        18.19.2. Market Share Analysis, 2022

            18.19.2.1. By Source

            18.19.2.2. By Property

            18.19.2.3. By Preparation

            18.19.2.4. By Form

            18.19.2.5. By Application

    18.20. South Korea

        18.20.1. Pricing Analysis

        18.20.2. Market Share Analysis, 2022

            18.20.2.1. By Source

            18.20.2.2. By Property

            18.20.2.3. By Preparation

            18.20.2.4. By Form

            18.20.2.5. By Application

    18.21. GCC Countries

        18.21.1. Pricing Analysis

        18.21.2. Market Share Analysis, 2022

            18.21.2.1. By Source

            18.21.2.2. By Property

            18.21.2.3. By Preparation

            18.21.2.4. By Form

            18.21.2.5. By Application

    18.22. South Africa

        18.22.1. Pricing Analysis

        18.22.2. Market Share Analysis, 2022

            18.22.2.1. By Source

            18.22.2.2. By Property

            18.22.2.3. By Preparation

            18.22.2.4. By Form

            18.22.2.5. By Application

    18.23. Israel

        18.23.1. Pricing Analysis

        18.23.2. Market Share Analysis, 2022

            18.23.2.1. By Source

            18.23.2.2. By Property

            18.23.2.3. By Preparation

            18.23.2.4. By Form

            18.23.2.5. By Application

19. Market Structure Analysis

    19.1. Competition Dashboard

    19.2. Competition Benchmarking

    19.3. Market Share Analysis of Top Players

        19.3.1. By Regional

        19.3.2. By Source

        19.3.3. By Property

        19.3.4. By Preparation

        19.3.5. By Form

        19.3.6. By Application

20. Competition Analysis

    20.1. Competition Deep Dive

        20.1.1. Eastman Chemical Company

            20.1.1.1. Overview

            20.1.1.2. Product Portfolio

            20.1.1.3. Profitability by Market Segments

            20.1.1.4. Sales Footprint

            20.1.1.5. Strategy Overview

                20.1.1.5.1. Marketing Strategy

                20.1.1.5.2. Product Strategy

                20.1.1.5.3. Channel Strategy

        20.1.2. Cargill

            20.1.2.1. Overview

            20.1.2.2. Product Portfolio

            20.1.2.3. Profitability by Market Segments

            20.1.2.4. Sales Footprint

            20.1.2.5. Strategy Overview

                20.1.2.5.1. Marketing Strategy

                20.1.2.5.2. Product Strategy

                20.1.2.5.3. Channel Strategy

        20.1.3. ADM Wild Flavours

            20.1.3.1. Overview

            20.1.3.2. Product Portfolio

            20.1.3.3. Profitability by Market Segments

            20.1.3.4. Sales Footprint

            20.1.3.5. Strategy Overview

                20.1.3.5.1. Marketing Strategy

                20.1.3.5.2. Product Strategy

                20.1.3.5.3. Channel Strategy

        20.1.4. Alano

            20.1.4.1. Overview

            20.1.4.2. Product Portfolio

            20.1.4.3. Profitability by Market Segments

            20.1.4.4. Sales Footprint

            20.1.4.5. Strategy Overview

                20.1.4.5.1. Marketing Strategy

                20.1.4.5.2. Product Strategy

                20.1.4.5.3. Channel Strategy

        20.1.5. Gat Foods

            20.1.5.1. Overview

            20.1.5.2. Product Portfolio

            20.1.5.3. Profitability by Market Segments

            20.1.5.4. Sales Footprint

            20.1.5.5. Strategy Overview

                20.1.5.5.1. Marketing Strategy

                20.1.5.5.2. Product Strategy

                20.1.5.5.3. Channel Strategy

        20.1.6. GLCC Co.

            20.1.6.1. Overview

            20.1.6.2. Product Portfolio

            20.1.6.3. Profitability by Market Segments

            20.1.6.4. Sales Footprint

            20.1.6.5. Strategy Overview

                20.1.6.5.1. Marketing Strategy

                20.1.6.5.2. Product Strategy

                20.1.6.5.3. Channel Strategy

        20.1.7. Kerry Ingredients Givaudan Canada Co.

            20.1.7.1. Overview

            20.1.7.2. Product Portfolio

            20.1.7.3. Profitability by Market Segments

            20.1.7.4. Sales Footprint

            20.1.7.5. Strategy Overview

                20.1.7.5.1. Marketing Strategy

                20.1.7.5.2. Product Strategy

                20.1.7.5.3. Channel Strategy

        20.1.8. Danisco (DuPont)

            20.1.8.1. Overview

            20.1.8.2. Product Portfolio

            20.1.8.3. Profitability by Market Segments

            20.1.8.4. Sales Footprint

            20.1.8.5. Strategy Overview

                20.1.8.5.1. Marketing Strategy

                20.1.8.5.2. Product Strategy

                20.1.8.5.3. Channel Strategy

        20.1.9. Chr. Hansen Holding A/S

            20.1.9.1. Overview

            20.1.9.2. Product Portfolio

            20.1.9.3. Profitability by Market Segments

            20.1.9.4. Sales Footprint

            20.1.9.5. Strategy Overview

                20.1.9.5.1. Marketing Strategy

                20.1.9.5.2. Product Strategy

                20.1.9.5.3. Channel Strategy

        20.1.10. Flachsmann Flavors and Extracts

            20.1.10.1. Overview

            20.1.10.2. Product Portfolio

            20.1.10.3. Profitability by Market Segments

            20.1.10.4. Sales Footprint

            20.1.10.5. Strategy Overview

                20.1.10.5.1. Marketing Strategy

                20.1.10.5.2. Product Strategy

                20.1.10.5.3. Channel Strategy

21. Assumptions & Acronyms Used

22. Research Methodology
Recommendations

Food and Beverage

Beverage Flavoring Agent Market

June 2022

REP-GB-14892

July 2024

300 pages

Process Automation

Beverage Processing Equipment Market

April 2020

REP-GB-2951

January 2023

250 pages

Explore Food and Beverage Insights

View Reports
Future Market Insights

Beverage Clouding Agent Market