Beverage Acidulants Market
Market Insights on Beverage Acidulants covering sales outlook, demand forecast & up-to-date key trends
Beverage Acidulants Market by Type (Citric Acid, Acetic Acid), Form (Powder, Liquid), Nature (Synthetic, Organic) & Region - Forecast 2022 - 2032
Beverage Acidulants Market Snapshot
[350 Pages Report] Beverage acidulants are used to improve flavor, taste, and shelf-life, and to keep the color and texture of food and beverage products. Acidulants are widely used in the food and beverage industry.
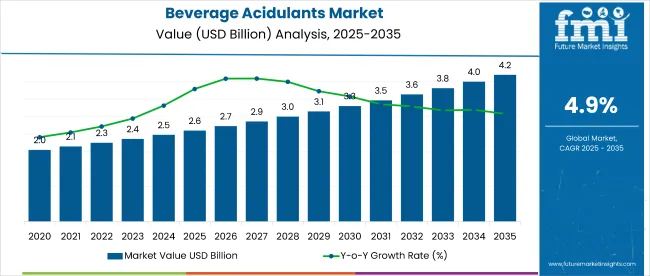
According to new research from Future Market Insights' beverage acidulants market report, the worldwide beverage acidulants market is expected to be worth USD 2.3 Bn in 2022 and USD 3.5 Bn by 2032, with a CAGR of 4.5%.
Beverage Acidulants Market Size Value in 2022 |
USD ~2.3 Bn |
Beverage Acidulants Market Forecast Value in 2032 |
USD ~3.5 Bn |
Global Growth Rate (2022 to 2032) |
~4.5% CAGR |
Forecast Period |
2022-2032 |
Acetic acid, fumaric acid, and lactic acid are the three key types of beverage acidulants. Demand for these acidulants is likely to remain high.
Let us know your requirement to get
100% FREE customization
How The Market Progressed Till June 2022?
Market Statistics |
Details |
H1,2021 (A) |
4.5% |
H1,2022 Projected (P) |
4.5% |
H1,2022 Outlook (O) |
5.0% |
BPS Change : H1,2022 (O) - H1,2022 (P) |
(+) 45 ↑ |
BPS Change : H1,2022 (O) - H1,2021 (A) |
(+) 49.5 ↑ |
The growth rates of the global market and its potential for future expansion are compared and evaluated by FMI every six months. Certain demographic and innovative elements of the market are dominant as a result of the subjective effects of macro- and industry-level variables.
Consumers are becoming more and more conscious of the value of keeping a healthy lifestyle. Organic beverage acidulants, such those based on citric acid, are often used as additives in beverages since they are naturally derived preservatives.
The growth of the processed beverage industry is advantageous for the market for beverage acidulants. One of the key reasons anticipated to drive the growth of the global market for beverage acidulants is the rise of the beverage processing industry in various emerging and underdeveloped countries.
Some new developments that have taken place in these markets include
- Princeton-based Bai Brands introduced the fruit-flavored Bai Supertea. These freshly prepared, flavoured teas have fruit juice and antioxidants added. To increase the fruitiness of the teas, ingredients like citric acid and malic acid are added, and the overall flavour profile is also balanced.
- A well-known oil business, BP plc, announced plans to build a top-notch acetic acid facility in Duqm. It ought to aid them in developing a new range of beverage acidulants.
- Citrus fruits naturally contain acidulants. People are turning more and more toward beverages manufactured with naturally sourced ingredients in recent years as they become more aware of the risks and negative effects of synthetic and non-natural acids.
The global Beverage Acidulants Market expanded by 4.5% during the first half of 2021. However, not all areas have seen this rise equally; the developing markets have seen rate of growth of 5.0 % (H1 2022 Expected). As a result, there will be a 49.5 BPS point difference between H1 2022's expected growth and predicted growth.
The main element affecting the growth of the global food and beverage sector is the rising worldwide population. Since the last ten years, the global beverage business has experienced rapid growth. The market for beverage acidulants is being driven by the rising demand for beverage products in North America and Latin America, particularly aerated drinks and energy drinks.
The growth of the processed beverage industry is advantageous for the market for beverage acidulants. One of the key reasons anticipated to drive the growth of the global market for beverage acidulants is the rise of the beverage processing industry in various emerging and underdeveloped countries.
Citric Acid Beverage Acidulants to Continue Holding Pole Position
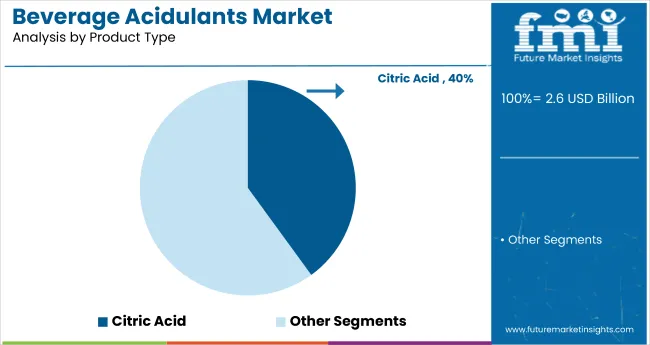
There are many different types of beverage acidulants on the market, including acetic acid, phosphorous acid, citric acid, and others, each with its own flavour, concentration, and usage restriction. The citric acid-based beverage acidulant is the most widely used acidulant in beverages. It is, without a doubt, the most important, versatile, and widely utilized organic acid. Citric acid-based beverage acidulants are used in soft drinks and desserts to produce a strong flavor.
Citric acid is sourced from limes and lemons, although it is currently commercially generated by fermentation. Beverage acidulants based on phosphoric acid are the second most commonly used acidulants in the beverage sector. Cola drinks are the most common end-product for which they are employed. Cola drinks are expected to be the most popular flavored soft drinks worldwide. These have a sharp, stinging flavor that goes well with cola.
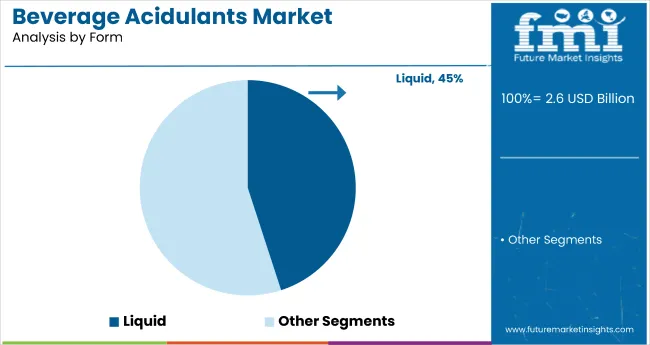
The beverage acidulants market is divided into powder, liquid, and granules based on their form. The granule form of beverage acidulants is gaining traction, and the beverage acidulants market is expected to increase at a relatively fast rate throughout the projected period.
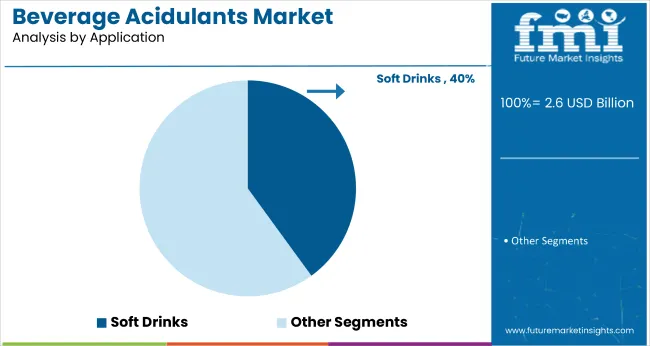
The beverage acidulants market is also divided into soft drinks, dairy-based beverages, fruit juices and concentrates, alcoholic beverages, and energy drinks based on application. The fruit juices and concentrates beverages market appears to be more resilient over the predicted period. Over the projected period, it is expected to maintain its large market share in the beverage acidulants market, however at a low rate of expansion.
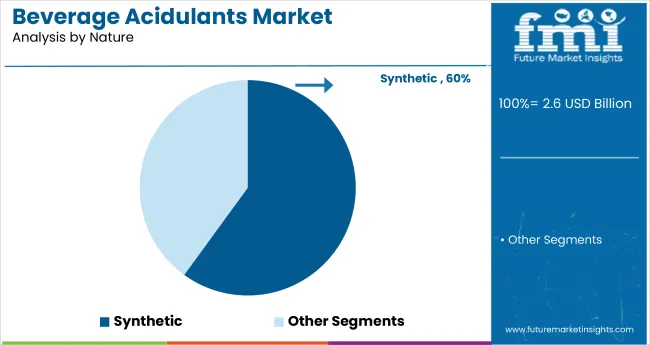
On the basis of nature, the beverage acidulants market is segregated into synthetic and organic. The organic segment is expected to be a hot prospect in the coming years, owing to the increased demand for natural and clean label food and beverage products. Major organic beverage acidulants include citric acid-based beverage acidulants, malic acid-based beverage acidulants, and tartaric acid-based beverage acidulants.
Beverage Acidulants Providing a Cost-Effective Solution to Food and Beverage Service Providers
The beverage acidulants market is further divided into synthetic and organic categories based on nature. Because of the rising demand for natural and clean label food and beverage items, the organic market is projected to be a hot potential in the approaching years.
Citric acid-based beverage acidulants, malic acid-based beverage acidulants, and tartaric acid-based beverage acidulants are all common organic beverage acidulants.
Find your sweet spots for generating winning opportunities in this market.
Talk to AnalystOrganic Beverage Acidulants Gaining Widespread Popularity
A growing number of consumers are becoming aware of the importance of maintaining a healthy lifestyle. Because organic beverage acidulants, such as citric acid-based beverage acidulants, are naturally derived preservatives, they are frequently employed in beverages as additives.
Almost all citrus fruits contain them naturally. As people become more aware of the dangers and side effects of synthetic and non-natural acids, they are gravitating toward beverages made with naturally sourced components.
The Beverage Acidulants Market is benefiting from the expansion of the processed beverage industry. The expansion of the beverage processing sector in various emerging and less-developed nations is one of the major factors expected to boost the global beverage acidulants market.
In countries with a rapidly increasing urban population such as India, China, and Brazil, and regions such as the Middle East, the demand for processed beverages is growing significantly. This is attributed to increasing in product visibility, adoption of retail formats, and launch of new and more beneficial products, owing to naturally-derived ingredients that offer various health benefits to consumers.
Beverage Acidulants Give an Enhanced Flavor and Shelf Life to Beverages
Beverage acidulants not only improve flavor, but also extend the shelf life of beverages. It also makes beverages taste better. Individual preferences are influenced by elements such as taste, shelf life, and flavor. The market for beverage acidulants is seeing a considerable boost thanks to rising demand for increased shelf-life and flavor in beverages.

An unified Market Research Subscription Platform, built for today’s disparate research needs.
Scope Of Report
Attribute |
Details |
Market Size Value in 2022 |
USD ~2.3 Bn |
Market Forecast Value in 2032 |
USD ~3.5 Bn |
Global Growth Rate |
~4.5% CAGR |
Forecast Period |
2022-2032 |
Historical Data Available for |
2017-2021 |
Market Analysis |
Tons for Volume and USD Bn for Value |
Key Regions Covered |
North America, Latin America, Europe, China Asia Pacific excluding China, and Middle East & Africa |
Key Countries Covered |
US, Canada, Brazil, Mexico, Germany, Italy, France, UK, Spain, BENELUX, Russia, China, India, South Korea, ASEAN, Japan, GCC countries, North Africa, South Africa. |
Key Market Segments Covered |
Product Type, Application, Form, Nature, and Region |
Key Companies Profiled |
|
Pricing |
Available upon Request |
Key Segment
Beverage Acidulants Market - By Product Type:
- Citric Acid
- Acetic Acid
- Fumaric Acid
- Lactic Acid
- Phosphoric Acid
- Malic Acid
- Tartaric Acid
- Others
Beverage Acidulants Market – By Application:
- Soft Drinks
- Dairy-based Beverages
- Fruit Juices and Concentrates
- Alcoholic Beverages
- Energy Drinks
Beverage Acidulants Market - By Form:
- Powder
- Liquid
- Granules
Beverage Acidulants Market - By Nature:
- Synthetic
- Organic
Beverage Acidulants Market - By Region:
- North America
- Latin America
- Europe
- China
- Asia Pacific excluding China
- Middle East & Africa
Frequently Asked Questions
The Beverage Acidulants market is growing at a CAGR of 4.5%.
The forecasted market size is expected to be USD 3.5 Bn for the forecasted year 2022-2032.
The major industry drivers are the demand for a modification in color and texture of food and beverage products and rising health consciousness.
Key strategies used by beverage acidulants market participants are product launches, mergers and acquisitions, joint ventures, and R&D activities.
North America, Latin America, Europe, China, Asia Pacific excluding China, and, Middle East & Africa are the major regions in the industry.
Europe region consumes the highest amount of beverage acidulants which is nearly 36.2%.
The most common type of beverage acidulant is citric acid.
The market’s major application segment includes fruit juices and concentrates.
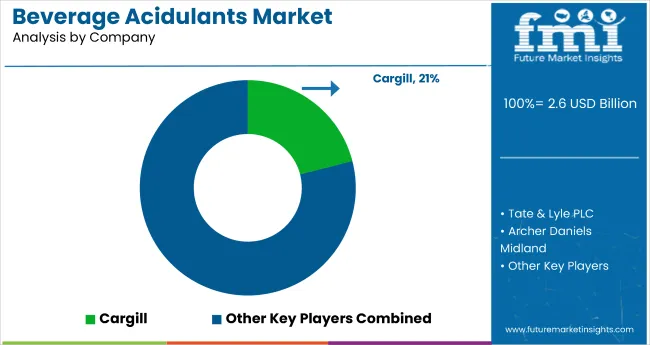
Some of the key market players in the Beverage Acidulants market are Tate and Lyle, Northeast Pharmaceutical Group Co., Ltd., Batory Nutra, Archer Daniels Midland, Corbion N.V., DairyChem, Hexagon Overseas, Parry Enterprises India Ltd., FBC Industries, Inc., Weifang Ensign Industry Co., Ltd., Isegen South Africa (Pty), Ltd., Jones Hamilton Co., Balchem Ingredient Solution, and others.
Table of Content
1. Market Overview
1.1. Market Coverage / Taxonomy
1.2. Market Definition / Scope / Limitations
2. The Massive Impact of the Crisis
2.1. Global Beverage Acidulants Market Forecast Scenario Comparison of Annual Growth Rates for short term (2022-2026) and Long Term (2027-2032)
2.1.1. Optimistic Scenario
2.1.1.1. China
2.1.1.2. US
2.1.1.3. India
2.1.1.4. Euro Zone
2.1.1.5. Asia Pacific
2.1.1.6. Rest of the World
2.1.2. Likely Scenario
2.1.2.1. China
2.1.2.2. US
2.1.2.3. India
2.1.2.4. Euro Zone
2.1.2.5. Asia Pacific
2.1.2.6. Rest of the World
2.1.3. Pessimistic Scenario
2.1.3.1. China
2.1.3.2. US
2.1.3.3. India
2.1.3.4. Euro Zone
2.1.3.5. Asia Pacific
2.1.3.6. Rest of the World
2.2. Key Factors Impacting the Market
2.3. Note: Market Assessment shall be Provided for Likely Scenario
3. Market Background
3.1. Drivers
3.1.1. Supply Side Drivers
3.1.2. Demand Side drivers
3.1.3. Economic Side Drivers
3.2. Restraints
3.3. Opportunity
3.4. Market Trends By Region
3.5. Product Launches
3.6. Product Claims & Nutritional Information Scan by Buyers
3.7. Macro-Economic Factors
3.8. Forecast Factors - Relevance & Impact
3.9. Consumers Survey Analysis
4. Key Regulations
4.1. Distribution Channel & Labelling Regulations
4.2. Certifications and Certifying Agency Overview
4.3. Import/Export Policies
5. Global Beverage Acidulants Market Demand Analysis 2017-2021 and Forecast, 2022-2032
5.1. Historical Market Volume (TONS) Analysis, 2017-2021
5.2. Current and Future Market Volume (TONS) Projections, 2022-2032
5.3. Y-o-Y Growth Trend Analysis
6. Global Beverage Acidulants Market - Pricing Analysis
6.1. Regional Pricing Analysis (USD/TONS) By Product Product Type (2017,2022,2032)
6.1.1. Citric Acid
6.1.2. Acetic Acid
6.1.3. Fumaric Acid
6.1.4. Lactic Acid
6.1.5. Phosphoric Acid
6.1.6. Malic Acid
6.1.7. Tartaric Acid
6.1.8. Others
6.2. Pricing Break-up (2017,2022,2032)
6.2.1. Producer Level Pricing
6.2.2. Distributor Level Pricing
6.2.3. Retailer Level Pricing
6.3. Global Average Pricing Analysis Benchmark
7. Global Beverage Acidulants Market Demand (Size in USD Bn) Analysis 2017-2021 and Forecast, 2022-2032
7.1. Historical Market Value (USD Bn) Analysis, 2017-2021
7.2. Current and Future Market Value (USD Bn) Projections, 2022-2032
7.2.1. Y-o-Y Growth Trend Analysis
7.2.2. Absolute $ Opportunity Analysis
8. Global Beverage Acidulants Market Analysis 2017-2021 and Forecast 2022-2032, By Product Product Type
8.1. Introduction / Key Findings
8.2. Historical Market Size (USD Bn) and Volume Analysis By Product Type, 2017-2021
8.3. Current and Future Market Size (USD Bn) and Volume Analysis and Forecast By Product Type, 2022-2032
8.3.1. Citric Acid
8.3.2. Acetic Acid
8.3.3. Fumaric Acid
8.3.4. Lactic Acid
8.3.5. Phosphoric Acid
8.3.6. Malic Acid
8.3.7. Tartaric Acid
8.3.8. Others
8.4. Market Attractiveness Analysis By Product Type
9. Global Beverage Acidulants Market Analysis 2017-2021 and Forecast 2022-2032, By Application
9.1. Introduction / Key Findings
9.2. Historical Market Size (USD Bn) and Volume Analysis By Application, 2017-2021
9.3. Current and Future Market Size (USD Bn) and Volume Analysis and Forecast By Application, 2022-2032
9.3.1. Soft Drinks
9.3.2. Dairy-based Beverages
9.3.3. Fruit Juices and Concentrates
9.3.4. Alcoholic Beverages
9.3.5. Energy Drinks
9.4. Market Attractiveness Analysis By Application
10. Global Beverage Acidulants Market Analysis 2017-2021 and Forecast 2022-2032, By Form
10.1. Introduction / Key Findings
10.2. Historical Market Size (USD Bn) and Volume Analysis By Form, 2017-2021
10.3. Current and Future Market Size (USD Bn) and Volume Analysis and Forecast By Form, 2022-2032
10.3.1. Powder
10.3.2. Liquid
10.3.3. Granules
10.4. Market Attractiveness Analysis By Form
11. Global Beverage Acidulants Market Analysis 2017-2021 and Forecast 2022-2032, By Nature
11.1. Introduction / Key Findings
11.2. Historical Market Size (USD Bn) and Volume Analysis By Nature, 2017-2021
11.3. Current and Future Market Size (USD Bn) and Volume Analysis and Forecast By Nature, 2022-2032
11.3.1. Synthetic
11.3.2. Organic
11.4. Market Attractiveness Analysis By Nature
12. Global Beverage Acidulants Market Analysis 2017-2021 and Forecast 2022-2032, By Region
12.1. Introduction
12.2. Historical Market Size (USD Bn) and Volume Analysis By Region, 2017-2021
12.3. Current Market Size (USD Bn) and Volume Analysis and Forecast By Region, 2022-2032
12.3.1. North America
12.3.2. Latin America
12.3.3. Europe
12.3.4. South Asia
12.3.5. East Asia
12.3.6. Oceania
12.3.7. MEA
12.4. Market Attractiveness Analysis By Region
13. North America Beverage Acidulants Market Analysis 2017-2021 and Forecast 2022-2032
13.1. Introduction
13.2. Pricing Analysis
13.3. Historical Market Size (USD Bn) and Volume Trend Analysis By Market Taxonomy, 2017-2021
13.4. Market Size (USD Bn) and Volume Forecast By Market Taxonomy, 2022-2032
13.4.1. By Country
13.4.1.1. US
13.4.1.2. Canada
13.4.2. By Product Type
13.4.3. By Application
13.4.4. By Form
13.4.5. By Nature
13.5. Market Attractiveness Analysis
13.5.1. By Product Type
13.5.2. By Application
13.5.3. By Form
13.5.4. By Nature
13.6. Market Trends
13.7. Key Market Participants - Intensity Mapping
13.8. Drivers and Restraints - Impact Analysis
14. Latin America Beverage Acidulants Market Analysis 2017-2021 and Forecast 2022-2032
14.1. Introduction
14.2. Pricing Analysis
14.3. Historical Market Size (USD Bn) and Volume Trend Analysis By Market Taxonomy, 2017-2021
14.4. Market Size (USD Bn) and Volume Forecast By Market Taxonomy, 2022-2032
14.4.1. By Country
14.4.1.1. Brazil
14.4.1.2. Mexico
14.4.1.3. Rest of Latin America
14.4.2. By Product Type
14.4.3. By Application
14.4.4. By Form
14.4.5. By Nature
14.5. Market Attractiveness Analysis
14.5.1. By Product Type
14.5.2. By Application
14.5.3. By Form
14.5.4. By Nature
14.6. Market Trends
14.7. Key Market Participants - Intensity Mapping
14.8. Drivers and Restraints - Impact Analysis
15. Europe Beverage Acidulants Market Analysis 2017-2021 and Forecast 2022-2032
15.1. Introduction
15.2. Pricing Analysis
15.3. Historical Market Size (USD Bn) and Volume Trend Analysis By Market Taxonomy, 2017-2021
15.4. Market Size (USD Bn) and Volume Forecast By Market Taxonomy, 2022-2032
15.4.1. By Country
15.4.1.1. Germany
15.4.1.2. Italy
15.4.1.3. France
15.4.1.4. UK
15.4.1.5. Spain
15.4.1.6. BENELUX
15.4.1.7. Russia
15.4.1.8. Rest of Europe
15.4.2. By Product Type
15.4.3. By Application
15.4.4. By Form
15.4.5. By Nature
15.5. Market Attractiveness Analysis
15.5.1. By Product Type
15.5.2. By Application
15.5.3. By Form
15.5.4. By Nature
15.6. Market Trends
15.7. Key Market Participants - Intensity Mapping
15.8. Drivers and Restraints - Impact Analysis
16. China Beverage Acidulants Market Analysis 2017-2021 and Forecast 2022-2032
16.1. Introduction
16.2. Pricing Analysis
16.3. Historical Market Size (USD Bn) and Volume Trend Analysis By Market Taxonomy, 2017-2021
16.4. Market Size (USD Bn) and Volume Forecast By Market Taxonomy, 2022-2032
16.4.1. By Country
16.4.2. By Product Type
16.4.3. By Application
16.4.4. By Form
16.4.5. By Nature
16.5. Market Attractiveness Analysis
16.5.1. By Product Type
16.5.2. By Application
16.5.3. By Form
16.5.4. By Nature
16.6. Market Trends
16.7. Key Market Participants - Intensity Mapping
16.8. Drivers and Restraints - Impact Analysis
17. Asia Pacific Beverage Acidulants Market Analysis 2017-2021 and Forecast 2022-2032
17.1. Introduction
17.2. Pricing Analysis
17.3. Historical Market Size (USD Bn) and Volume Trend Analysis By Market Taxonomy, 2017-2021
17.4. Market Size (USD Bn) and Volume Forecast By Market Taxonomy, 2022-2032
17.4.1. By Country
17.4.1.1. India
17.4.1.2. Japan
17.4.1.3. South Korea
17.4.1.4. Australia & New Zealand
17.4.1.5. ASEAN Countries
17.4.1.6. Rest of Asia Pacific
17.4.2. By Product Type
17.4.3. By Application
17.4.4. By Form
17.4.5. By Nature
17.5. Market Attractiveness Analysis
17.5.1. By Product Type
17.5.2. By Application
17.5.3. By Form
17.5.4. By Nature
17.6. Market Trends
17.7. Key Market Participants - Intensity Mapping
17.8. Drivers and Restraints - Impact Analysis
18. Middle East and Africa Beverage Acidulants Market Analysis 2017-2021 and Forecast 2022-2032
18.1. Introduction
18.2. Pricing Analysis
18.3. Historical Market Size (USD Bn) and Volume Trend Analysis By Market Taxonomy, 2017-2021
18.4. Market Size (USD Bn) and Volume Forecast By Market Taxonomy, 2022-2032
18.4.1. By Country
18.4.1.1. GCC Countries
18.4.1.2. North Africa
18.4.1.3. South Africa
18.4.1.4. Rest of MEA
18.4.2. By Product Type
18.4.3. By Application
18.4.4. By Form
18.4.5. By Nature
18.5. Market Attractiveness Analysis
18.5.1. By Product Type
18.5.2. By Application
18.5.3. By Form
18.5.4. By Nature
18.6. Market Trends
18.7. Key Market Participants - Intensity Mapping
18.8. Drivers and Restraints - Impact Analysis
19. Key Countries Beverage Acidulants Market Analysis 2017–2021and Forecast 2022–2032
19.1. US
19.1.1. Pricing Analysis (2017, 2022, 2032)
19.1.2. Market Value and Volume Analysis 2017–2021and Forecast 2022–2032
19.1.2.1. By Product Type
19.1.2.2. By Application
19.1.2.3. By Form
19.1.2.4. By Nature
19.2. Canada
19.2.1. Pricing Analysis (2017, 2022, 2032)
19.2.2. Market Value and Volume Analysis 2017–2021and Forecast 2022–2032
19.2.2.1. By Product Type
19.2.2.2. By Application
19.2.2.3. By Form
19.2.2.4. By Nature
19.3. Brazil
19.3.1. Pricing Analysis (2017, 2022, 2032)
19.3.2. Market Value and Volume Analysis 2017–2021and Forecast 2022–2032
19.3.2.1. By Product Type
19.3.2.2. By Application
19.3.2.3. By Form
19.3.2.4. By Nature
19.4. Germany
19.4.1. Pricing Analysis (2017, 2022, 2032)
19.4.2. Market Value and Volume Analysis 2017–2021and Forecast 2022–2032
19.4.2.1. By Product Type
19.4.2.2. By Application
19.4.2.3. By Form
19.4.2.4. By Nature
19.5. Italy
19.5.1. Pricing Analysis (2017, 2022, 2032)
19.5.2. Market Value and Volume Analysis 2017–2021and Forecast 2022–2032
19.5.2.1. By Product Type
19.5.2.2. By Application
19.5.2.3. By Form
19.5.2.4. By Nature
19.6. France
19.6.1. Pricing Analysis (2017, 2022, 2032)
19.6.2. Market Value and Volume Analysis 2017–2021and Forecast 2022–2032
19.6.2.1. By Product Type
19.6.2.2. By Application
19.6.2.3. By Form
19.6.2.4. By Nature
19.7. UK
19.7.1. Pricing Analysis (2017, 2022, 2032)
19.7.2. Market Value and Volume Analysis 2017–2021and Forecast 2022–2032
19.7.2.1. By Product Type
19.7.2.2. By Application
19.7.2.3. By Form
19.7.2.4. By Nature
19.8. Spain
19.8.1. Pricing Analysis (2017, 2022, 2032)
19.8.2. Market Value and Volume Analysis 2017–2021and Forecast 2022–2032
19.8.2.1. By Product Type
19.8.2.2. By Application
19.8.2.3. By Form
19.8.2.4. By Nature
19.9. BENELUX
19.9.1. Pricing Analysis (2017, 2022, 2032)
19.9.2. Market Value and Volume Analysis 2017–2021and Forecast 2022–2032
19.9.2.1. By Product Type
19.9.2.2. By Application
19.9.2.3. By Form
19.9.2.4. By Nature
19.10. Russia
19.10.1. Pricing Analysis (2017, 2022, 2032)
19.10.2. Market Value and Volume Analysis 2017–2021and Forecast 2022–2032
19.10.2.1. By Product Type
19.10.2.2. By Application
19.10.2.3. By Form
19.10.2.4. By Nature
19.11. China
19.11.1. Pricing Analysis (2017, 2022, 2032)
19.11.2. Market Value and Volume Analysis 2017–2021and Forecast 2022–2032
19.11.2.1. By Product Type
19.11.2.2. By Application
19.11.2.3. By Form
19.11.2.4. By Nature
19.12. Japan
19.12.1. Pricing Analysis (2017, 2022, 2032)
19.12.2. Market Value and Volume Analysis 2017–2021and Forecast 2022–2032
19.12.2.1. By Product Type
19.12.2.2. By Application
19.12.2.3. By Form
19.12.2.4. By Nature
19.13. South Korea
19.13.1. Pricing Analysis (2017, 2022, 2032)
19.13.2. Market Value and Volume Analysis 2017–2021and Forecast 2022–2032
19.13.2.1. By Product Type
19.13.2.2. By Application
19.13.2.3. By Form
19.13.2.4. By Nature
19.14. India
19.14.1. Pricing Analysis (2017, 2022, 2032)
19.14.2. Market Value and Volume Analysis 2017–2021and Forecast 2022–2032
19.14.2.1. By Product Type
19.14.2.2. By Application
19.14.2.3. By Form
19.14.2.4. By Nature
19.15. ASEAN
19.15.1. Pricing Analysis (2017, 2022, 2032)
19.15.2. Market Value and Volume Analysis 2017–2021and Forecast 2022–2032
19.15.2.1. By Product Type
19.15.2.2. By Application
19.15.2.3. By Form
19.15.2.4. By Nature
19.16. Australia and New Zealand
19.16.1. Pricing Analysis (2017, 2022, 2032)
19.16.2. Market Value and Volume Analysis 2017–2021and Forecast 2022–2032
19.16.2.1. By Product Type
19.16.2.2. By Application
19.16.2.3. By Form
19.16.2.4. By Nature
19.17. GCC Countries
19.17.1. Pricing Analysis (2017, 2022, 2032)
19.17.2. Market Value and Volume Analysis 2017–2021and Forecast 2022–2032
19.17.2.1. By Product Type
19.17.2.2. By Application
19.17.2.3. By Form
19.17.2.4. By Nature
19.18. North Africa
19.18.1. Pricing Analysis (2017, 2022, 2032)
19.18.2. Market Value and Volume Analysis 2017–2021and Forecast 2022–2032
19.18.2.1. By Product Type
19.18.2.2. By Application
19.18.2.3. By Form
19.18.2.4. By Nature
19.19. South Africa
19.19.1. Pricing Analysis (2017, 2022, 2032)
19.19.2. Market Value and Volume Analysis 2017–2021and Forecast 2022–2032
19.19.2.1. By Product Type
19.19.2.2. By Application
19.19.2.3. By Form
19.19.2.4. By Nature
20. Market Structure Analysis
20.1. Market Analysis by Tier of Companies
20.2. Company Share Analysis of Top Players
20.2.1. By Product Type
20.2.2. By Region
20.3. Market Presence Analysis
20.3.1. By Regional Footprint of Players
20.3.2. Product Footprint by Players
20.3.3. Channel Footprint by Players
21. Competition Deep Dive (Tentative List)
21.1. Competition Deep Dive
21.1.1. Balchem Ingredient Solution
21.1.1.1. Product Portfolio
21.1.1.2. Profitability by Market Segments
21.1.1.3. Sales Footprint
21.1.1.4. Strategy Overview
21.1.1.5. Product Strategy
21.1.2. Tate and Lyle
21.1.2.1. Product Portfolio
21.1.2.2. Profitability by Market Segments
21.1.2.3. Sales Footprint
21.1.2.4. Strategy Overview
21.1.2.5. Product Strategy
21.1.3. Northeast Pharmaceutical Group Co., Ltd.
21.1.3.1. Product Portfolio
21.1.3.2. Profitability by Market Segments
21.1.3.3. Sales Footprint
21.1.3.4. Strategy Overview
21.1.3.5. Product Strategy
21.1.4. Batory Nutra
21.1.4.1. Product Portfolio
21.1.4.2. Profitability by Market Segments
21.1.4.3. Sales Footprint
21.1.4.4. Strategy Overview
21.1.4.5. Product Strategy
21.1.5. Archer Daniels Midland
21.1.5.1. Product Portfolio
21.1.5.2. Profitability by Market Segments
21.1.5.3. Sales Footprint
21.1.5.4. Strategy Overview
21.1.5.5. Product Strategy
21.1.6. Corbion N.V.
21.1.6.1. Product Portfolio
21.1.6.2. Profitability by Market Segments
21.1.6.3. Sales Footprint
21.1.6.4. Strategy Overview
21.1.6.5. Product Strategy
21.1.7. DairyChem
21.1.7.1. Product Portfolio
21.1.7.2. Profitability by Market Segments
21.1.7.3. Sales Footprint
21.1.7.4. Strategy Overview
21.1.7.5. Product Strategy
21.1.8. Hexagon Overseas
21.1.8.1. Product Portfolio
21.1.8.2. Profitability by Market Segments
21.1.8.3. Sales Footprint
21.1.8.4. Strategy Overview
21.1.8.5. Product Strategy
21.1.9. Parry Enterprises India Ltd.
21.1.9.1. Product Portfolio
21.1.9.2. Profitability by Market Segments
21.1.9.3. Sales Footprint
21.1.9.4. Strategy Overview
21.1.9.5. Product Strategy
21.1.10. FBC Industries, Inc.
21.1.10.1. Product Portfolio
21.1.10.2. Profitability by Market Segments
21.1.10.3. Sales Footprint
21.1.10.4. Strategy Overview
21.1.10.5. Product Strategy
21.1.11. Weifang Ensign Industry Co., Ltd.
21.1.11.1. Product Portfolio
21.1.11.2. Profitability by Market Segments
21.1.11.3. Sales Footprint
21.1.11.4. Strategy Overview
21.1.11.5. Product Strategy
21.1.12. Isegen South Africa (Pty), Ltd.
21.1.12.1. Product Portfolio
21.1.12.2. Profitability by Market Segments
21.1.12.3. Sales Footprint
21.1.12.4. Strategy Overview
21.1.12.5. Product Strategy
21.1.13. Jones Hamilton Co.
21.1.13.1. Product Portfolio
21.1.13.2. Profitability by Market Segments
21.1.13.3. Sales Footprint
21.1.13.4. Strategy Overview
21.1.13.5. Product Strategy
21.1.14. Others on Additional Request
21.1.14.1. Product Portfolio
21.1.14.2. Profitability by Market Segments
21.1.14.3. Sales Footprint
21.1.14.4. Strategy Overview
21.1.14.5. Product Strategy
Note: Above list is subjected to change during the course of study
22. Assumptions and Acronyms Used
23. Research Methodology
Let us know your requirement to get
100% FREE customization
List of Tables
Table 1: Global Beverage Acidulants Market Value (US$ Mn) and Forecast by Region, 2017–2021
Table 2: Global Beverage Acidulants Market Value (US$ Mn) and Forecast by Region, 2022–2032
Table 3: Global Beverage Acidulants Market Volume (MT ) and Forecast by Region, 2017–2021
Table 4: Global Beverage Acidulants Market Volume (MT ) and Forecast by Region, 2022–2032
Table 5: Global Beverage Acidulants Market Value (US$ Mn) and Forecast by Product Type, 2017–2021
Table 6: Global Beverage Acidulants Market Value (US$ Mn) and Forecast by Product Type, 2022–2032
Table 7: Global Beverage Acidulants Market Volume (MT ) and Forecast by Product Type, 2017–2021
Table 8: Global Beverage Acidulants Market Volume (MT ) and Forecast by Product Type, 2022–2032
Table 9: Global Beverage Acidulants Market Value (US$ Mn) and Forecast by Application, 2017–2021
Table 10: Global Beverage Acidulants Market Value (US$ Mn) and Forecast by Application, 2022–2032
Table 11: Global Beverage Acidulants Market Volume (MT ) and Forecast by Application, 2017–2021
Table 12: Global Beverage Acidulants Market Volume (MT ) and Forecast by Application, 2022–2032
Table 13: Global Beverage Acidulants Market Value (US$ Mn) and Forecast by Form, 2017–2021
Table 14: Global Beverage Acidulants Market Value (US$ Mn) and Forecast by Form, 2022–2032
Table 15: Global Beverage Acidulants Market Volume (MT ) and Forecast by Form, 2017–2021
Table 16: Global Beverage Acidulants Market Volume (MT ) and Forecast by Form, 2022–2032
Table 17: Global Beverage Acidulants Market Value (US$ Mn) and Forecast by Nature, 2017–2021
Table 18: Global Beverage Acidulants Market Value (US$ Mn) and Forecast by Nature, 2022–2032
Table 19: Global Beverage Acidulants Market Volume (MT ) and Forecast by Nature, 2017–2021
Table 20: Global Beverage Acidulants Market Volume (MT ) and Forecast by Nature, 2022–2032
Table 21: North America Beverage Acidulants Market Value (US$ Mn) and Forecast by Country, 2017–2021
Table 22: North America Beverage Acidulants Market Value (US$ Mn) and Forecast by Country, 2022–2032
Table 23: North America Beverage Acidulants Market Volume (MT ) and Forecast by Country, 2017–2021
Table 24: North America Beverage Acidulants Market Volume (MT ) and Forecast by Country, 2022–2032
Table 25: North America Beverage Acidulants Market Value (US$ Mn) and Forecast by Product Type , 2017–2021
Table 26: North America Beverage Acidulants Market Value (US$ Mn) and Forecast by Product Type , 2022–2032
Table 27: North America Beverage Acidulants Market Volume (MT ) and Forecast by Product Type , 2017–2021
Table 28: North America Beverage Acidulants Market Volume (MT ) and Forecast by Product Type , 2022–2032
Table 29: North America Beverage Acidulants Market Value (US$ Mn) and Forecast by Application, 2017–2021
Table 30: North America Beverage Acidulants Market Value (US$ Mn) and Forecast by Application, 2022–2032
Table 31: North America Beverage Acidulants Market Volume (MT ) and Forecast by Application, 2017–2021
Table 32: North America Beverage Acidulants Market Volume (MT ) and Forecast by Application, 2022–2032
Table 33: North America Beverage Acidulants Market Value (US$ Mn) and Forecast by Form, 2017–2021
Table 34: North America Beverage Acidulants Market Value (US$ Mn) and Forecast by Form, 2022–2032
Table 35: North America Beverage Acidulants Market Volume (MT ) and Forecast by Form, 2017–2021
Table 36: North America Beverage Acidulants Market Volume (MT ) and Forecast by Form, 2022–2032
Table 37: North America Beverage Acidulants Market Value (US$ Mn) and Forecast by Nature, 2017–2021
Table 38: North America Beverage Acidulants Market Value (US$ Mn) and Forecast by Nature, 2022–2032
Table 39: North America Beverage Acidulants Market Volume (MT ) and Forecast by Nature, 2017–2021
Table 40: North America Beverage Acidulants Market Volume (MT ) and Forecast by Nature, 2022–2032
Table 41: Latin America Beverage Acidulants Market Value (US$ Mn) and Forecast by Country, 2017–2021
Table 42: Latin America Beverage Acidulants Market Value (US$ Mn) and Forecast by Country, 2022–2032
Table 43: Latin America Beverage Acidulants Market Volume (MT ) and Forecast by Country, 2017–2021
Table 44: Latin America Beverage Acidulants Market Volume (MT ) and Forecast by Country, 2022–2032
Table 45: Latin America Beverage Acidulants Market Value (US$ Mn) and Forecast by Product Type , 2017–2021
Table 46: Latin America Beverage Acidulants Market Value (US$ Mn) and Forecast by Product Type , 2022–2032
Table 47: Latin America Beverage Acidulants Market Volume (MT ) and Forecast by Product Type , 2017–2021
Table 48: Latin America Beverage Acidulants Market Volume (MT ) and Forecast by Product Type , 2022–2032
Table 49: Latin America Beverage Acidulants Market Value (US$ Mn) and Forecast by Application, 2017–2021
Table 50: Latin America Beverage Acidulants Market Value (US$ Mn) and Forecast by Application, 2022–2032
Table 51: Latin America Beverage Acidulants Market Volume (MT ) and Forecast by Application, 2017–2021
Table 52: Latin America Beverage Acidulants Market Volume (MT ) and Forecast by Application, 2022–2032
Table 53: Latin America Beverage Acidulants Market Value (US$ Mn) and Forecast by Form, 2017–2021
Table 54: Latin America Beverage Acidulants Market Value (US$ Mn) and Forecast by Form, 2022–2032
Table 55: Latin America Beverage Acidulants Market Volume (MT ) and Forecast by Form, 2017–2021
Table 56: Latin America Beverage Acidulants Market Volume (MT ) and Forecast by Form, 2022–2032
Table 57: Latin America Beverage Acidulants Market Value (US$ Mn) and Forecast by Nature, 2017–2021
Table 58: Latin America Beverage Acidulants Market Value (US$ Mn) and Forecast by Nature, 2022–2032
Table 59: Latin America Beverage Acidulants Market Volume (MT ) and Forecast by Nature, 2017–2021
Table 60: Latin America Beverage Acidulants Market Volume (MT ) and Forecast by Nature, 2022–2032
Table 61: Europe Beverage Acidulants Market Value (US$ Mn) and Forecast by Country, 2017–2021
Table 62: Europe Beverage Acidulants Market Value (US$ Mn) and Forecast by Country, 2022–2032
Table 63: Europe Beverage Acidulants Market Volume (MT ) and Forecast by Country, 2017–2021
Table 64: Europe Beverage Acidulants Market Volume (MT ) and Forecast by Country, 2022–2032
Table 65: Europe Beverage Acidulants Market Value (US$ Mn) and Forecast by Product Type , 2017–2021
Table 66: Europe Beverage Acidulants Market Value (US$ Mn) and Forecast by Product Type , 2022–2032
Table 67: Europe Beverage Acidulants Market Volume (MT ) and Forecast by Product Type , 2017–2021
Table 68: Europe Beverage Acidulants Market Volume (MT ) and Forecast by Product Type , 2022–2032
Table 69: Europe Beverage Acidulants Market Value (US$ Mn) and Forecast by Application, 2017–2021
Table 70: Europe Beverage Acidulants Market Value (US$ Mn) and Forecast by Application, 2022–2032
Table 71: Europe Beverage Acidulants Market Volume (MT ) and Forecast by Application, 2017–2021
Table 72: Europe Beverage Acidulants Market Volume (MT ) and Forecast by Application, 2022–2032
Table 73: Europe Beverage Acidulants Market Value (US$ Mn) and Forecast by Form, 2017–2021
Table 74: Europe Beverage Acidulants Market Value (US$ Mn) and Forecast by Form, 2022–2032
Table 75: Europe Beverage Acidulants Market Volume (MT ) and Forecast by Form, 2017–2021
Table 76: Europe Beverage Acidulants Market Volume (MT ) and Forecast by Form, 2022–2032
Table 77: Europe Beverage Acidulants Market Value (US$ Mn) and Forecast by Nature, 2017–2021
Table 78: Europe Beverage Acidulants Market Value (US$ Mn) and Forecast by Nature, 2022–2032
Table 79: Europe Beverage Acidulants Market Volume (MT ) and Forecast by Nature, 2017–2021
Table 80: Europe Beverage Acidulants Market Volume (MT ) and Forecast by Nature, 2022–2032
Table 81: China Beverage Acidulants Market Value (US$ Mn) and Forecast by Product Type , 2017–2021
Table 82: China Beverage Acidulants Market Value (US$ Mn) and Forecast by Product Type , 2022–2032
Table 83: China Beverage Acidulants Market Volume (MT ) and Forecast by Product Type , 2017–2021
Table 84: China Beverage Acidulants Market Volume (MT ) and Forecast by Product Type , 2022–2032
Table 85: China Beverage Acidulants Market Value (US$ Mn) and Forecast by Application, 2017–2021
Table 86: China Beverage Acidulants Market Value (US$ Mn) and Forecast by Application, 2022–2032
Table 87: China Beverage Acidulants Market Volume (MT ) and Forecast by Application, 2017–2021
Table 88: China Beverage Acidulants Market Volume (MT ) and Forecast by Application, 2022–2032
Table 89: China Beverage Acidulants Market Value (US$ Mn) and Forecast by Form, 2017–2021
Table 90: China Beverage Acidulants Market Value (US$ Mn) and Forecast by Form, 2022–2032
Table 91: China Beverage Acidulants Market Volume (MT ) and Forecast by Form, 2017–2021
Table 92: China Beverage Acidulants Market Volume (MT ) and Forecast by Form, 2022–2032
Table 93: China Beverage Acidulants Market Value (US$ Mn) and Forecast by Nature, 2017–2021
Table 94: China Beverage Acidulants Market Value (US$ Mn) and Forecast by Nature, 2022–2032
Table 95: China Beverage Acidulants Market Volume (MT ) and Forecast by Nature, 2017–2021
Table 96: China Beverage Acidulants Market Volume (MT ) and Forecast by Nature, 2022–2032
Table 97: Asia Pacific Beverage Acidulants Market Value (US$ Mn) and Forecast by Country, 2017–2021
Table 98: Asia Pacific Beverage Acidulants Market Value (US$ Mn) and Forecast by Country, 2022–2032
Table 99: Asia Pacific Beverage Acidulants Market Volume (MT ) and Forecast by Country, 2017–2021
Table 100: Asia Pacific Beverage Acidulants Market Volume (MT ) and Forecast by Country, 2022–2032
Table 101: Asia Pacific Beverage Acidulants Market Value (US$ Mn) and Forecast by Product Type , 2017–2021
Table 102: Asia Pacific Beverage Acidulants Market Value (US$ Mn) and Forecast by Product Type , 2022–2032
Table 103: Asia Pacific Beverage Acidulants Market Volume (MT ) and Forecast by Product Type , 2017–2021
Table 104: Asia Pacific Beverage Acidulants Market Volume (MT ) and Forecast by Product Type , 2022–2032
Table 105: Asia Pacific Beverage Acidulants Market Value (US$ Mn) and Forecast by Application, 2017–2021
Table 106: Asia Pacific Beverage Acidulants Market Value (US$ Mn) and Forecast by Application, 2022–2032
Table 107: Asia Pacific Beverage Acidulants Market Volume (MT ) and Forecast by Application, 2017–2021
Table 108: Asia Pacific Beverage Acidulants Market Volume (MT ) and Forecast by Application, 2022–2032
Table 109: Asia Pacific Beverage Acidulants Market Value (US$ Mn) and Forecast by Form, 2017–2021
Table 110: Asia Pacific Beverage Acidulants Market Value (US$ Mn) and Forecast by Form, 2022–2032
Table 111: Asia Pacific Beverage Acidulants Market Volume (MT ) and Forecast by Form, 2017–2021
Table 112: Asia Pacific Beverage Acidulants Market Volume (MT ) and Forecast by Form, 2022–2032
Table 113: Asia Pacific Beverage Acidulants Market Value (US$ Mn) and Forecast by Nature, 2017–2021
Table 114: Asia Pacific Beverage Acidulants Market Value (US$ Mn) and Forecast by Nature, 2022–2032
Table 115: Asia Pacific Beverage Acidulants Market Volume (MT ) and Forecast by Nature, 2017–2021
Table 116: Asia Pacific Beverage Acidulants Market Volume (MT ) and Forecast by Nature, 2022–2032
Table 117: MEA Beverage Acidulants Market Value (US$ Mn) and Forecast by Country, 2017–2021
Table 118: MEA Beverage Acidulants Market Value (US$ Mn) and Forecast by Country, 2022–2032
Table 119: MEA Beverage Acidulants Market Volume (MT ) and Forecast by Country, 2017–2021
Table 120: MEA Beverage Acidulants Market Volume (MT ) and Forecast by Country, 2022–2032
Table 121: MEA Beverage Acidulants Market Value (US$ Mn) and Forecast by Product Type , 2017–2021
Table 122: MEA Beverage Acidulants Market Value (US$ Mn) and Forecast by Product Type , 2022–2032
Table 123: MEA Beverage Acidulants Market Volume (MT ) and Forecast by Product Type , 2017–2021
Table 124: MEA Beverage Acidulants Market Volume (MT ) and Forecast by Product Type , 2022–2032
Table 125: MEA Beverage Acidulants Market Value (US$ Mn) and Forecast by Application, 2017–2021
Table 126: MEA Beverage Acidulants Market Value (US$ Mn) and Forecast by Application, 2022–2032
Table 127: MEA Beverage Acidulants Market Volume (MT ) and Forecast by Application, 2017–2021
Table 128: MEA Beverage Acidulants Market Volume (MT ) and Forecast by Application, 2022–2032
Table 129: MEA Beverage Acidulants Market Value (US$ Mn) and Forecast by Form, 2017–2021
Table 130: MEA Beverage Acidulants Market Value (US$ Mn) and Forecast by Form, 2022–2032
Table 131: MEA Beverage Acidulants Market Volume (MT ) and Forecast by Form, 2017–2021
Table 132: MEA Beverage Acidulants Market Volume (MT ) and Forecast by Form, 2022–2032
Table 133: MEA Beverage Acidulants Market Value (US$ Mn) and Forecast by Nature, 2017–2021
Table 134: MEA Beverage Acidulants Market Value (US$ Mn) and Forecast by Nature, 2022–2032
Table 135: MEA Beverage Acidulants Market Volume (MT ) and Forecast by Nature, 2017–2021
Table 136: MEA Beverage Acidulants Market Volume (MT ) and Forecast by Nature, 2022–2032
Find your sweet spots for generating winning opportunities in this market.
Talk to AnalystList of Charts
Figure 1: Global Beverage Acidulants Market Value (USD Bn) and Volume (Tons) Forecast, 2022-2032
Figure 2: Global Beverage Acidulants Market Absolute $ Opportunity (USD Bn), 2022-2032
Figure 3: Global Beverage Acidulants Market Value (USD Bn) and % Growth by Region, 2022 & 2032
Figure 4: Global Beverage Acidulants Market Y-o-Y Growth Rate by Region, 2022-2032
Figure 5: Global Beverage Acidulants Market Value (USD Bn) and % Growth by Product Type, 2022 & 2032
Figure 6: Global Beverage Acidulants Market Y-o-Y Growth Rate by Product Type, 2022-2032
Figure 7: Global Beverage Acidulants Market Value (USD Bn) and % Growth by Application, 2022 & 2032
Figure 8: Global Beverage Acidulants Market Y-o-Y Growth Rate by Application, 2022-2032
Figure 9: Global Beverage Acidulants Market Value (USD Bn) and % Growth by Form, 2022 & 2032
Figure 10: Global Beverage Acidulants Market Y-o-Y Growth Rate by Form, 2022-2032
Figure 11: Global Beverage Acidulants Market Value (USD Bn) and % Growth by Nature, 2022 & 2032
Figure 12: Global Beverage Acidulants Market Y-o-Y Growth Rate by Nature, 2022-2032
Figure 13: Global Beverage Acidulants Market Attractiveness Analysis by Region, 2022-2032
Figure 14: Global Beverage Acidulants Market Attractiveness Analysis by Product Type, 2022-2032
Figure 15: Global Beverage Acidulants Market Attractiveness Analysis by Application, 2022-2032
Figure 16: Global Beverage Acidulants Market Attractiveness Analysis by Form, 2022-2032
Figure 17: Global Beverage Acidulants Market Attractiveness Analysis by Nature, 2022-2032
Figure 18: North America Beverage Acidulants Market Value (USD Bn) and Volume (Tons) Forecast, 2022-2032
Figure 19: North America Beverage Acidulants Market Absolute $ Opportunity (USD Bn), 2022-2032
Figure 20: North America Beverage Acidulants Market Value (USD Bn) and % Growth by Country, 2022 & 2032
Figure 21: North America Beverage Acidulants Market Y-o-Y Growth Rate by Country, 2022-2032
Figure 22: North America Beverage Acidulants Market Value (USD Bn) and % Growth by Product Type, 2022 & 2032
Figure 23: North America Beverage Acidulants Market Y-o-Y Growth Rate by Product Type, 2022-2032
Figure 24: North America Beverage Acidulants Market Value (USD Bn) and % Growth by Application, 2022 & 2032
Figure 25: North America Beverage Acidulants Market Y-o-Y Growth Rate by Application, 2022-2032
Figure 26: North America Beverage Acidulants Market Value (USD Bn) and % Growth by Form, 2022 & 2032
Figure 27: North America Beverage Acidulants Market Y-o-Y Growth Rate by Form, 2022-2032
Figure 28: North America Beverage Acidulants Market Value (USD Bn) and % Growth by Nature, 2022 & 2032
Figure 29: North America Beverage Acidulants Market Y-o-Y Growth Rate by Nature, 2022-2032
Figure 30: North America Beverage Acidulants Market Attractiveness Analysis by Country, 2022-2032
Figure 31: North America Beverage Acidulants Market Attractiveness Analysis by Product Type, 2022-2032
Figure 32: North America Beverage Acidulants Market Attractiveness Analysis by Application, 2022-2032
Figure 33: North America Beverage Acidulants Market Attractiveness Analysis by Form, 2022-2032
Figure 34: North America Beverage Acidulants Market Attractiveness Analysis by Nature, 2022-2032
Figure 35: Latin America Beverage Acidulants Market Value (USD Bn) and Volume (Tons) Forecast, 2022-2032
Figure 36: Latin America Beverage Acidulants Market Absolute $ Opportunity (USD Bn), 2022-2032
Figure 37: Latin America Beverage Acidulants Market Value (USD Bn) and % Growth by Country, 2022 & 2032
Figure 38: Latin America Beverage Acidulants Market Y-o-Y Growth Rate by Country, 2022-2032
Figure 39: Latin America Beverage Acidulants Market Value (USD Bn) and % Growth by Product Type, 2022 & 2032
Figure 40: Latin America Beverage Acidulants Market Y-o-Y Growth Rate by Product Type, 2022-2032
Figure 41: Latin America Beverage Acidulants Market Value (USD Bn) and % Growth by Application, 2022 & 2032
Figure 42: Latin America Beverage Acidulants Market Y-o-Y Growth Rate by Application, 2022-2032
Figure 43: Latin America Beverage Acidulants Market Value (USD Bn) and % Growth by Form, 2022 & 2032
Figure 44: Latin America Beverage Acidulants Market Y-o-Y Growth Rate by Form, 2022-2032
Figure 45: Latin America Beverage Acidulants Market Value (USD Bn) and % Growth by Nature, 2022 & 2032
Figure 46: Latin America Beverage Acidulants Market Y-o-Y Growth Rate by Nature, 2022-2032
Figure 47: Latin America Beverage Acidulants Market Attractiveness Analysis by Country, 2022-2032
Figure 48: Latin America Beverage Acidulants Market Attractiveness Analysis by Product Type, 2022-2032
Figure 49: Latin America Beverage Acidulants Market Attractiveness Analysis by Application, 2022-2032
Figure 50: Latin America Beverage Acidulants Market Attractiveness Analysis by Form, 2022-2032
Figure 51: Latin America Beverage Acidulants Market Attractiveness Analysis by Nature, 2022-2032
Figure 52: Europe Beverage Acidulants Market Value (USD Bn) and Volume (Tons) Forecast, 2022-2032
Figure 53: Europe Beverage Acidulants Market Absolute $ Opportunity (USD Bn), 2022-2032
Figure 54: Europe Beverage Acidulants Market Value (USD Bn) and % Growth by Country, 2022 & 2032
Figure 55: Europe Beverage Acidulants Market Y-o-Y Growth Rate by Country, 2022-2032
Figure 56: Europe Beverage Acidulants Market Value (USD Bn) and % Growth by Product Type, 2022 & 2032
Figure 57: Europe Beverage Acidulants Market Y-o-Y Growth Rate by Product Type, 2022-2032
Figure 58: Europe Beverage Acidulants Market Value (USD Bn) and % Growth by Application, 2022 & 2032
Figure 59: Europe Beverage Acidulants Market Y-o-Y Growth Rate by Application, 2022-2032
Figure 60: Europe Beverage Acidulants Market Value (USD Bn) and % Growth by Form, 2022 & 2032
Figure 61: Europe Beverage Acidulants Market Y-o-Y Growth Rate by Form, 2022-2032
Figure 62: Europe Beverage Acidulants Market Value (USD Bn) and % Growth by Nature, 2022 & 2032
Figure 63: Europe Beverage Acidulants Market Y-o-Y Growth Rate by Nature, 2022-2032
Figure 64: Europe Beverage Acidulants Market Attractiveness Analysis by Country, 2022-2032
Figure 65: Europe Beverage Acidulants Market Attractiveness Analysis by Product Type, 2022-2032
Figure 66: Europe Beverage Acidulants Market Attractiveness Analysis by Application, 2022-2032
Figure 67: Europe Beverage Acidulants Market Attractiveness Analysis by Form, 2022-2032
Figure 68: Europe Beverage Acidulants Market Attractiveness Analysis by Nature, 2022-2032
Figure 69: China Beverage Acidulants Market Value (USD Bn) and Volume (Tons) Forecast, 2022-2032
Figure 70: China Beverage Acidulants Market Absolute $ Opportunity (USD Bn), 2022-2032
Figure 71: China Beverage Acidulants Market Value (USD Bn) and % Growth by Product Type, 2022 & 2032
Figure 72: China Beverage Acidulants Market Y-o-Y Growth Rate by Product Type, 2022-2032
Figure 73: China Beverage Acidulants Market Value (USD Bn) and % Growth by Application, 2022 & 2032
Figure 74: China Beverage Acidulants Market Y-o-Y Growth Rate by Application, 2022-2032
Figure 75: China Beverage Acidulants Market Value (USD Bn) and % Growth by Form, 2022 & 2032
Figure 76: China Beverage Acidulants Market Y-o-Y Growth Rate by Form, 2022-2032
Figure 77: China Beverage Acidulants Market Value (USD Bn) and % Growth by Nature, 2022 & 2032
Figure 78: China Beverage Acidulants Market Y-o-Y Growth Rate by Nature, 2022-2032
Figure 79: China Beverage Acidulants Market Attractiveness Analysis by Product Type, 2022-2032
Figure 80: China Beverage Acidulants Market Attractiveness Analysis by Application, 2022-2032
Figure 81: China Beverage Acidulants Market Attractiveness Analysis by Form, 2022-2032
Figure 82: China Beverage Acidulants Market Attractiveness Analysis by Nature, 2022-2032
Figure 83: Asia Pacific Beverage Acidulants Market Value (USD Bn) and Volume (Tons) Forecast, 2022-2032
Figure 84: Asia Pacific Beverage Acidulants Market Absolute $ Opportunity (USD Bn), 2022-2032
Figure 85: Asia Pacific Beverage Acidulants Market Value (USD Bn) and % Growth by Country, 2022 & 2032
Figure 86: Asia Pacific Beverage Acidulants Market Y-o-Y Growth Rate by Country, 2022-2032
Figure 87: Asia Pacific Beverage Acidulants Market Value (USD Bn) and % Growth by Product Type, 2022 & 2032
Figure 88: Asia Pacific Beverage Acidulants Market Y-o-Y Growth Rate by Product Type, 2022-2032
Figure 89: Asia Pacific Beverage Acidulants Market Value (USD Bn) and % Growth by Application, 2022 & 2032
Figure 90: Asia Pacific Beverage Acidulants Market Y-o-Y Growth Rate by Application, 2022-2032
Figure 91: Asia Pacific Beverage Acidulants Market Value (USD Bn) and % Growth by Form, 2022 & 2032
Figure 92: Asia Pacific Beverage Acidulants Market Y-o-Y Growth Rate by Form, 2022-2032
Figure 93: Asia Pacific Beverage Acidulants Market Value (USD Bn) and % Growth by Nature, 2022 & 2032
Figure 94: Asia Pacific Beverage Acidulants Market Y-o-Y Growth Rate by Nature, 2022-2032
Figure 95: Asia Pacific Beverage Acidulants Market Attractiveness Analysis by Country, 2022-2032
Figure 96: Asia Pacific Beverage Acidulants Market Attractiveness Analysis by Product Type, 2022-2032
Figure 97: Asia Pacific Beverage Acidulants Market Attractiveness Analysis by Application, 2022-2032
Figure 98: Asia Pacific Beverage Acidulants Market Attractiveness Analysis by Form, 2022-2032
Figure 99: Asia Pacific Beverage Acidulants Market Attractiveness Analysis by Nature, 2022-2032
Figure 100: MEA Beverage Acidulants Market Value (USD Bn) and Volume (Tons) Forecast, 2022-2032
Figure 101: MEA Beverage Acidulants Market Absolute $ Opportunity (USD Bn), 2022-2032
Figure 102: MEA Beverage Acidulants Market Value (USD Bn) and % Growth by Country, 2022 & 2032
Figure 103: MEA Beverage Acidulants Market Y-o-Y Growth Rate by Country, 2022-2032
Figure 104: MEA Beverage Acidulants Market Value (USD Bn) and % Growth by Product Type, 2022 & 2032
Figure 105: MEA Beverage Acidulants Market Y-o-Y Growth Rate by Product Type, 2022-2032
Figure 106: MEA Beverage Acidulants Market Value (USD Bn) and % Growth by Application, 2022 & 2032
Figure 107: MEA Beverage Acidulants Market Y-o-Y Growth Rate by Application, 2022-2032
Figure 108: MEA Beverage Acidulants Market Value (USD Bn) and % Growth by Form, 2022 & 2032
Figure 109: MEA Beverage Acidulants Market Y-o-Y Growth Rate by Form, 2022-2032
Figure 110: MEA Beverage Acidulants Market Value (USD Bn) and % Growth by Nature, 2022 & 2032
Figure 111: MEA Beverage Acidulants Market Y-o-Y Growth Rate by Nature, 2022-2032
Figure 112: MEA Beverage Acidulants Market Attractiveness Analysis by Country, 2022-2032
Figure 113: MEA Beverage Acidulants Market Attractiveness Analysis by Product Type, 2022-2032
Figure 114: MEA Beverage Acidulants Market Attractiveness Analysis by Application, 2022-2032
Figure 115: MEA Beverage Acidulants Market Attractiveness Analysis by Form, 2022-2032
Figure 116: MEA Beverage Acidulants Market Attractiveness Analysis by Nature, 2022-2032
Need specific information?
Request CustomizationExplore Food and Beverage Insights
View Reports