The Beverage Container Market is estimated to be valued at USD 258.2 billion in 2025 and is projected to reach USD 428.6 billion by 2035, registering a compound annual growth rate (CAGR) of 5.2% over the forecast period.
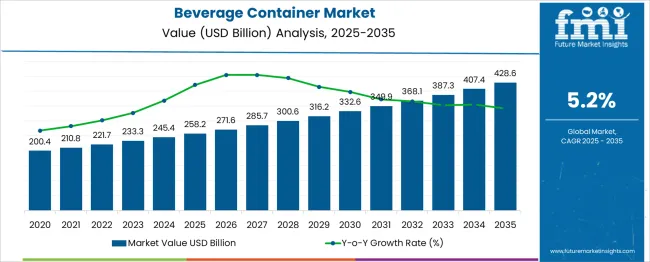
| Metric | Value |
|---|---|
| Beverage Container Market Estimated Value in (2025 E) | USD 258.2 billion |
| Beverage Container Market Forecast Value in (2035 F) | USD 428.6 billion |
| Forecast CAGR (2025 to 2035) | 5.2% |
The beverage container market is experiencing robust growth, fueled by increasing demand for convenient and sustainable packaging solutions. Changes in consumer lifestyles have driven the preference for portable and easy-to-use containers, particularly in the medium capacity range.
Growing awareness around environmental impact has also spurred innovation in materials, with plastic containers remaining popular due to their lightweight nature and cost-effectiveness. The rising consumption of non-alcoholic beverages, such as juices, soft drinks, and functional waters, has expanded the need for versatile packaging that preserves freshness and extends shelf life.
Additionally, expanding retail channels and modern distribution networks have improved product accessibility to end consumers. Technological advancements in barrier coatings and recyclable plastics are expected to support future growth. The market’s trajectory is shaped by these factors with growth led by plastic containers, medium-sized capacities, and non-alcoholic beverage applications.
The beverage container market is segmented by material, capacity, and application and geographic regions. By material of the beverage container market is divided into Plastic, Metal, Glass, Paper and Paperboard, and Other Materials (Composite materials and Ceramic). In terms of capacity of the beverage container market is classified into Medium (250 – 750 ml), Small (below 250 ml), and Large (above 750 ml). Based on application of the beverage container market is segmented into Non-Alcoholic Beverages and Alcoholic Beverages. Regionally, the beverage container industry is classified into North America, Latin America, Western Europe, Eastern Europe, Balkan & Baltic Countries, Russia & Belarus, Central Asia, East Asia, South Asia & Pacific, and the Middle East & Africa.
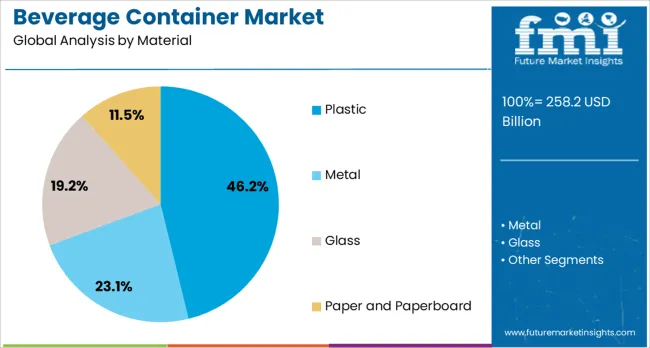
The plastic segment is projected to account for 46.2% of the beverage container market revenue in 2025, maintaining its position as the leading material type. This segment benefits from plastic’s versatility and ability to be molded into various shapes and sizes, which suits the diverse packaging needs of beverage manufacturers.
Plastic containers are favored for their durability and lightweight properties, which reduce transportation costs and enhance convenience for consumers. The recyclability of certain plastics and advances in biodegradable formulations have further increased consumer acceptance and regulatory support.
The segment’s widespread use across beverage categories including non-alcoholic drinks ensures sustained demand. Plastic’s cost-efficiency compared to alternatives like glass or metal supports its continued market dominance.
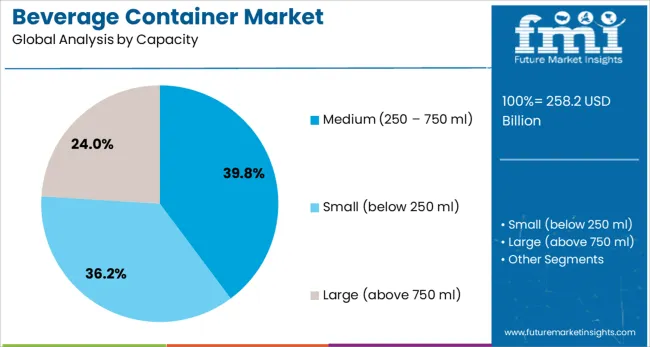
The medium capacity segment, ranging from 250 to 750 ml, is expected to contribute 39.8% of market revenue in 2025, positioning it as the most popular container size. This capacity range offers a balance between portability and sufficient volume for individual consumption occasions.
Beverage producers have capitalized on this segment to target on-the-go consumers who prioritize convenience without compromising quantity. Packaging designs within this range cater to single servings, making them ideal for retail environments and vending channels.
The segment’s growth is also supported by trends in health-conscious drinking and increased demand for functional beverages that are often consumed in moderate quantities. As consumer preferences evolve towards flexible portion sizes, the medium capacity segment is poised to maintain its leadership in the market.
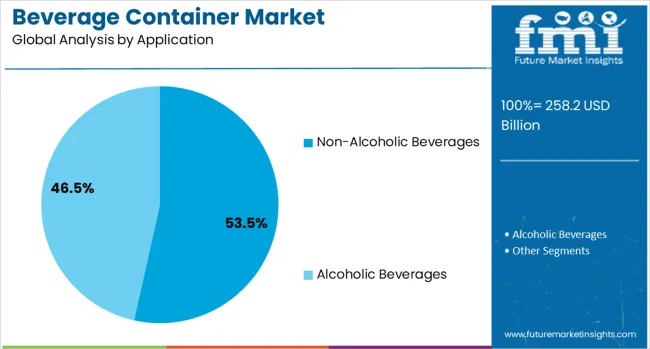
The non-alcoholic beverages segment is projected to hold 53.5% of the beverage container market revenue in 2025, leading the application categories. Growth in this segment is driven by rising consumption of products such as soft drinks, juices, bottled water, and sports drinks.
Consumers’ increasing focus on hydration, wellness, and functional benefits has expanded the variety of non-alcoholic beverages available in the market. Packaging plays a critical role in maintaining product quality and extending shelf life, factors which have pushed manufacturers to invest in innovative container solutions.
The segment benefits from broad demographic appeal and consistent demand across geographic regions. With rising health awareness and changing lifestyles, the non-alcoholic beverage segment is expected to remain the primary driver of container market growth.
The beverage container market is shifting toward lightweight, reusable, and traceable formats. In 2024, around 38 % of new beverage SKUs launched in e-commerce and retail were bottle formats with advanced barrier films or K-cup pods. Demand is highest in regions with high single-serve or premium health drink penetration, prompting functional innovation in sealing and labeling.
Brands have revamped fill-to-shelf workflows to reduce waste and improve shelf presentation. Deployment of standardized refillable bottle systems across convenience-store chains cut inventory surplus by 11 %. Cold-fill ready polyethylene variants reduced post-fill handling time by 17 %, enabling same-day store restocking. Retailers in Europe and North America now expect recovery and refill return rates exceeding 0.7 per SKU, prompting a 22 % expansion in shelf-share for eco-packaged lines. QR-encoded batch codes improved recall traceability, lowering cross-border refill rejection by 9 %. These shifts allowed packaging lines to adopt smaller batch runs and align production with fluctuations in health drink demand.
Producers face margin squeeze as resin costs and logistics fees rise. PET resin spot price increased by 9 % in early 2025, while refrigerated container transport rates surged 8 %, outpacing average shelf-price adjustments. Lightweight multi-layer pouches or K‑cup designs increased material cost by 12 % over standard PET bottles. Some brands switched to recycled PET blends to stabilize cost, trimming landed expenses by 11 %, but these blends presented challenges in print adhesion and seal reliability. Others introduced refill pouch formats to cap unit cost volatility, but consumer acceptance remained uneven due to usability concerns. As packaging complexity grows, contract bottling lines are facing tighter design tolerances, higher setup times, and mounting alignment risks across brand and SKU variation.
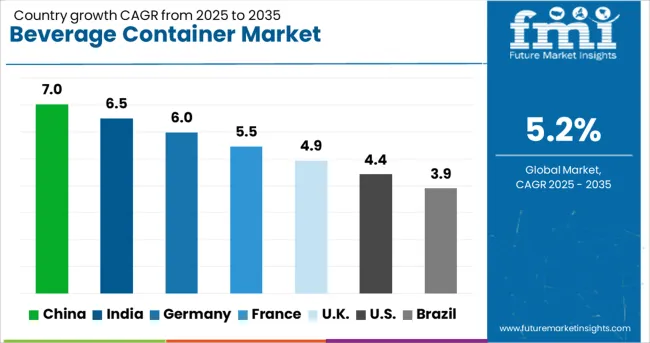
| Country | CAGR |
|---|---|
| China | 7.0% |
| India | 6.5% |
| Germany | 6.0% |
| France | 5.5% |
| UK | 4.9% |
| USA | 4.4% |
| Brazil | 3.9% |
Global beverage container market value is expected to grow at a 5.2% CAGR through 2035. China, at 7.0%, posts a +35% premium over the global average, supported by high beverage production volumes and rising PET container demand. Germany follows with 6.0% (+15%), led by engineering-led packaging automation. France stands at 5.5% (+6%) with steady demand across alcoholic and non-alcoholic segments. The United States trails with 4.4% (–15%), reflecting slower container format changes and market saturation. Brazil, at 3.9%, sees moderate growth constrained by limited glass and aluminum conversion capacity. The report covers detailed analysis of 40+ countries, with the top five countries shared as a reference.
China’s beverage container market is projected to grow at a 7.0% CAGR. Growth is driven by PET bottle conversions, canned tea adoption, and aseptic packaging upgrades. Carbonated soft drink producers are moving toward recyclable aluminum cans in Tier 1 and Tier 2 cities. Juice and dairy brands are deploying multilayer cartons to extend shelf life. Premium water and energy drink brands are investing in unique formats and closures. Provincial subsidies for automated filling systems are accelerating throughput upgrades in Hebei, Guangdong, and Zhejiang.
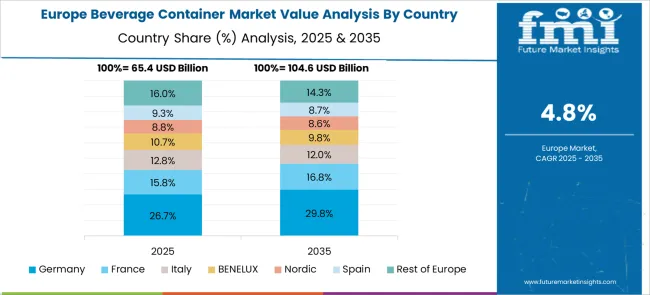
Germany’s beverage container market is forecast to grow at a 6.0% CAGR. Bottled water, alcohol-free beer, and wellness drinks are the primary drivers. Lightweight glass is gaining usage in mineral water, while breweries are expanding refillable systems. Multilayer PET bottles are being introduced in vitamin beverages. Glass facilities in Bavaria and North Rhine–Westphalia are retooling for flexible, niche-sized runs. Aluminum cans are growing in convenience retail channels due to portability and portion control.
Germany’s IQF market is forecast to grow at 6.0% CAGR. Food safety regulations and energy-efficiency goals are motivating processors to shift from batch chillers to inline IQF systems. Demand is concentrated in frozen bakery items, meat substitutes, and seasonal fruit processing. Soy and pea protein processors are adopting nitrogen-based IQF to preserve texture. German OEMs are expanding EU exports of spiral freezers tailored to bakery and meat applications. Retrofits and automation packages are being introduced to reduce cycle times and meet hygiene standards.
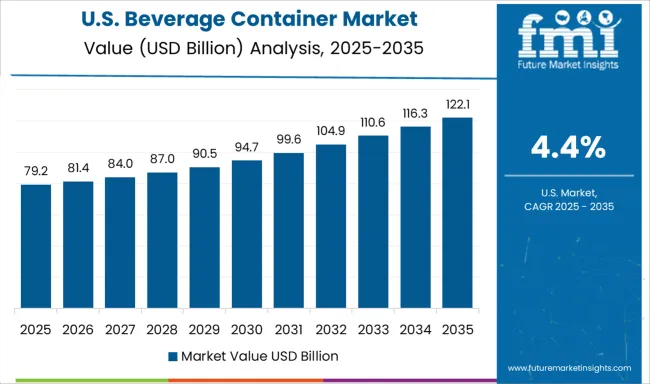
The USA beverage container market is projected to grow at a 4.4% CAGR. Sparkling water, flavored soda, and low-calorie juices are driving volume. Startups are adopting custom-shaped containers to establish shelf presence. Aluminum packaging is growing across categories, especially for health-oriented drinks. High-pressure processing is expanding demand for thicker PET formats. Midwest and Southeast regions are scaling canning and blow-molding lines to address logistics and capacity constraints.
Brazil’s beverage container market is expected to grow at a 3.9% CAGR. Large-volume PET bottles dominate soda and flavored water categories. Returnable glass remains stable among beer brands, with new lines added in southern states. Aluminum can use is rising gradually among energy drink and flavored malt producers. Regional bottlers are deploying blow-fill lines to cut unit costs. Multinational firms are partnering on lightweight formats for rollouts in underserved northern and northeastern regions.
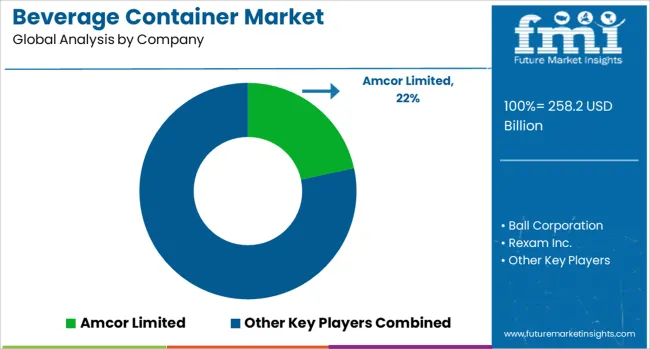
The global beverage container market is highly competitive, with Amcor Limited leading at a significant market share through its innovative packaging solutions for both alcoholic and non-alcoholic drinks. Key industry players, including Ball Corporation, Rexam Inc., and Silgan Holdings, specialize in aluminum cans, glass bottles, and sustainable plastic containers. Established manufacturers like Owens-Illinois and Toyo Seikan Group Holdings dominate the glass container segment, while emerging innovators such as CLARCOR and Huber Packaging Group focus on eco-friendly materials and smart packaging technologies. Market growth is driven by rising demand for convenient, portable beverage options and increasing environmental awareness. Manufacturers are investing in lightweight designs, recyclable materials, and advanced barrier technologies to extend product shelf life while meeting stringent sustainability regulations. The industry is also seeing a shift toward personalized and premium packaging formats to cater to evolving consumer preferences.
| Item | Value |
|---|---|
| Quantitative Units | USD 258.2 Billion |
| Material | Plastic, Metal, Glass, Paper and Paperboard, and Other Materials (Composite materials and Ceramic) |
| Capacity | Medium (250 – 750 ml), Small (below 250 ml), and Large (above 750 ml) |
| Application | Non-Alcoholic Beverages and Alcoholic Beverages |
| Regions Covered | North America, Europe, Asia-Pacific, Latin America, Middle East & Africa |
| Country Covered | United States, Canada, Germany, France, United Kingdom, China, Japan, India, Brazil, South Africa |
| Key Companies Profiled | Amcor Limited, Ball Corporation, Rexam Inc., Silgan Holdings, Owens-Illinois, Toyo Seikan Group Holdings, CLARCOR, Huber Packaging Group, and Ardagh Group |
| Additional Attributes | Dollar sales by material type and beverage category, growing demand in ready-to-drink and functional beverage segments, stable usage across carbonated drinks and bottled water, innovations in lightweight container designs and barrier coatings improve shelf stability, recyclability, and filling efficiency |
The global beverage container market is estimated to be valued at USD 258.2 billion in 2025.
The market size for the beverage container market is projected to reach USD 428.6 billion by 2035.
The beverage container market is expected to grow at a 5.2% CAGR between 2025 and 2035.
The key product types in beverage container market are plastic, _pet (polyethylene terephthalate), _hdpe (high-density polyethylene), _pp (polypropylene), _bioplastics, metal, _aluminum, _steel (tinplate), glass, _soda-lime glass, _borosilicate glass, paper and paperboard, _molded fiber, _tetra pak & aseptic cartons and other materials (composite materials and ceramic).
In terms of capacity, medium (250 – 750 ml) segment to command 39.8% share in the beverage container market in 2025.


Full Research Suite comprises of:
Market outlook & trends analysis
Interviews & case studies
Strategic recommendations
Vendor profiles & capabilities analysis
5-year forecasts
8 regions and 60+ country-level data splits
Market segment data splits
12 months of continuous data updates
DELIVERED AS:
PDF EXCEL ONLINE
Beverage Packaging Market Size and Share Forecast Outlook 2025 to 2035
Beverage Carrier Market Size and Share Forecast Outlook 2025 to 2035
Beverage Cartoners Market Size and Share Forecast Outlook 2025 to 2035
Beverage Filter Paper Market Size and Share Forecast Outlook 2025 to 2035
Beverage Ingredients Market Analysis - Size and Share Forecast Outlook 2025 to 2035
Beverage Packaging Equipment Market Size and Share Forecast Outlook 2025 to 2035
Beverage Clouding Agent Market Size and Share Forecast Outlook 2025 to 2035
Beverage Packaging Machine Market Size and Share Forecast Outlook 2025 to 2035
Beverage Premix Market Size and Share Forecast Outlook 2025 to 2035
Beverage Acidulants Market Size and Share Forecast Outlook 2025 to 2035
Beverage Refrigeration Market Size and Share Forecast Outlook 2025 to 2035
Beverage Tester Market Size and Share Forecast Outlook 2025 to 2035
Beverage Dispenser Market Size and Share Forecast Outlook 2025 to 2035
Beverage Can Ends Market Size and Share Forecast Outlook 2025 to 2035
Beverage Cups Market Size and Share Forecast Outlook 2025 to 2035
Beverage Can Seamers Market Size and Share Forecast Outlook 2025 to 2035
Beverage Aluminum Cans Market Size and Share Forecast Outlook 2025 to 2035
Beverage Stabilizer Market Growth, Trends, Share, 2025 to 2035
Beverage Emulsion Market Analysis - Size, Share, and Forecast Outlook 2025 to 2035
Beverage Crate Market Analysis – Size, Share, & Forecast Outlook 2025 to 2035

Thank you!
You will receive an email from our Business Development Manager. Please be sure to check your SPAM/JUNK folder too.
Chat With
MaRIA