Beverage Ingredients Market Size and Share Forecast Outlook 2025 to 2035

The Beverage Ingredients Market is expected to record a valuation of USD 112,345.0 million in 2025 and USD 201,698.6 million in 2035, with an increase of USD 89,353.6 million, which equals a growth of nearly 1.8X over the decade. The overall expansion represents a CAGR of 6.0% and a strong double-digit increase in incremental revenues across regions.
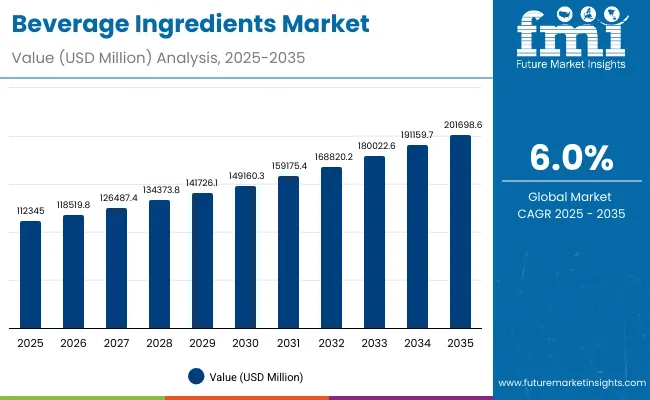
Quick Stats for Beverage Ingredients Market

  • Beverage Ingredients Market Value (2025): USD 112,345.0 million
  • Beverage Ingredients Market Forecast Value (2035): USD 201,698.6 million
  • Beverage Ingredients Market Forecast CAGR: 6.0%
  • Leading Segment in Beverage Ingredients Market in 2025: Functional Ingredients (28%)
  • Key Growth Regions in the Beverage Ingredients Market: North America, Europe, South Asia & Pacific, East Asia
  • Top Key Players in Beverage Ingredients Market: Givaudan, Kerry Group, DSM-Firmenich, Symrise, ADM

Beverage Ingredients Market

Beverage Ingredients Market Key Takeaways

Metric Value
Beverage Ingredients Market Estimated Value in (2025E) USD 112,345.0 million
Beverage Ingredients Market Forecast Value in (2035F) USD 201,698.6 million
Forecast CAGR (2025 to 2035) 6.0%

During the first five-year period from 2025 to 2030, the market increases from USD 112,345.0 million to USD 149,160.3 million , adding over USD 36,815.3 million , which accounts for around 41% of the total decade growth. This phase records steady adoption in functional beverages, RTD formulations, and dairy & plant-based alternatives, driven by the need for better nutrition, clean label ingredients, and natural formulations. Functional ingredients dominate this period as they cater to over 28% of beverage innovations, especially in energy drinks, nutraceutical shots, and protein-rich dairy alternatives. The rise of plant-based proteins, prebiotic fibers, and adaptogens strengthens the positioning of functional beverages as lifestyle-oriented solutions.

The second half from 2030 to 2035 contributes USD 52,538.3 million , equal to 59% of total growth, as the market jumps from USD 149,160.3 million to USD 201,698.6 million. This acceleration is powered by widespread deployment of fermentation-derived ingredients, probiotics, and nootropics, alongside the scaling of digital health-linked beverages such as personalized hydration solutions and functional water.

Fermentation-derived ingredients and natural extracts together capture a larger share above 22% by the end of the decade. Functional beverages consolidate leadership, while enhanced water and nutraceutical shots witness faster CAGR growth (6.2%-6.8%), adding recurring value streams. The growing consumer shift toward plant-based, sustainable, and gut-health-focused beverages fuels higher investments by global players, increasing R&D intensity and product launches.

From 2020 to 2024, the Beverage Ingredients Market grew steadily on the back of rising demand for sweeteners, acidulants, and preservatives, particularly in the soft drinks and RTD categories. During this period, the competitive landscape was dominated by large flavor and ingredient manufacturers controlling nearly 70% of revenue, with leaders such as Givaudan, Kerry Group, and ADM focusing on flavors, botanicals, and specialty functional ingredients. Competitive differentiation relied heavily on natural sourcing, regulatory compliance, and innovation in flavor modulation, while categories such as probiotics and adaptogens were still in their early adoption phase. Service-linked formulations and co-creation with beverage manufacturers had minimal traction, contributing less than 15% of the total market value.

Demand for beverage ingredients will expand to USD 112,345.0 million in 2025, and the revenue mix will shift as functional ingredients, probiotics, and fermentation-derived inputs grow to over 44% share. Traditional leaders in flavors and sweeteners face rising competition from digital-first and niche players offering AI-driven flavor mapping, clean-label protein formulations, and bio-fermentation-derived actives.

Major multinational vendors are pivoting to sustainability-led models, integrating traceability, natural extraction technologies, and circular economy approaches to retain relevance. Emerging entrants specializing in plant-based proteins, gut health solutions, and nootropic formulations are gaining share. The competitive advantage is moving away from traditional sweeteners and preservatives alone to ecosystem strength, functional science backing, and consumer engagement capabilities.

Why the Beverage Ingredients Market is Growing?

Advances in functional science and clean-label innovation have improved the nutritional and sensory profile of beverages, allowing for more efficient adoption across diverse categories such as sports nutrition, dairy alternatives, and functional hydration. Functional ingredients including adaptogens, nootropics, and probiotics have gained strong popularity due to their suitability for enhancing mental focus, gut health, and stress relief. The rise of natural sweeteners such as stevia and monk fruit has contributed to reduced sugar positioning and mass consumer adoption. Industries such as energy drinks, nutraceutical shots, and RTD beverages are driving demand for ingredients that align with health-conscious and sustainability-driven lifestyles.

Expansion of fermentation-based ingredients, probiotics, and natural colorants has fueled market growth. Innovations in plant-based proteins, botanical extracts, and prebiotic fibers are expected to open new application areas across dairy alternatives, functional water, and tea-based beverages. Segment growth is expected to be led by functional ingredients (CAGR 6.2%), prebiotics & probiotics (CAGR 6.5%), and plant-based sources (CAGR 6.0%) due to their precision health appeal, adaptability, and alignment with wellness megatrends.

Segmental Analysis

The Beverage Ingredients Market is segmented by ingredient type, source, application, and region. Ingredient types include sweeteners, flavors, colors, acidulants, preservatives, emulsifiers & stabilizers, functional ingredients, carbonation additives, and prebiotics & probiotics, highlighting the core elements driving adoption. Source classification covers plant-based, animal-based, synthetic, and fermentation-derived, catering to different nutritional and functional requirements.

Based on application, the segmentation includes functional beverages, RTD beverages, alcoholic beverages, dairy & plant-based drinks, soft drinks, juices, tea & coffee-based beverages, and enhanced water. In terms of region, the scope spans North America, Latin America, Europe, East Asia, South Asia & Pacific, and the Middle East & Africa, capturing diverse consumer demand across developed and emerging markets.
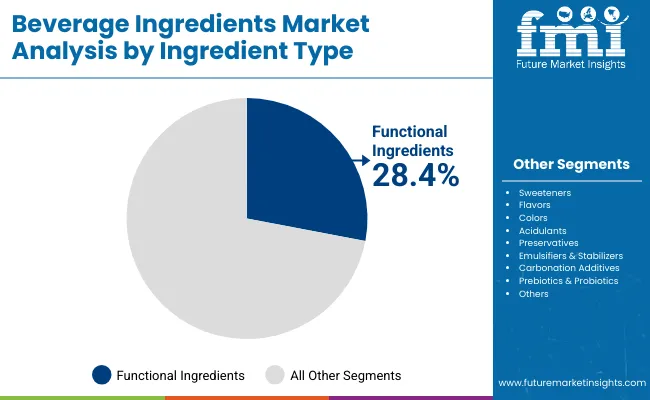
Insights into the Ingredient Type Segment with Functional Ingredients Leading in Market Share

Beverage Ingredients Market By Ingredient

Ingredient Type Share (%)
Functional Ingredients 28.4%
Others 71.6%

The functional ingredients segment is projected to contribute the largest share of the Beverage Ingredients Market in 2025, maintaining its lead as the dominant category. This growth is driven by ongoing demand for proteins, probiotics, adaptogens, nootropics, and electrolytes, which address critical consumer needs for energy, immunity, digestive health, and mental performance. Functional ingredients have become the cornerstone of beverage innovation, particularly in sports drinks, nutraceutical shots, energy beverages, and dairy alternatives, where they enable clear product differentiation.

The segment’s expansion is also supported by the development of science-backed formulations that appeal to health-conscious consumers. As beverages increasingly integrate botanicals and bioactive compounds, functional ingredients provide opportunities for cross-category innovation. With their versatility and alignment to wellness, performance, and preventive health, functional ingredients are expected to remain the backbone of beverage formulation strategies through 2035.
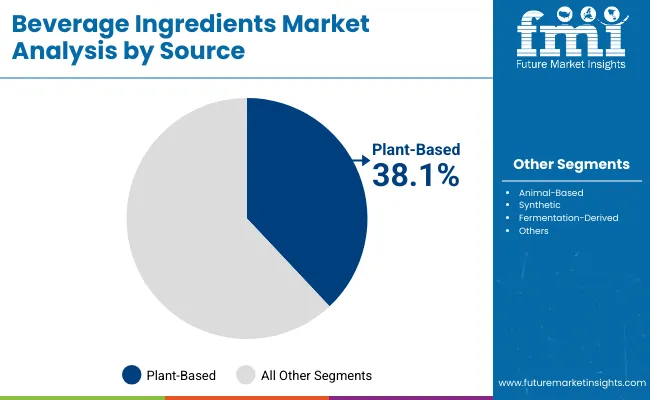
Insights into the Source Segment with Plant-Based Ingredients Dominating the Demand

Beverage Ingredients Market By Source

Source Type Share (%)
Plant-Based 38.1%
Others 61.9%

The plant-based segment is forecasted to hold the largest share of the Beverage Ingredients Market in 2025, supported by its strong adoption across both mainstream and premium beverage categories. This is driven by consumer preference for natural, vegan, and clean-label products, which has accelerated the use of herbal extracts, botanical flavors, fruit juices, and natural colors.

Plant-based ingredients also play a pivotal role in the global protein transition, with consumers shifting from dairy to pea, soy, oat, and other botanical proteins in both functional and RTD beverages. Furthermore, natural sweeteners such as stevia and monk fruit are enabling sugar reduction without compromising taste, while natural colorants such as carotenoids and anthocyanins are helping brands remove synthetic dyes. As sustainability and traceability become critical to purchasing decisions, plant-based ingredients will continue to dominate, shaping the future of innovation across functional beverages, dairy alternatives, and enhanced waters.
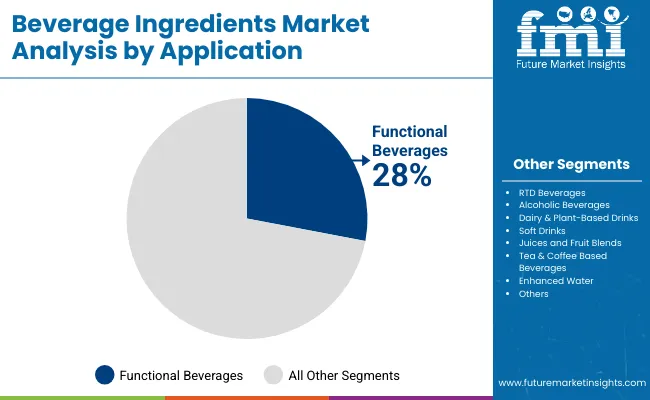
Insights into the Application Segment with Functional Beverages Driving Growth

Beverage Ingredients Market By Application

Application Share (%)
Functional Beverages 28.4%
Others 71.6%

The functional beverages segment is projected to hold the leading share of the Beverage Ingredients Market in 2025, establishing itself as the fastest-growing application. Growth is led by sports drinks, energy drinks, and nutraceutical shots, all of which are favored by consumers seeking performance, hydration, immunity, and convenience. Functional beverages are also gaining traction through enhanced waters, protein-rich dairy alternatives, and nootropic-infused drinks, creating new growth opportunities across both developed and emerging markets.

The segment’s expansion is further supported by the blurring of boundaries between nutrition and refreshment, with functional benefits increasingly being embedded into mainstream RTD and soft drink formulations. Innovations in adaptogen-infused drinks, probiotic beverages, and personalized nutrition solutions are reinforcing functional beverages as a premium yet accessible segment. With a CAGR of over 6.3%, functional beverages are expected to remain the driving force of beverage industry growth throughout the forecast period, setting the benchmark for innovation in health and wellness-focused drinks.

What are the Drivers, Restraints, and Key Trends of the Beverage Ingredients Market?

Shifting consumer preferences, regulatory pressures, and innovation in functional formulations are reshaping the Beverage Ingredients Market, even as the industry faces challenges around sourcing, formulation complexity, and high production costs. Demand is being fueled by the rise of functional, plant-based, and clean-label beverages, while hurdles persist in ensuring scalability, affordability, and compliance across regions. At the same time, digital tools, sustainability goals, and health-conscious lifestyles are creating new pathways for long-term market expansion.

Drivers

Health & Wellness-Oriented Consumption

The Beverage Ingredients Market is witnessing strong growth driven by rising consumer demand for functional, clean-label, and health-focused beverages. Functional ingredients such as probiotics, proteins, adaptogens, and nootropics are increasingly being used in sports drinks, nutraceutical shots, and dairy alternatives. Consumers seek beverages that deliver not only refreshment but also tangible health benefits such as improved immunity, gut health, and mental clarity. This shift has encouraged manufacturers to reformulate with natural and plant-based ingredients, boosting innovation across categories from energy drinks to enhanced water.

Plant-Based and Natural Ingredient Expansion

Plant-based beverages are leading growth, with 38% market share in 2025, as demand for natural extracts, botanical flavors, and vegan proteins accelerates. The shift from synthetic to natural colorants, sweeteners, and preservatives is creating new opportunities for ingredient suppliers. Consumers increasingly associate plant-based ingredients with sustainability, transparency, and wellness, making them central to both premium and mainstream beverage launches. This driver is reinforced by regulatory trends encouraging the reduction of artificial additives and added sugars.

Restraints

High Production Costs and Supply Constraints

The reliance on natural, specialty, and fermentation-derived ingredients comes with higher production costs, impacting beverage manufacturers’ margins. Sourcing challenges for botanicals, natural sweeteners, and probiotics often lead to price volatility and supply instability. Smaller manufacturers face difficulties in scaling production due to the expense of specialized extraction, fermentation, and stabilization processes, which can limit broader adoption despite rising demand.

Regulatory Hurdles and Formulation Complexity

Compliance with stringent food safety, labeling, and health-claims regulations is a major restraint for the market. Functional ingredients such as adaptogens, probiotics, and nootropics often face varying approval standards across regions, slowing global rollouts. Additionally, formulation complexity arises when integrating multiple active ingredients without compromising taste, stability, or shelf life. This creates barriers for both established players and startups looking to commercialize innovative beverages at scale.

Key Trends

Rise of Functional Beverages as Lifestyle Products

Functional beverages are no longer niche they represent 28% of the market in 2025 and are expanding as daily lifestyle products. Beverages infused with probiotics, electrolytes, and nootropics are being positioned as alternatives to supplements, offering on-the-go health benefits in convenient formats. This trend reflects the merging of food, nutrition, and pharmaceuticals, with functional drinks moving into mainstream retail channels alongside traditional soft drinks and juices.

Digital Innovation and Personalization in Beverages

The integration of AI, data analytics, and digital health platforms is shaping the next wave of beverage innovation. Companies are exploring personalized hydration, microbiome-targeted drinks, and subscription-based functional beverages tailored to consumer health profiles. At the same time, digital flavor-mapping tools and smart R&D systems are enabling faster innovation in taste and formulation. This trend is expected to create new ecosystems where beverage ingredients are linked to consumer data and wellness tracking, driving long-term engagement.
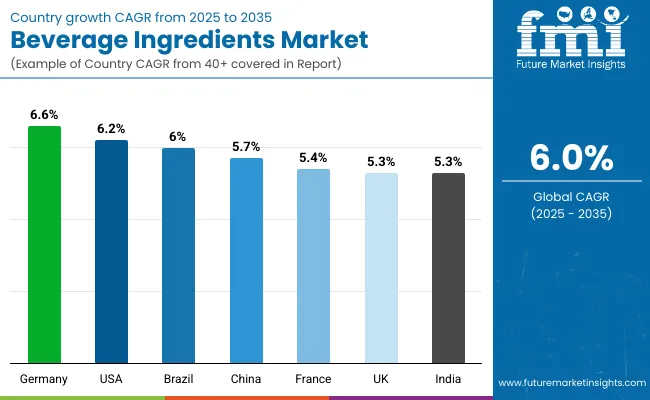
Analysis of Beverage Ingredients Market By Key Countries

Beverage Ingredients Market By Country

Countries CAGR (%)
China 5.7%
India 5.3%
Germany 6.6%
France 5.4%
UK 5.3%
USA 6.2%
Brazil 6.0%

The Beverage Ingredients Market demonstrates notable regional disparities in adoption speed, shaped by regulatory policies, consumer health trends, and manufacturing modernization.

Asia-Pacific is the fastest-growing region, anchored by China at 5.7% CAGR and India at 5.3% CAGR. China’s growth is driven by strong functional beverage adoption, sugar-reduction initiatives, and regulatory support for probiotics and plant-based proteins. India is rapidly integrating dairy alternatives, fortified waters, and nutraceutical beverages, supported by tier-2 city consumption and MSME expansion.

Europe maintains a balanced growth outlook, with France (5.4%), Germany (6.6%), and the UK (5.3%) supported by stringent EU food regulations, high penetration of plant-based beverages, and clean-label adoption. Europe continues to be a hub for fermentation-derived ingredients and sustainable sourcing, aligning with consumer preference for natural, organic, and low-sugar beverages.

North America, led by the United States at 6.2% CAGR, shows strong expansion due to innovation in RTD, nutraceutical shots, and functional waters. The USA is advancing in AI-enabled flavor mapping, personalized hydration, and dairy alternative innovations, making it a center for high-value ingredient development.

Latin America, with Brazil at 6.0% CAGR, reflects gradual adoption, led by soft drinks, juices, and energy beverages, but is increasingly integrating functional and fortified formulations into mainstream markets.
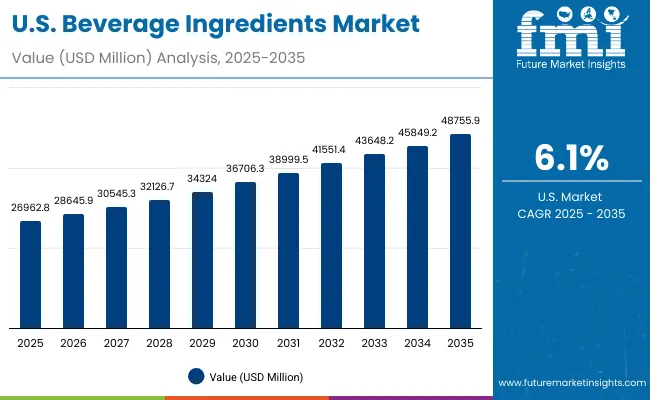
Sales Outlook for Beverage Ingredients in the United States

Beverage Ingredients Market Usa

Year USA Beverage Ingredients Market (USD Million)
2025 26,962.8
2026 28,646.0
2027 30,545.4
2028 32,126.7
2029 34,324.0
2030 36,706.3
2031 38,999.5
2032 41,551.4
2033 43,648.2
2034 45,849.2
2035 48,755.9

The Beverage Ingredients Market in the United States is projected to grow at a CAGR of 6.2%, led by increased demand across functional, plant-based, and RTD segments. Nutraceutical shots and functional waters show accelerated growth, while dairy alternatives are gaining mainstream acceptance.

  • Functional waters and nutraceutical shots are key growth drivers.
  • Oat and almond-based dairy alternatives expand consumer choice.
  • Digital personalization and AI-driven formulations drive innovation.

Growth and Expansion Outlook for Beverage Ingredients in the United Kingdom

The Beverage Ingredients Market in the United Kingdom is projected to grow at a CAGR of 5.3%, supported by adoption in functional teas, dairy alternatives, and low-sugar RTDs. Regulatory pressure from sugar taxes accelerates the shift toward natural sweeteners and reformulation.

  • Functional teas and botanicals are rising in popularity.
  • Sugar regulations push innovation in stevia and monk fruit adoption.
  • Retail partnerships foster co-developed plant-based innovations.

Growth and Expansion Outlook for Beverage Ingredients in India

India is expected to grow at a CAGR of 5.3%, supported by increasing adoption of functional beverages, fortified waters, and dairy alternatives across urban and rural markets. Tier-2 and tier-3 cities are becoming growth hubs as cost-effective innovations scale.

  • Affordable fortified beverages penetrate secondary cities.
  • Plant protein and probiotics are gaining traction among MSMEs.
  • Public health campaigns boost demand for nutritional beverages.

Sales Outlook for Beverage Ingredients in China

The Beverage Ingredients Market in China is expected to grow at a CAGR of 5.7%, supported by demand for plant-based dairy alternatives, fortified juices, and probiotic teas. Government initiatives on sugar reduction and functional health reinforce adoption.
  • Soy, oat, and almond-based dairy alternatives are scaling fast.
  • Functional teas and herbal infusions gain strong consumer traction.
  • Policy-backed sugar reduction accelerates clean-label formulations.

In-depth Analysis of Beverage Ingredients in Germany

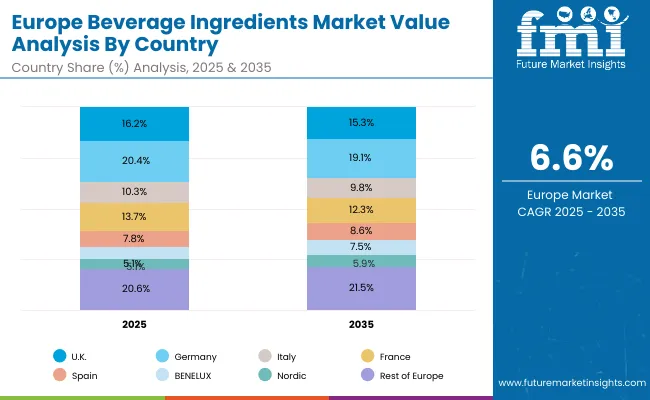
Beverage Ingredients Market Europe

Countries / Sub-regions 2025 Share (%)
UK 16.2%
Germany 20.4%
Italy 10.3%
France 13.7%
Spain 7.8%
BENELUX 5.9%
Nordic 5.1%
Rest of Europe 20.6%
Total 100%
Countries / Sub-regions 2035 Share (%)
UK 15.3%
Germany 19.1%
Italy 9.8%
France 12.3%
Spain 8.6%
BENELUX 7.5%
Nordic 5.9%
Rest of Europe 21.5%
Total 100%

The Beverage Ingredients Market in Germany is projected to grow at a CAGR of 6.6%, anchored by clean-label demand, probiotics, and natural colors. German manufacturers are leaders in sustainability-linked ingredient sourcing.
  • Natural colors and stevia-based sweeteners dominate reformulation.
  • Probiotic beverages are expanding in yogurt drinks and enhanced waters.
  • Sustainability leadership positions Germany as a European hub.

Growth Outlook for Beverage Ingredients in Japan

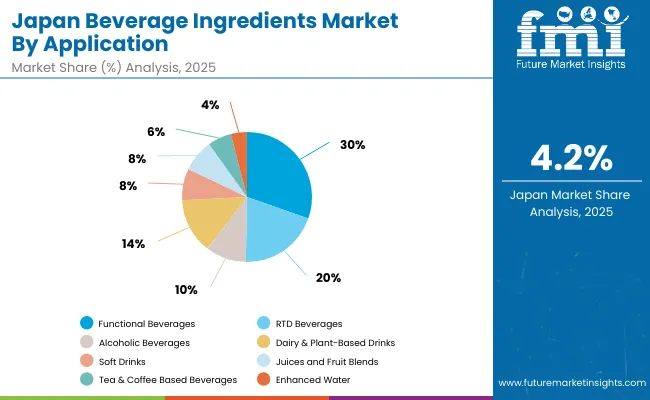
Beverage Ingredients Market Japan

Application Share (%)
Functional Beverages 30.4%
Others 69.6%

The Beverage Ingredients Market in Japan is anchored by functional beverages (30.4%) and RTD beverages (20.0%). Japan emphasizes bio-fermented ingredients, probiotics, and plant-based proteins, with innovation linked to consumer longevity and health trends.
  • Functional beverages dominate at 30.4%.
  • Fermentation and probiotics strengthen gut-health beverages.
  • AI-driven innovation drives personalization of RTDs.

Opportunity Analysis of South Korea Beverage Ingredients Market

Beverage Ingredients Market South Korea

Source Type Share (%)
Plant-Based 35.9%
Others 64.1%

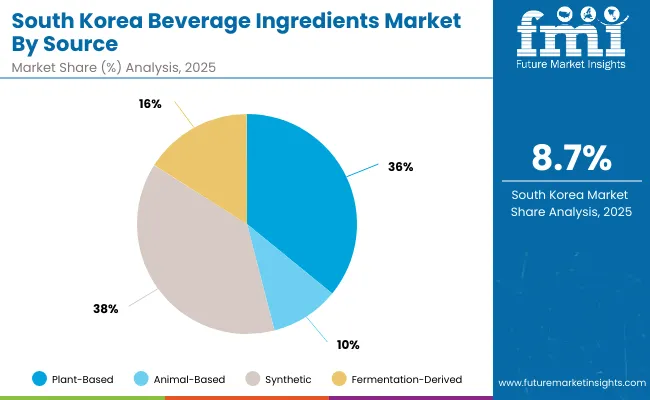
The Beverage Ingredients Market in South Korea is valued at USD 2,426.7 million in 2025 and is projected to reach USD 5,566.9 million by 2035, at a CAGR of 8.7%. Strong demand in energy drinks, RTDs, and functional teas drives consumption.
  • Synthetic (38%) and plant-based (35.9%) dominate demand.
  • Functional teas and probiotic waters are expanding rapidly.
  • Innovation in gut health beverages fuels market opportunities.

Competitive Landscape of Beverage Ingredients Market

Beverage Ingredients Market By Company

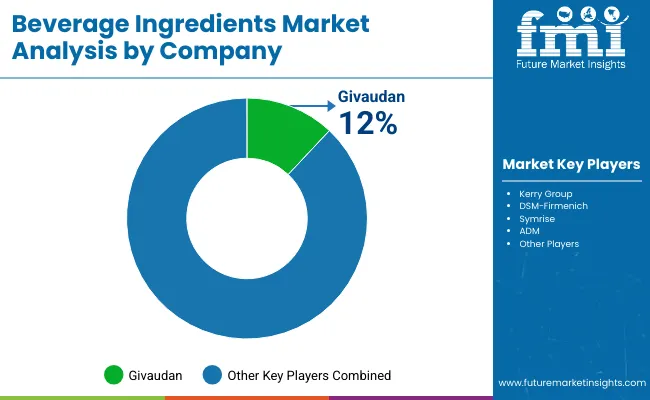
The Beverage Ingredients Market is moderately fragmented, with global leaders, mid-sized innovators, and niche-focused specialists competing across diverse application areas. Givaudan holds the dominant share, accounting for nearly 12% of the global market in 2025, supported by its leadership in flavors, botanicals, and nutritional solutions. Its global footprint, extensive flavor portfolio, and integration into functional and clean-label beverage formulations make it the largest player worldwide.

Kerry Group and DSM-Firmenich follow closely, with strong positioning in taste, nutrition, vitamins, and bioactive ingredients, catering to the rising demand for functional beverages and plant-based products. Their strategies emphasize innovation in sugar reduction, protein fortification, and natural flavor systems, ensuring deep penetration across RTDs, dairy alternatives, and nutraceutical drinks.

Symrise and ADM are also prominent, leveraging their expertise in natural ingredients, wild flavors, and specialty nutrition. ADM’s strength lies in its Wild Flavors & Specialty Ingredients division, which plays a central role in natural extracts and flavor systems. Symrise is driving growth through natural ingredients and nutraceuticals, targeting functional teas, enhanced waters, and premium beverages.

Specialized and regional players make up more than half of the market, focusing on botanical extracts, probiotics, fermentation-derived solutions, and plant-based proteins. These companies leverage niche applications, sustainability-linked sourcing, and regional adaptability to remain competitive.

Competitive differentiation is shifting away from commodity sweeteners and preservatives toward functional science-backed ingredients, plant-based innovations, and integrated ecosystems that combine R&D partnerships, clean-label compliance, and consumer wellness platforms. Subscription-based supply models, sustainability certifications, and traceability platforms are becoming critical to securing long-term customer loyalty.

Key Developments in Beverage Ingredients Market

  • On March 3, 2025, Symrise and Infusd Nutrition announced a strategic partnership to launch a new range of premium active ingredients for water-soluble formulations. These include science-backed ingredients such as Omega-3 made soluble in beverage, nutrient shots, and ready-to-mix powders.
  • On June 2, 2025, at Bridge2Food Summit Europe, Symrise showcased future-forward taste solutions for plant-based products, including oat yoghurt, vegan cheese, and milk alternatives, leveraging new technologies for filtering taste, masking off-notes, and improving mouthfeel.

Scope of the Report

Item Value
Quantitative Units USD 112,345.0 million
Ingredient Type Sweeteners, Flavors, Colors, Acidulants, Preservatives, Emulsifiers & Stabilizers, Functional Ingredients, Carbonation Additives, Prebiotics & Probiotics
Source Plant-Based, Animal-Based, Synthetic, Fermentation-Derived
Application Functional Beverages, RTD Beverages, Alcoholic Beverages, Dairy & Plant-Based Drinks, Soft Drinks, Juices and Fruit Blends, Tea & Coffee Based Beverages, Enhanced Water
Regions Covered North America, Europe, East Asia, South Asia & Pacific, Latin America, Middle East & Africa
Country Covered United States, Canada, Germany, France, United Kingdom, China, Japan, India, Brazil, South Korea
Key Companies Profiled Givaudan, Kerry Group, DSM- Firmenich, Symrise, ADM
Additional Attributes Dollar sales by ingredient type and application, adoption trends in functional beverages and dairy alternatives, rising demand for plant-based and clean-label beverages, sector-specific growth in RTD, energy drinks, and nutraceutical shots, source-wise revenue segmentation, integration of probiotics and nootropics, regional trends influenced by sugar-reduction policies, and innovations in plant proteins, natural colors, and fermentation-derived ingredients.

Key Segments

By Ingredient Type:

  • Sweeteners
    • Natural (Stevia, Monk Fruit, Honey, Agave)
    • Artificial (Aspartame, Sucralose, Acesulfame K)
  • Flavors
    • Natural (Fruit Extracts, Herbal, Botanical)
    • Synthetic
  • Colors
    • Natural (Anthocyanins, Carotenoids, Curcumin)
    • Synthetic
  • Acidulants
    • Citric Acid
    • Phosphoric Acid
    • Malic Acid
  • Preservatives
    • Sodium Benzoate
    • Potassium Sorbate
    • Natural Alternatives (Rosemary Extract, Nisin)
  • Emulsifiers & Stabilizers
    • Gum Arabic
    • Pectin
    • Carrageenan
  • Functional Ingredients
    • Caffeine (Natural, Synthetic)
    • L-Theanine
    • Electrolytes (Sodium, Potassium, Magnesium)
    • Adaptogens (Ashwagandha, Ginseng)
    • Others
  • Carbonation Additives
    • CO₂ (Carbon Dioxide Gas)
  • Prebiotics & Probiotics
    • Inulin, FOS
    • Bacillus coagulans, Lactic Acid Bacteria

By Source:

  • Plant-Based (Herbal Extracts, Fruit Juices, Natural Colors)
  • Animal-Based (Collagen, Dairy Protein)
  • Synthetic (Artificial Sweeteners, Flavors, Preservatives)
  • Fermentation-Derived (Enzymes, Probiotics, Amino Acids)

By Application:

  • Functional Beverages
    • Sports Drinks
    • Energy Drinks
    • Nutraceutical Shots
  • RTD (Ready-to-Drink) Beverages
  • Alcoholic Beverages (Cocktail Mixers, Hard Seltzers)
  • Dairy & Plant-Based Drinks (Milkshakes, Oat Milk)
  • Soft Drinks (Cola, Lemonade, Tonic)
  • Juices and Fruit Blends
  • Tea & Coffee Based Beverages
  • Enhanced Water (Flavored, Vitamin Water)

By Region:

  • North America
  • Latin America
  • Europe
  • East Asia
  • South Asia & Pacific
  • Middle East and Africa

Table of Content

  1. Executive Summary
    • Global Market Outlook
    • Demand-side Trends
    • Supply-side Trends
    • Technology Roadmap Analysis
    • Analysis and Recommendations
  2. Market Overview
    • Market Coverage / Taxonomy
    • Market Definition / Scope / Limitations
  3. Market Background
    • Market Dynamics
      • Drivers
      • Restraints
      • Opportunity
      • Trends
    • Scenario Forecast
      • Demand in Optimistic Scenario
      • Demand in Likely Scenario
      • Demand in Conservative Scenario
    • Opportunity Map Analysis
    • Product Life Cycle Analysis
    • Supply Chain Analysis
      • Supply Side Participants and their Roles
        • Producers
        • Mid-Level Participants (Traders/ Agents/ Brokers)
        • Wholesalers and Distributors
      • Value Added and Value Created at Node in the Supply Chain
      • List of Raw Material Suppliers
      • List of Existing and Potential Buyer’s
    • Investment Feasibility Matrix
    • Value Chain Analysis
      • Profit Margin Analysis
      • Wholesalers and Distributors
      • Retailers
    • PESTLE and Porter’s Analysis
    • Regulatory Landscape
      • By Key Regions
      • By Key Countries
    • Regional Parent Market Outlook
    • Production and Consumption Statistics
    • Import and Export Statistics
  4. Global Market Analysis 2020 to 2024 and Forecast, 2025 to 2035
    • Historical Market Size Value (USD Million) & Volume (Units) Analysis, 2020 to 2024
    • Current and Future Market Size Value (USD Million) & Volume (Units) Projections, 2025 to 2035
      • Y-o-Y Growth Trend Analysis
      • Absolute $ Opportunity Analysis
  5. Global Market Analysis 2020 to 2024 and Forecast 2025 to 2035, By Ingredient Type
    • Introduction / Key Findings
    • Historical Market Size Value (USD Million) & Volume (Units) Analysis By Ingredient Type, 2020 to 2024
    • Current and Future Market Size Value (USD Million) & Volume (Units) Analysis and Forecast By Ingredient Type, 2025 to 2035
      • Sweeteners
        • Natural (Stevia, Monk Fruit, Honey, Agave)
        • Artificial (Aspartame, Sucralose, Acesulfame K)
      • Flavors
        • Natural (Fruit Extracts, Herbal, Botanical)
        • Synthetic
      • Colors
        • Natural (Anthocyanins, Carotenoids, Curcumin)
        • Synthetic
      • Acidulants
        • Citric Acid
        • Phosphoric Acid
        • Malic Acid
      • Preservatives
        • Sodium Benzoate
        • Potassium Sorbate
        • Natural Alternatives (Rosemary Extract, Nisin)
      • Emulsifiers & Stabilizers
        • Gum Arabic
        • Pectin
        • Carrageenan
      • Functional Ingredients
        • Caffeine (Natural, Synthetic)
        • L-Theanine
        • Electrolytes (Sodium, Potassium, Magnesium)
        • Adaptogens (Ashwagandha, Ginseng)
        • Others
      • Carbonation Additives
        • CO₂ (Carbon Dioxide Gas)
      • Prebiotics & Probiotics
        • Inulin, FOS
        • Bacillus coagulans, Lactic Acid Bacteria
    • Y-o-Y Growth Trend Analysis By Ingredient Type, 2020 to 2024
    • Absolute $ Opportunity Analysis By Ingredient Type, 2025 to 2035
  6. Global Market Analysis 2020 to 2024 and Forecast 2025 to 2035, By Source
    • Introduction / Key Findings
    • Historical Market Size Value (USD Million) & Volume (Units) Analysis By Source, 2020 to 2024
    • Current and Future Market Size Value (USD Million) & Volume (Units) Analysis and Forecast By Source, 2025 to 2035
      • Plant-Based (Herbal Extracts, Fruit Juices, Natural Colors)
      • Animal-Based (Collagen, Dairy Protein)
      • Synthetic (Artificial Sweeteners, Flavors, Preservatives)
      • Fermentation-Derived (Enzymes, Probiotics, Amino Acids)
    • Y-o-Y Growth Trend Analysis By Source, 2020 to 2024
    • Absolute $ Opportunity Analysis By Source, 2025 to 2035
  7. Global Market Analysis 2020 to 2024 and Forecast 2025 to 2035, By Application
    • Introduction / Key Findings
    • Historical Market Size Value (USD Million) & Volume (Units) Analysis By Application, 2020 to 2024
    • Current and Future Market Size Value (USD Million) & Volume (Units) Analysis and Forecast By Application, 2025 to 2035
      • Functional Beverages
        • Sports Drinks
        • Energy Drinks
        • Nutraceutical Shots
      • RTD (Ready-to-Drink) Beverages
      • Alcoholic Beverages (Cocktail Mixers, Hard Seltzers)
      • Dairy & Plant-Based Drinks (Milkshakes, Oat Milk)
      • Soft Drinks (Cola, Lemonade, Tonic)
      • Juices and Fruit Blends
      • Tea & Coffee Based Beverages
      • Enhanced Water (Flavored, Vitamin Water)
    • Y-o-Y Growth Trend Analysis By Application, 2020 to 2024
    • Absolute $ Opportunity Analysis By Application, 2025 to 2035
  8. Global Market Analysis 2020 to 2024 and Forecast 2025 to 2035, By Region
    • Introduction
    • Historical Market Size Value (USD Million) & Volume (Units) Analysis By Region, 2020 to 2024
    • Current Market Size Value (USD Million) & Volume (Units) Analysis and Forecast By Region, 2025 to 2035
      • North America
      • Latin America
      • Europe
      • East Asia
      • South Asia & Pacific
      • Middle East and Africa
    • Market Attractiveness Analysis By Region
  9. North America Market Analysis 2020 to 2024 and Forecast 2025 to 2035, By Country
    • Historical Market Size Value (USD Million) & Volume (Units) Trend Analysis By Market Taxonomy, 2020 to 2024
    • Market Size Value (USD Million) & Volume (Units) Forecast By Market Taxonomy, 2025 to 2035
      • By Country
        • USA
        • Canada
      • By Ingredient Type
      • By Source
      • By Application
    • Market Attractiveness Analysis
      • By Country
      • By Ingredient Type
      • By Source
      • By Application
    • Key Takeaways
  10. Latin America Market Analysis 2020 to 2024 and Forecast 2025 to 2035, By Country
    • Historical Market Size Value (USD Million) & Volume (Units) Trend Analysis By Market Taxonomy, 2020 to 2024
    • Market Size Value (USD Million) & Volume (Units) Forecast By Market Taxonomy, 2025 to 2035
      • By Country
        • Brazil
        • Mexico
        • Colombia
        • Rest of Latin America
      • By Ingredient Type
      • By Source
      • By Application
    • Market Attractiveness Analysis
      • By Country
      • By Ingredient Type
      • By Source
      • By Application
    • Key Takeaways
  11. Europe Market Analysis 2020 to 2024 and Forecast 2025 to 2035, By Country
    • Historical Market Size Value (USD Million) & Volume (Units) Trend Analysis By Market Taxonomy, 2020 to 2024
    • Market Size Value (USD Million) & Volume (Units) Forecast By Market Taxonomy, 2025 to 2035
      • By Country
        • Germany
        • UK
        • France
        • Italy
        • Spain
        • Belgium
        • Netherlands
        • Nordic
        • Switzerland
        • Russia
        • Poland
        • Rest of Europe
      • By Ingredient Type
      • By Source
      • By Application
    • Market Attractiveness Analysis
      • By Country
      • By Ingredient Type
      • By Source
      • By Application
    • Key Takeaways
  12. East Asia Market Analysis 2020 to 2024 and Forecast 2025 to 2035, By Country
    • Historical Market Size Value (USD Million) & Volume (Units) Trend Analysis By Market Taxonomy, 2020 to 2024
    • Market Size Value (USD Million) & Volume (Units) Forecast By Market Taxonomy, 2025 to 2035
      • By Country
        • China
        • Japan
        • South Korea
      • By Ingredient Type
      • By Source
      • By Application
    • Market Attractiveness Analysis
      • By Country
      • By Ingredient Type
      • By Source
      • By Application
    • Key Takeaways
  13. South Asia & Pacific Market Analysis 2020 to 2024 and Forecast 2025 to 2035, By Country
    • Historical Market Size Value (USD Million) & Volume (Units) Trend Analysis By Market Taxonomy, 2020 to 2024
    • Market Size Value (USD Million) & Volume (Units) Forecast By Market Taxonomy, 2025 to 2035
      • By Country
        • India
        • Thailand
        • Malaysia
        • Indonesia
        • Singapore
        • Vietnam
        • Australia
        • New Zealand
        • Rest of South Asia
      • By Ingredient Type
      • By Source
      • By Application
    • Market Attractiveness Analysis
      • By Country
      • By Ingredient Type
      • By Source
      • By Application
    • Key Takeaways
  14. Middle East and Africa Market Analysis 2020 to 2024 and Forecast 2025 to 2035, By Country
    • Historical Market Size Value (USD Million) & Volume (Units) Trend Analysis By Market Taxonomy, 2020 to 2024
    • Market Size Value (USD Million) & Volume (Units) Forecast By Market Taxonomy, 2025 to 2035
      • By Country
        • Turkey
        • UAE
        • Saudi Arabia
        • Israel
        • Other GCC Countries
        • North Africa
        • South Africa
      • By Ingredient Type
      • By Source
      • By Application
    • Market Attractiveness Analysis
      • By Country
      • By Ingredient Type
      • By Source
      • By Application
    • Key Takeaways
  15. Key Countries Market Analysis
    • USA
      • Pricing Analysis
      • Market Share Analysis, 2024
        • By Ingredient Type
        • By Source
        • By Application
    • Canada
      • Pricing Analysis
      • Market Share Analysis, 2024
        • By Ingredient Type
        • By Source
        • By Application
    • Brazil
      • Pricing Analysis
      • Market Share Analysis, 2024
        • By Ingredient Type
        • By Source
        • By Application
    • Mexico
      • Pricing Analysis
      • Market Share Analysis, 2024
        • By Ingredient Type
        • By Source
        • By Application
    • Colombia
      • Pricing Analysis
      • Market Share Analysis, 2024
        • By Ingredient Type
        • By Source
        • By Application
    • Germany
      • Pricing Analysis
      • Market Share Analysis, 2024
        • By Ingredient Type
        • By Source
        • By Application
    • UK
      • Pricing Analysis
      • Market Share Analysis, 2024
        • By Ingredient Type
        • By Source
        • By Application
    • France
      • Pricing Analysis
      • Market Share Analysis, 2024
        • By Ingredient Type
        • By Source
        • By Application
    • Italy
      • Pricing Analysis
      • Market Share Analysis, 2024
        • By Ingredient Type
        • By Source
        • By Application
    • Spain
      • Pricing Analysis
      • Market Share Analysis, 2024
        • By Ingredient Type
        • By Source
        • By Application
    • Belgium
      • Pricing Analysis
      • Market Share Analysis, 2024
        • By Ingredient Type
        • By Source
        • By Application
    • Netherlands
      • Pricing Analysis
      • Market Share Analysis, 2024
        • By Ingredient Type
        • By Source
        • By Application
    • Nordic
      • Pricing Analysis
      • Market Share Analysis, 2024
        • By Ingredient Type
        • By Source
        • By Application
    • Switzerland
      • Pricing Analysis
      • Market Share Analysis, 2024
        • By Ingredient Type
        • By Source
        • By Application
    • Russia
      • Pricing Analysis
      • Market Share Analysis, 2024
        • By Ingredient Type
        • By Source
        • By Application
    • Poland
      • Pricing Analysis
      • Market Share Analysis, 2024
        • By Ingredient Type
        • By Source
        • By Application
    • China
      • Pricing Analysis
      • Market Share Analysis, 2024
        • By Ingredient Type
        • By Source
        • By Application
    • Japan
      • Pricing Analysis
      • Market Share Analysis, 2024
        • By Ingredient Type
        • By Source
        • By Application
    • South Korea
      • Pricing Analysis
      • Market Share Analysis, 2024
        • By Ingredient Type
        • By Source
        • By Application
    • India
      • Pricing Analysis
      • Market Share Analysis, 2024
        • By Ingredient Type
        • By Source
        • By Application
    • Thailand
      • Pricing Analysis
      • Market Share Analysis, 2024
        • By Ingredient Type
        • By Source
        • By Application
    • Indonesia
      • Pricing Analysis
      • Market Share Analysis, 2024
        • By Ingredient Type
        • By Source
        • By Application
    • Australia
      • Pricing Analysis
      • Market Share Analysis, 2024
        • By Ingredient Type
        • By Source
        • By Application
    • New Zealand
      • Pricing Analysis
      • Market Share Analysis, 2024
        • By Ingredient Type
        • By Source
        • By Application
    • Turkey
      • Pricing Analysis
      • Market Share Analysis, 2024
        • By Ingredient Type
        • By Source
        • By Application
    • UAE
      • Pricing Analysis
      • Market Share Analysis, 2024
        • By Ingredient Type
        • By Source
        • By Application
    • Saudi Arabia
      • Pricing Analysis
      • Market Share Analysis, 2024
        • By Ingredient Type
        • By Source
        • By Application
    • Israel
      • Pricing Analysis
      • Market Share Analysis, 2024
        • By Ingredient Type
        • By Source
        • By Application
    • North Africa
      • Pricing Analysis
      • Market Share Analysis, 2024
        • By Ingredient Type
        • By Source
        • By Application
    • South Africa
      • Pricing Analysis
      • Market Share Analysis, 2024
        • By Ingredient Type
        • By Source
        • By Application
  16. Market Structure Analysis
    • Competition Dashboard
    • Competition Benchmarking
    • Market Share Analysis of Top Players
      • By Regional
      • By Ingredient Type
      • By Source
      • By Application
  17. Competition Analysis
    • Competition Deep Dive
      • Givaudan (Flavors, Botanicals, Nutritional Solutions)
        • Overview
        • Product Portfolio
        • Profitability by Market Segments (Product/Age /Sales Channel/Region)
        • Sales Footprint
        • Strategy Overview
          • Marketing Strategy
          • Product Strategy
          • Channel Strategy
      • Kerry Group (Taste & Nutrition Ingredients)
        • Overview
        • Product Portfolio
        • Profitability by Market Segments (Product/Age /Sales Channel/Region)
        • Sales Footprint
        • Strategy Overview
          • Marketing Strategy
          • Product Strategy
          • Channel Strategy
      • DSM-Firmenich (Vitamins, Botanicals, Bioactives)
        • Overview
        • Product Portfolio
        • Profitability by Market Segments (Product/Age /Sales Channel/Region)
        • Sales Footprint
        • Strategy Overview
          • Marketing Strategy
          • Product Strategy
          • Channel Strategy
      • Symrise (Flavors, Natural Ingredients, Nutraceuticals)
        • Overview
        • Product Portfolio
        • Profitability by Market Segments (Product/Age /Sales Channel/Region)
        • Sales Footprint
        • Strategy Overview
          • Marketing Strategy
          • Product Strategy
          • Channel Strategy
      • ADM (Wild Flavors & Specialty Ingredients)
        • Overview
        • Product Portfolio
        • Profitability by Market Segments (Product/Age /Sales Channel/Region)
        • Sales Footprint
        • Strategy Overview
          • Marketing Strategy
          • Product Strategy
          • Channel Strategy
  18. Assumptions & Acronyms Used
  19. Research Methodology

List of Tables

  • Table 1: Global Market Value (USD Million) Forecast by Region, 2020-2035
  • Table 2: Global Market Volume (Units) Forecast by Region, 2020-2035
  • Table 3: Global Market Value (USD Million) Forecast by Ingredient Type, 2020-2035
  • Table 4: Global Market Volume (Units) Forecast by Ingredient Type, 2020-2035
  • Table 5: Global Market Value (USD Million) Forecast by Source, 2020-2035
  • Table 6: Global Market Volume (Units) Forecast by Source, 2020-2035
  • Table 7: Global Market Value (USD Million) Forecast by Application, 2020-2035
  • Table 8: Global Market Volume (Units) Forecast by Application, 2020-2035
  • Table 9: North America Market Value (USD Million) Forecast by Country, 2020-2035
  • Table 10: North America Market Volume (Units) Forecast by Country, 2020-2035
  • Table 11: North America Market Value (USD Million) Forecast by Ingredient Type, 2020-2035
  • Table 12: North America Market Volume (Units) Forecast by Ingredient Type, 2020-2035
  • Table 13: North America Market Value (USD Million) Forecast by Source, 2020-2035
  • Table 14: North America Market Volume (Units) Forecast by Source, 2020-2035
  • Table 15: North America Market Value (USD Million) Forecast by Application, 2020-2035
  • Table 16: North America Market Volume (Units) Forecast by Application, 2020-2035
  • Table 17: Latin America Market Value (USD Million) Forecast by Country, 2020-2035
  • Table 18: Latin America Market Volume (Units) Forecast by Country, 2020-2035
  • Table 19: Latin America Market Value (USD Million) Forecast by Ingredient Type, 2020-2035
  • Table 20: Latin America Market Volume (Units) Forecast by Ingredient Type, 2020-2035
  • Table 21: Latin America Market Value (USD Million) Forecast by Source, 2020-2035
  • Table 22: Latin America Market Volume (Units) Forecast by Source, 2020-2035
  • Table 23: Latin America Market Value (USD Million) Forecast by Application, 2020-2035
  • Table 24: Latin America Market Volume (Units) Forecast by Application, 2020-2035
  • Table 25: Europe Market Value (USD Million) Forecast by Country, 2020-2035
  • Table 26: Europe Market Volume (Units) Forecast by Country, 2020-2035
  • Table 27: Europe Market Value (USD Million) Forecast by Ingredient Type, 2020-2035
  • Table 28: Europe Market Volume (Units) Forecast by Ingredient Type, 2020-2035
  • Table 29: Europe Market Value (USD Million) Forecast by Source, 2020-2035
  • Table 30: Europe Market Volume (Units) Forecast by Source, 2020-2035
  • Table 31: Europe Market Value (USD Million) Forecast by Application, 2020-2035
  • Table 32: Europe Market Volume (Units) Forecast by Application, 2020-2035
  • Table 33: East Asia Market Value (USD Million) Forecast by Country, 2020-2035
  • Table 34: East Asia Market Volume (Units) Forecast by Country, 2020-2035
  • Table 35: East Asia Market Value (USD Million) Forecast by Ingredient Type, 2020-2035
  • Table 36: East Asia Market Volume (Units) Forecast by Ingredient Type, 2020-2035
  • Table 37: East Asia Market Value (USD Million) Forecast by Source, 2020-2035
  • Table 38: East Asia Market Volume (Units) Forecast by Source, 2020-2035
  • Table 39: East Asia Market Value (USD Million) Forecast by Application, 2020-2035
  • Table 40: East Asia Market Volume (Units) Forecast by Application, 2020-2035
  • Table 41: South Asia & Pacific Market Value (USD Million) Forecast by Country, 2020-2035
  • Table 42: South Asia & Pacific Market Volume (Units) Forecast by Country, 2020-2035
  • Table 43: South Asia & Pacific Market Value (USD Million) Forecast by Ingredient Type, 2020-2035
  • Table 44: South Asia & Pacific Market Volume (Units) Forecast by Ingredient Type, 2020-2035
  • Table 45: South Asia & Pacific Market Value (USD Million) Forecast by Source, 2020-2035
  • Table 46: South Asia & Pacific Market Volume (Units) Forecast by Source, 2020-2035
  • Table 47: South Asia & Pacific Market Value (USD Million) Forecast by Application, 2020-2035
  • Table 48: South Asia & Pacific Market Volume (Units) Forecast by Application, 2020-2035
  • Table 49: Middle East and Africa Market Value (USD Million) Forecast by Country, 2020-2035
  • Table 50: Middle East and Africa Market Volume (Units) Forecast by Country, 2020-2035
  • Table 51: Middle East and Africa Market Value (USD Million) Forecast by Ingredient Type, 2020-2035
  • Table 52: Middle East and Africa Market Volume (Units) Forecast by Ingredient Type, 2020-2035
  • Table 53: Middle East and Africa Market Value (USD Million) Forecast by Source, 2020-2035
  • Table 54: Middle East and Africa Market Volume (Units) Forecast by Source, 2020-2035
  • Table 55: Middle East and Africa Market Value (USD Million) Forecast by Application, 2020-2035
  • Table 56: Middle East and Africa Market Volume (Units) Forecast by Application, 2020-2035

List of Figures

  • Figure 1: Global Market Value (USD Million) by Ingredient Type, 2025-2035
  • Figure 2: Global Market Value (USD Million) by Source, 2025-2035
  • Figure 3: Global Market Value (USD Million) by Application, 2025-2035
  • Figure 4: Global Market Value (USD Million) by Region, 2025-2035
  • Figure 5: Global Market Value (USD Million) Analysis by Region, 2020-2035
  • Figure 6: Global Market Volume (Units) Analysis by Region, 2020-2035
  • Figure 7: Global Market Value Share (%) and BPS Analysis by Region, 2025-2035
  • Figure 8: Global Market Y-o-Y Growth (%) Projections by Region, 2025-2035
  • Figure 9: Global Market Value (USD Million) Analysis by Ingredient Type, 2020-2035
  • Figure 10: Global Market Volume (Units) Analysis by Ingredient Type, 2020-2035
  • Figure 11: Global Market Value Share (%) and BPS Analysis by Ingredient Type, 2025-2035
  • Figure 12: Global Market Y-o-Y Growth (%) Projections by Ingredient Type, 2025-2035
  • Figure 13: Global Market Value (USD Million) Analysis by Source, 2020-2035
  • Figure 14: Global Market Volume (Units) Analysis by Source, 2020-2035
  • Figure 15: Global Market Value Share (%) and BPS Analysis by Source, 2025-2035
  • Figure 16: Global Market Y-o-Y Growth (%) Projections by Source, 2025-2035
  • Figure 17: Global Market Value (USD Million) Analysis by Application, 2020-2035
  • Figure 18: Global Market Volume (Units) Analysis by Application, 2020-2035
  • Figure 19: Global Market Value Share (%) and BPS Analysis by Application, 2025-2035
  • Figure 20: Global Market Y-o-Y Growth (%) Projections by Application, 2025-2035
  • Figure 21: Global Market Attractiveness by Ingredient Type, 2025-2035
  • Figure 22: Global Market Attractiveness by Source, 2025-2035
  • Figure 23: Global Market Attractiveness by Application, 2025-2035
  • Figure 24: Global Market Attractiveness by Region, 2025-2035
  • Figure 25: North America Market Value (USD Million) by Ingredient Type, 2025-2035
  • Figure 26: North America Market Value (USD Million) by Source, 2025-2035
  • Figure 27: North America Market Value (USD Million) by Application, 2025-2035
  • Figure 28: North America Market Value (USD Million) by Country, 2025-2035
  • Figure 29: North America Market Value (USD Million) Analysis by Country, 2020-2035
  • Figure 30: North America Market Volume (Units) Analysis by Country, 2020-2035
  • Figure 31: North America Market Value Share (%) and BPS Analysis by Country, 2025-2035
  • Figure 32: North America Market Y-o-Y Growth (%) Projections by Country, 2025-2035
  • Figure 33: North America Market Value (USD Million) Analysis by Ingredient Type, 2020-2035
  • Figure 34: North America Market Volume (Units) Analysis by Ingredient Type, 2020-2035
  • Figure 35: North America Market Value Share (%) and BPS Analysis by Ingredient Type, 2025-2035
  • Figure 36: North America Market Y-o-Y Growth (%) Projections by Ingredient Type, 2025-2035
  • Figure 37: North America Market Value (USD Million) Analysis by Source, 2020-2035
  • Figure 38: North America Market Volume (Units) Analysis by Source, 2020-2035
  • Figure 39: North America Market Value Share (%) and BPS Analysis by Source, 2025-2035
  • Figure 40: North America Market Y-o-Y Growth (%) Projections by Source, 2025-2035
  • Figure 41: North America Market Value (USD Million) Analysis by Application, 2020-2035
  • Figure 42: North America Market Volume (Units) Analysis by Application, 2020-2035
  • Figure 43: North America Market Value Share (%) and BPS Analysis by Application, 2025-2035
  • Figure 44: North America Market Y-o-Y Growth (%) Projections by Application, 2025-2035
  • Figure 45: North America Market Attractiveness by Ingredient Type, 2025-2035
  • Figure 46: North America Market Attractiveness by Source, 2025-2035
  • Figure 47: North America Market Attractiveness by Application, 2025-2035
  • Figure 48: North America Market Attractiveness by Country, 2025-2035
  • Figure 49: Latin America Market Value (USD Million) by Ingredient Type, 2025-2035
  • Figure 50: Latin America Market Value (USD Million) by Source, 2025-2035
  • Figure 51: Latin America Market Value (USD Million) by Application, 2025-2035
  • Figure 52: Latin America Market Value (USD Million) by Country, 2025-2035
  • Figure 53: Latin America Market Value (USD Million) Analysis by Country, 2020-2035
  • Figure 54: Latin America Market Volume (Units) Analysis by Country, 2020-2035
  • Figure 55: Latin America Market Value Share (%) and BPS Analysis by Country, 2025-2035
  • Figure 56: Latin America Market Y-o-Y Growth (%) Projections by Country, 2025-2035
  • Figure 57: Latin America Market Value (USD Million) Analysis by Ingredient Type, 2020-2035
  • Figure 58: Latin America Market Volume (Units) Analysis by Ingredient Type, 2020-2035
  • Figure 59: Latin America Market Value Share (%) and BPS Analysis by Ingredient Type, 2025-2035
  • Figure 60: Latin America Market Y-o-Y Growth (%) Projections by Ingredient Type, 2025-2035
  • Figure 61: Latin America Market Value (USD Million) Analysis by Source, 2020-2035
  • Figure 62: Latin America Market Volume (Units) Analysis by Source, 2020-2035
  • Figure 63: Latin America Market Value Share (%) and BPS Analysis by Source, 2025-2035
  • Figure 64: Latin America Market Y-o-Y Growth (%) Projections by Source, 2025-2035
  • Figure 65: Latin America Market Value (USD Million) Analysis by Application, 2020-2035
  • Figure 66: Latin America Market Volume (Units) Analysis by Application, 2020-2035
  • Figure 67: Latin America Market Value Share (%) and BPS Analysis by Application, 2025-2035
  • Figure 68: Latin America Market Y-o-Y Growth (%) Projections by Application, 2025-2035
  • Figure 69: Latin America Market Attractiveness by Ingredient Type, 2025-2035
  • Figure 70: Latin America Market Attractiveness by Source, 2025-2035
  • Figure 71: Latin America Market Attractiveness by Application, 2025-2035
  • Figure 72: Latin America Market Attractiveness by Country, 2025-2035
  • Figure 73: Europe Market Value (USD Million) by Ingredient Type, 2025-2035
  • Figure 74: Europe Market Value (USD Million) by Source, 2025-2035
  • Figure 75: Europe Market Value (USD Million) by Application, 2025-2035
  • Figure 76: Europe Market Value (USD Million) by Country, 2025-2035
  • Figure 77: Europe Market Value (USD Million) Analysis by Country, 2020-2035
  • Figure 78: Europe Market Volume (Units) Analysis by Country, 2020-2035
  • Figure 79: Europe Market Value Share (%) and BPS Analysis by Country, 2025-2035
  • Figure 80: Europe Market Y-o-Y Growth (%) Projections by Country, 2025-2035
  • Figure 81: Europe Market Value (USD Million) Analysis by Ingredient Type, 2020-2035
  • Figure 82: Europe Market Volume (Units) Analysis by Ingredient Type, 2020-2035
  • Figure 83: Europe Market Value Share (%) and BPS Analysis by Ingredient Type, 2025-2035
  • Figure 84: Europe Market Y-o-Y Growth (%) Projections by Ingredient Type, 2025-2035
  • Figure 85: Europe Market Value (USD Million) Analysis by Source, 2020-2035
  • Figure 86: Europe Market Volume (Units) Analysis by Source, 2020-2035
  • Figure 87: Europe Market Value Share (%) and BPS Analysis by Source, 2025-2035
  • Figure 88: Europe Market Y-o-Y Growth (%) Projections by Source, 2025-2035
  • Figure 89: Europe Market Value (USD Million) Analysis by Application, 2020-2035
  • Figure 90: Europe Market Volume (Units) Analysis by Application, 2020-2035
  • Figure 91: Europe Market Value Share (%) and BPS Analysis by Application, 2025-2035
  • Figure 92: Europe Market Y-o-Y Growth (%) Projections by Application, 2025-2035
  • Figure 93: Europe Market Attractiveness by Ingredient Type, 2025-2035
  • Figure 94: Europe Market Attractiveness by Source, 2025-2035
  • Figure 95: Europe Market Attractiveness by Application, 2025-2035
  • Figure 96: Europe Market Attractiveness by Country, 2025-2035
  • Figure 97: East Asia Market Value (USD Million) by Ingredient Type, 2025-2035
  • Figure 98: East Asia Market Value (USD Million) by Source, 2025-2035
  • Figure 99: East Asia Market Value (USD Million) by Application, 2025-2035
  • Figure 100: East Asia Market Value (USD Million) by Country, 2025-2035
  • Figure 101: East Asia Market Value (USD Million) Analysis by Country, 2020-2035
  • Figure 102: East Asia Market Volume (Units) Analysis by Country, 2020-2035
  • Figure 103: East Asia Market Value Share (%) and BPS Analysis by Country, 2025-2035
  • Figure 104: East Asia Market Y-o-Y Growth (%) Projections by Country, 2025-2035
  • Figure 105: East Asia Market Value (USD Million) Analysis by Ingredient Type, 2020-2035
  • Figure 106: East Asia Market Volume (Units) Analysis by Ingredient Type, 2020-2035
  • Figure 107: East Asia Market Value Share (%) and BPS Analysis by Ingredient Type, 2025-2035
  • Figure 108: East Asia Market Y-o-Y Growth (%) Projections by Ingredient Type, 2025-2035
  • Figure 109: East Asia Market Value (USD Million) Analysis by Source, 2020-2035
  • Figure 110: East Asia Market Volume (Units) Analysis by Source, 2020-2035
  • Figure 111: East Asia Market Value Share (%) and BPS Analysis by Source, 2025-2035
  • Figure 112: East Asia Market Y-o-Y Growth (%) Projections by Source, 2025-2035
  • Figure 113: East Asia Market Value (USD Million) Analysis by Application, 2020-2035
  • Figure 114: East Asia Market Volume (Units) Analysis by Application, 2020-2035
  • Figure 115: East Asia Market Value Share (%) and BPS Analysis by Application, 2025-2035
  • Figure 116: East Asia Market Y-o-Y Growth (%) Projections by Application, 2025-2035
  • Figure 117: East Asia Market Attractiveness by Ingredient Type, 2025-2035
  • Figure 118: East Asia Market Attractiveness by Source, 2025-2035
  • Figure 119: East Asia Market Attractiveness by Application, 2025-2035
  • Figure 120: East Asia Market Attractiveness by Country, 2025-2035
  • Figure 121: South Asia & Pacific Market Value (USD Million) by Ingredient Type, 2025-2035
  • Figure 122: South Asia & Pacific Market Value (USD Million) by Source, 2025-2035
  • Figure 123: South Asia & Pacific Market Value (USD Million) by Application, 2025-2035
  • Figure 124: South Asia & Pacific Market Value (USD Million) by Country, 2025-2035
  • Figure 125: South Asia & Pacific Market Value (USD Million) Analysis by Country, 2020-2035
  • Figure 126: South Asia & Pacific Market Volume (Units) Analysis by Country, 2020-2035
  • Figure 127: South Asia & Pacific Market Value Share (%) and BPS Analysis by Country, 2025-2035
  • Figure 128: South Asia & Pacific Market Y-o-Y Growth (%) Projections by Country, 2025-2035
  • Figure 129: South Asia & Pacific Market Value (USD Million) Analysis by Ingredient Type, 2020-2035
  • Figure 130: South Asia & Pacific Market Volume (Units) Analysis by Ingredient Type, 2020-2035
  • Figure 131: South Asia & Pacific Market Value Share (%) and BPS Analysis by Ingredient Type, 2025-2035
  • Figure 132: South Asia & Pacific Market Y-o-Y Growth (%) Projections by Ingredient Type, 2025-2035
  • Figure 133: South Asia & Pacific Market Value (USD Million) Analysis by Source, 2020-2035
  • Figure 134: South Asia & Pacific Market Volume (Units) Analysis by Source, 2020-2035
  • Figure 135: South Asia & Pacific Market Value Share (%) and BPS Analysis by Source, 2025-2035
  • Figure 136: South Asia & Pacific Market Y-o-Y Growth (%) Projections by Source, 2025-2035
  • Figure 137: South Asia & Pacific Market Value (USD Million) Analysis by Application, 2020-2035
  • Figure 138: South Asia & Pacific Market Volume (Units) Analysis by Application, 2020-2035
  • Figure 139: South Asia & Pacific Market Value Share (%) and BPS Analysis by Application, 2025-2035
  • Figure 140: South Asia & Pacific Market Y-o-Y Growth (%) Projections by Application, 2025-2035
  • Figure 141: South Asia & Pacific Market Attractiveness by Ingredient Type, 2025-2035
  • Figure 142: South Asia & Pacific Market Attractiveness by Source, 2025-2035
  • Figure 143: South Asia & Pacific Market Attractiveness by Application, 2025-2035
  • Figure 144: South Asia & Pacific Market Attractiveness by Country, 2025-2035
  • Figure 145: Middle East and Africa Market Value (USD Million) by Ingredient Type, 2025-2035
  • Figure 146: Middle East and Africa Market Value (USD Million) by Source, 2025-2035
  • Figure 147: Middle East and Africa Market Value (USD Million) by Application, 2025-2035
  • Figure 148: Middle East and Africa Market Value (USD Million) by Country, 2025-2035
  • Figure 149: Middle East and Africa Market Value (USD Million) Analysis by Country, 2020-2035
  • Figure 150: Middle East and Africa Market Volume (Units) Analysis by Country, 2020-2035
  • Figure 151: Middle East and Africa Market Value Share (%) and BPS Analysis by Country, 2025-2035
  • Figure 152: Middle East and Africa Market Y-o-Y Growth (%) Projections by Country, 2025-2035
  • Figure 153: Middle East and Africa Market Value (USD Million) Analysis by Ingredient Type, 2020-2035
  • Figure 154: Middle East and Africa Market Volume (Units) Analysis by Ingredient Type, 2020-2035
  • Figure 155: Middle East and Africa Market Value Share (%) and BPS Analysis by Ingredient Type, 2025-2035
  • Figure 156: Middle East and Africa Market Y-o-Y Growth (%) Projections by Ingredient Type, 2025-2035
  • Figure 157: Middle East and Africa Market Value (USD Million) Analysis by Source, 2020-2035
  • Figure 158: Middle East and Africa Market Volume (Units) Analysis by Source, 2020-2035
  • Figure 159: Middle East and Africa Market Value Share (%) and BPS Analysis by Source, 2025-2035
  • Figure 160: Middle East and Africa Market Y-o-Y Growth (%) Projections by Source, 2025-2035
  • Figure 161: Middle East and Africa Market Value (USD Million) Analysis by Application, 2020-2035
  • Figure 162: Middle East and Africa Market Volume (Units) Analysis by Application, 2020-2035
  • Figure 163: Middle East and Africa Market Value Share (%) and BPS Analysis by Application, 2025-2035
  • Figure 164: Middle East and Africa Market Y-o-Y Growth (%) Projections by Application, 2025-2035
  • Figure 165: Middle East and Africa Market Attractiveness by Ingredient Type, 2025-2035
  • Figure 166: Middle East and Africa Market Attractiveness by Source, 2025-2035
  • Figure 167: Middle East and Africa Market Attractiveness by Application, 2025-2035
  • Figure 168: Middle East and Africa Market Attractiveness by Country, 2025-2035

Frequently Asked Questions

How big is the Beverage Ingredients Market in 2025?

The Beverage Ingredients Market is estimated to be valued at USD 112,345.0 million in 2025.

What will be the size of the Beverage Ingredients Market in 2035?

The market size for the Beverage Ingredients Market is projected to reach USD 201,698.6 million by 2035.

How much will be the Beverage Ingredients Market growth between 2025 and 2035?

The Beverage Ingredients Market is expected to grow at a 6.0% CAGR between 2025 and 2035.

What are the key ingredient types in the Beverage Ingredients Market?

The key ingredient types in the Beverage Ingredients Market are sweeteners, flavors, colors, acidulants, preservatives, emulsifiers & stabilizers, functional ingredients, carbonation additives, and prebiotics & probiotics.

Which ingredient segment will contribute significant share in the Beverage Ingredients Market in 2025?

In terms of ingredient type, the functional ingredients segment is expected to command the largest share of 28.4 % in the Beverage Ingredients Market in 2025.

Explore Similar Insights

Future Market Insights

Beverage Ingredients Market

Chat With

MaRIA

Hi There, I am MaRIA, Your Market Research Intelligence Assistant. How may I help you?