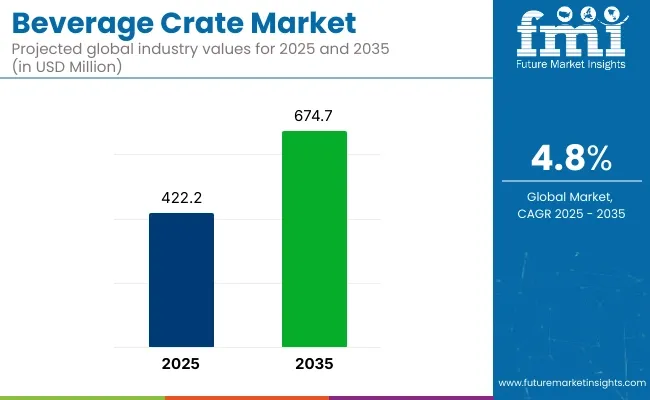
The beverage crates market is projected to grow from USD 422.2 million in 2025 to USD 674.7 million by 2035, registering a CAGR of 4.8% during the forecast period. Sales in 2024 reached USD 407.9 million, reflecting the sector's resilience and growing demand across breweries, soft drink manufacturers, and logistics industries. This growth is attributed to the increasing need for durable, reusable, and sustainable packaging solutions that ensure product integrity during storage and transportation.
| Metric | Value |
|---|---|
| Industry Size (2025E) | USD 422.2 million |
| Industry Value (2035F) | USD 674.7 million |
| CAGR (2025 to 2035) | 4.8% |
In an innovative step towards a circular economy and as a result of close collaboration, Tetra Pak and Schoeller Allibert will launch a new transport crate made of polyAl from used beverage cartons at was the first time displayed at the Plastics Recycling Show in Amsterdam, April 2025. Britta Wyss Bisang, VP Sustainability and Strategic MarCom, Schoeller Allibert highlighted the role of material innovation in building more efficient and sustainable supply chains: "For our customers, making supply chains more sustainable is a key priority, and material innovation is one of the main drivers in making that happen.
That’s why we are heavily investing in new ways to reduce the use of virgin plastic and use recycled materials such as polyAl. This project demonstrates how advanced recycling solutions can turn waste into durable, reusable packaging that supports circular logistics and thereby the transition to a circular economy.”
The shift towards sustainable and eco-friendly packaging solutions is influencing the beverage crate market. Manufacturers are focusing on developing crates that are recyclable, lightweight, and made from renewable resources. Innovations include the integration of RFID tracking systems, modular designs, and the use of recycled materials to reduce environmental impact.
These advancements align with global sustainability goals and regulatory requirements, making beverage crates an attractive option for environmentally conscious industries. Beverage crates, being reusable and recyclable, align with global sustainability goals. Innovations such as RFID tracking, ergonomic designs, and integration of smart technologies are being adopted to enhance product functionality and reduce environmental impact.
The beverage crate market is poised for significant growth, driven by increasing demand in breweries, soft drink manufacturers, and logistics industries. Companies investing in sustainable materials, innovative designs, and eco-friendly production processes are expected to gain a competitive edge. As global supply chains expand and environmental regulations become more stringent, the adoption of beverage crates is anticipated to rise, offering cost-effective and eco-friendly packaging solutions.
The below table presents the expected CAGR for the global beverage crate market over several semi-annual periods spanning from 2025 to 2035.
| Particular | Value CAGR |
|---|---|
| H1 (2024 to 2034) | 4.7% |
| H2 (2024 to 2034) | 4.9% |
| H1 (2025 to 2035) | 3.8% |
| H2 (2025 to 2035) | 5.8% |
In the first half (H1) of the decade from 2024 to 2034, the business is predicted to surge at a CAGR of 4.7%, followed by a slightly higher growth rate of 4.9% in the second half (H2) of the same decade. Moving into the subsequent period, from H1 2025 to H2 2035, the CAGR is projected to decrease slightly to 3.8% in the first half and rise to 5.8% in the second half. In the first half (H1) the market witnessed a decrease of 90 BPS while in the second half (H2), the market witnessed an increase of 90 BPS.
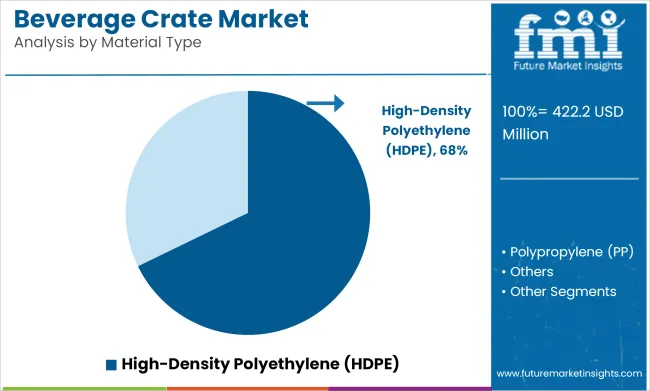
High-Density Polyethylene (HDPE) is projected to account for approximately 67.8% of the global beverage crate market by 2025, as it has been widely used for its exceptional strength-to-weight ratio, resistance to impact, and long service life. Beverage crates made from HDPE have been manufactured to endure repeated handling, washing, and stacking in both high-volume and high-temperature environments.
Superior resistance to chemicals, UV radiation, and moisture has enabled HDPE crates to perform reliably in both indoor and outdoor logistics operations. Their reusability over hundreds of distribution cycles has reduced total ownership cost for beverage manufacturers and distributors.
The ability of HDPE to be injection-molded into ergonomic and compartmentalized designs has supported the safe and efficient transport of glass, PET, and aluminum containers. Additionally, HDPE beverage crates have been increasingly produced with recycled resin, aligning with circular economy models and regulatory packaging mandates. As beverage supply chains move toward automation, environmental compliance, and cost optimization, HDPE is expected to remain the material of choice for crate manufacturing across all beverage categories.
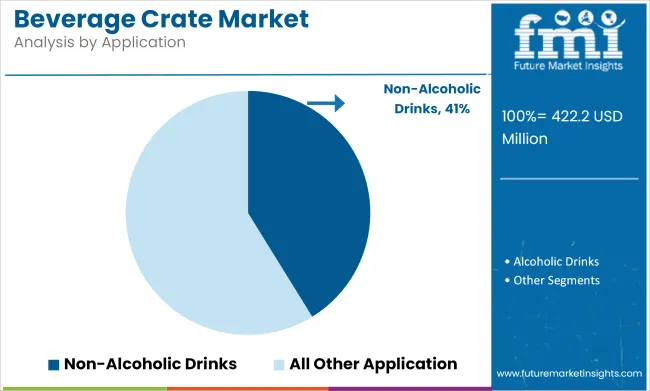
The non-alcoholic drinks segment is expected to dominate the beverage crate market by 2025, accounting for an estimated 41.2% market share, owing to the global rise in health-conscious consumption, population growth, and the frequent distribution cycles associated with daily-use beverage categories.
Crates for bottled water, fruit juices, carbonated drinks, tea, coffee, and milk have been deployed extensively in retail and institutional supply chains. Durable crate systems have been utilized for multi-trip transport of beverages across supermarkets, schools, hospitals, and commercial outlets where safety, convenience, and rapid turnover are critical. Enhanced stacking and nestability have been engineered into crate designs to maximize delivery vehicle capacity and minimize warehouse footprint.
In urban and semi-urban markets, the demand for refillable glass and plastic bottles has driven the continued use of returnable crate systems, especially in carbonated soft drink and dairy supply chains. Branding opportunities on crate surfaces have also been leveraged by manufacturers to promote visibility at point-of-sale locations.
As demand for packaged non-alcoholic beverages increases and distribution networks scale in both emerging and developed economies, crates used for this segment are anticipated to maintain their market leadership through robust design and cost-effective reusability.
Rising closed-loop systems drive demand for durable, reusable HDPE beverage crates
Zero tolerance is being adopted globally in terms of plastic waste. Consumers are also attracted to eco-friendly products and currently are more vocal in asking beverages to shift from disposables to the reusable plastic and wooden crates wherever possible. However, long-term saving, durability, and little environmental waste of this kind of packaging make it popular among beverage companies.
Several manufacturers have invested in premium, recyclable materials like HDPE and PP to ensure their crates last much longer. Additionally, the Closed-loop supply chain and deposit return systems are rapidly increasing demand, which is in turn pushing sustainable beverage crates used in logistics and retail operations.
Rising urbanization fuels demand for sustainable, durable beverage crate solutions
Increased consumption of alcoholic and non-alcoholic beverages worldwide is the primary demand driver for durable, reusable beverage crates. Huge volumes of bottled water, beer, and carbonated drinks produced and distributed in emerging markets have translated into a raised need for efficient packaging and transportation solutions. Beverage crates can store and transport large quantities of bottles in an inexpensive and sustainable manner while ensuring product safety and minimizing breakage.
An enlarging urban populace, changing patterns of consumer's lifestyle, as well as augmented demand for Ready-to-Drink beverages, makes the scope wider for beverage manufactures. Consequently, the demand rises for robust packing solutions. Manufacturers have also invested in high-quality plastic and wooden crates due to the growing focus on sustainability. It also sends a message that promotes the circular economy projects and reduces single-use packing waste.
Volatile raw material costs challenge stable pricing for beverage crate manufacturers
Any one of the crate-making beverage companies will face its most significant challenge with raw material price, thus determining total cost of production and price positioning. The crate is composed of two raw materials: first, plastic resins, or secondly, wood. While among the plastic resins used, HDPE and PP are the most common, they are very sensitive to market shocks, especially on crude oil price fluctuations, interruptions of the supply chain, and geopolitical issues.
Plastic resins being derived from petroleum, changes in the price of oil affect the cost of production, which makes it rather challenging for manufacturers to maintain a stable pricing system.
Similarly, policies for deforestation, transportation costs, and regional supply-demand dynamics are affecting the supply and prices of wood. Manufacturers will either absorb these added costs or pass them to the customers. Higher raw material costs may even restrain investment in sustainable alternatives. Thus, innovation may be slowed for eco-friendly and reusable beverage crates. Manufacturers are looking at long-term agreements with suppliers, optimizing materials, and alternative sources to address the issues.
| Key Investment Area | Why It’s Critical for Future Growth |
|---|---|
| Sustainable & Recyclable Materials | To reduce environmental impact and comply with stricter sustainability regulations. |
| Automation & Smart Manufacturing | To enhance production efficiency, reduce costs, and meet growing demand. |
| Lightweight & High-Durability Designs | To improve handling, storage, and transport while maintaining strength. |
| RFID & Smart Tracking Integration | To enable real-time inventory tracking and improve supply chain efficiency. |
| Customization & Branding Capabilities | To cater to beverage brands seeking unique designs for marketing and differentiation. |
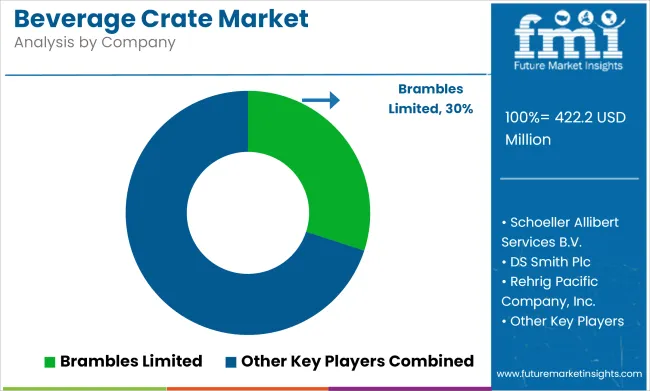
Tier 1 companies drive the market of beverage crates with higher production and diversified product portfolios. They have the strong ability to manufacture durable, reusable, and sustainable crates for various beverage sectors such as soft drinks, beer, and dairy. These companies, having a strong global presence and best supply chain networks, facilitate efficient distribution.
They are now investing in state-of-the-art technologies including RFID-enabled smart crates and high-impact recycled materials. They are sustainable, following both regulatory standards and industry best practice. Their innovative and quality excellence sets the pace for durability as well as sustainability. Prominent companies within tier 1 include Brambles Limited, Schoeller Albert Services B.V., DS Smith Plc, and Rehrig Pacific Company, Inc.
Tier 2 companies include mid-size players having presence in specific regions and highly influencing the local market. These are characterized by a strong presence overseas and strong market knowledge. These market players have good technology and ensure regulatory compliance but may not have advanced technology and wide global reach. Prominent companies in tier 2 include Supreme Industries Limited, IPL Plastics Inc., and Craemer UK Ltd.
Tier 3 includes the majority of small-scale companies operating at the local presence and serving niche markets. These companies are notably oriented towards fulfilling local market demands and are consequently classified within the tier 3 share segment. They are small-scale players and have limited geographical reach. Tier 3, within this context, is recognized as an unorganized market, denoting a sector characterized by a lack of extensive structure and formalization when compared to organized competitors.
| Region | 2019 to 2024 (Past Trends) |
|---|---|
| Asia Pacific (APAC) | Moderate growth driven by rising beverage consumption. Plastic crates dominated, with slow adoption of recycled materials. |
| Europe | Strong adoption of reusable and recycled plastic beverage crates. Strict EU regulations encouraged sustainable materials. |
| Global | Beverage companies tested sustainable crates, but cost and logistics barriers slowed widespread adoption. |
| Latin America | Brazil and Mexico showed early interest in durable plastic beverage crates. Cost and supply issues hindered expansion. |
| Middle East & Africa (MEA) | Slow adoption due to lower regulatory pressure and reliance on traditional crates. High import dependency. |
| North America | The USA and Canada saw steady growth in reusable and RFID-enabled beverage crates. Sustainability efforts were voluntary. |
| South Asia | Cost-sensitive markets relied on conventional plastic beverage crates. Limited awareness of sustainability. |
| Region | 2025 to 2035 (Future Projections) |
|---|---|
| Asia Pacific (APAC) | Rapid growth as governments enforce sustainability regulations. Increased investment in lightweight, reusable, and recycled-material beverage crates. |
| Europe | The EU pushes for 100% recyclable and reusable beverage crates by 2030. Advanced material innovation, including fiber-based alternatives, gains traction. |
| Global | Universal shift toward circular economy principles. Major beverage brands mandate sustainable, trackable, and durable crate solutions. |
| Latin America | Government incentives drive local production of recycled and reusable beverage crates. Large beverage brands push for sustainability. |
| Middle East & Africa (MEA) | Governments introduce sustainability mandates. Investments in local crate manufacturing using eco-friendly materials increase. |
| North America | Stronger enforcement of sustainability laws. Smart crates with RFID tracking and high-impact recycled materials become industry standard. |
| South Asia | India, Bangladesh, and Sri Lanka implement plastic waste reduction policies, accelerating the shift to sustainable beverage crates. Local manufacturers expand. |
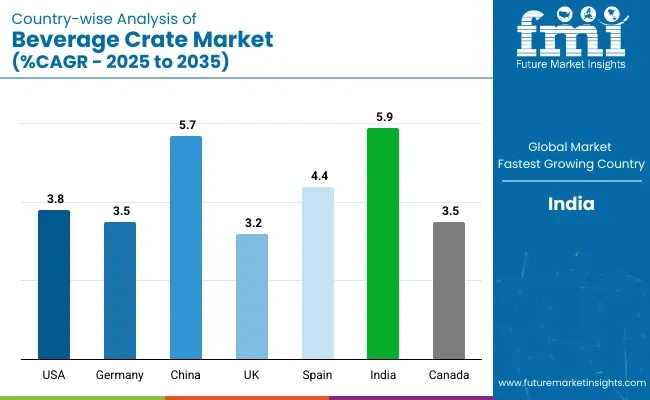
The section below covers the future forecast for the beverage crate market in terms of countries. Information on key countries in several parts of the globe, including North America, Latin America, East Asia, South Asia and Pacific, Western Europe, Eastern Europe and MEA is provided. USA is anticipated to remain at the forefront in North America, with a CAGR of 3.8% through 2035. In South Asia and Pacific India region marks CAGR of 5.9%.
| Countries | Value CAGR (2025 to 2035) |
|---|---|
| USA | 3.8% |
| Germany | 3.5% |
| China | 5.7% |
| UK | 3.2% |
| Spain | 4.4% |
| India | 5.9% |
| Canada | 3.5% |
Rapid expansion in the craft beer industry is a key growth driver of the USA beverage crate market, as more consumers seek craft beers, thereby increasing demand for more sturdy and returnable crate solutions. Independent breweries are growing throughout the country, so there is an increased need for effective distribution and storage that can accommodate small-batch production while offering protection of the product. Mass-market beers tend to consume fewer specialty glass bottles and uncommon packaging configurations that require specialized cases for secure movement.
Most of the craft breweries consider sustainability one of the biggest reasons, making it essential for using recyclable and reusable plastic crates rather than throwaway boxes. The increased distribution and local network expansion within breweries requires optimal logistics, hence requiring stackable and lightweight cases to make most space utilization.
The brewery taproom and direct-to-consumer sales also have been a major driving force behind the need for cases that allow easy handling by the retail and hospitality sectors. Collectively, these factors push beverage crate manufacturers to innovate with durable, modular, and brewery-specific designs.
German consumers are conditioned to return beverage bottles and crates to retailers, where they are sorted and then returned to beverage producers for refilling. The closed-loop system needs to include high quality, robust crates that can be used multiple times without any loss of structural integrity.
The German beer industry also needs strong, standardized crates with a focus on distribution due to the high number of regional breweries and strict purity laws (Reinheitsgebot). Most breweries depend on custom-designed crates that provide optimal protection as well as efficient stacking for logistics, especially traditional glass-bottled beers.
As part of an overall focus on sustainability, manufacturers have also started developing lightweight but highly robust recycled plastic crates. Efficiency is being achieved while fitting Germany's circular economy goals and even stricter environmental regulations.
| Manufacturer | Vendor Insights |
|---|---|
| Brambles Limited | Brambles has maintained a strong market position through its focus on reusable and pooled crate solutions. |
| Supreme Industries Limited | Supreme Industries has expanded its market share by introducing lightweight yet durable plastic crates. |
| Schoeller Allibert | Schoeller Allibert has grown by investing in smart and RFID-enabled beverage crates. |
| DS Smith Plc | DS Smith has strengthened its presence through sustainable and recyclable packaging solutions. |
| Rehrig Pacific Company, Inc. | Rehrig Pacific has maintained steady growth by developing ergonomic and high-impact resistance crates. |
| TranPak, Inc. | TranPak has gained traction by offering customizable and nestable beverage crates for optimized storage. |
| IPL Plastics Inc. | IPL Plastics has expanded its market reach by introducing advanced injection-molded crate designs. |
| Ravensbourn Plastics Ltd | Ravensbourn Plastics has maintained its share by focusing on high-quality, impact-resistant crates. |
| Craemer UK Ltd | Craemer has grown by integrating sustainable materials into its beverage crate production. |
| Zhejiang Zhengji Plastic Industry Co. Ltd. | The company has expanded its presence by offering cost-effective and recyclable plastic crates. |
Key Developments in beverages Crate Market
The market for beverage crate is likely to experience steady growth following the growth in demand for rugged, reusable, and sustainable packaging solutions. To remain competitive, industry players must invest in better materials such as high-density polyethylene (HDPE) and automation in providing stronger and more cost-efficient crates.
As a key driver, the sustainability element will lead to the adoption of fully recyclable and ecologically friendly crates, which align with regulatory and consumer requirements. Expanded uses in e-commerce and retail distribution will be driving factors for growth in the market. Manufacturers, beverage companies, and policymakers would have to cooperate with each other to set up industry standards and innovation.
The beverage crate industry is projected to witness CAGR of 4.8% between 2025 and 2035.
The global beverage crate industry stood at USD 407.9 million in 2024.
Global beverage crate industry is anticipated to reach USD 674.7 million by 2035 end.
South Asia & Pacific is set to record a CAGR of 5.3% in assessment period.
Some of the key players operating in the beverage crate industry are Brambles Limited, Supreme Industries Limited, Schoeller Allibert Services B.V., DS Smith Plc, Rehrig Pacific Company, Inc., TranPak, Inc., IPL Plastics Inc.


Full Research Suite comprises of:
Market outlook & trends analysis
Interviews & case studies
Strategic recommendations
Vendor profiles & capabilities analysis
5-year forecasts
8 regions and 60+ country-level data splits
Market segment data splits
12 months of continuous data updates
DELIVERED AS:
PDF EXCEL ONLINE
Competitive Overview of Beverage Crate Market Share
Beverage Packaging Market Size and Share Forecast Outlook 2025 to 2035
Beverage Carrier Market Size and Share Forecast Outlook 2025 to 2035
Beverage Cartoners Market Size and Share Forecast Outlook 2025 to 2035
Beverage Filter Paper Market Size and Share Forecast Outlook 2025 to 2035
Beverage Ingredients Market Analysis - Size and Share Forecast Outlook 2025 to 2035
Beverage Packaging Equipment Market Size and Share Forecast Outlook 2025 to 2035
Beverage Clouding Agent Market Size and Share Forecast Outlook 2025 to 2035
Beverage Packaging Machine Market Size and Share Forecast Outlook 2025 to 2035
Beverage Premix Market Size and Share Forecast Outlook 2025 to 2035
Beverage Acidulants Market Size and Share Forecast Outlook 2025 to 2035
Beverage Refrigeration Market Size and Share Forecast Outlook 2025 to 2035
Beverage Tester Market Size and Share Forecast Outlook 2025 to 2035
Beverage Dispenser Market Size and Share Forecast Outlook 2025 to 2035
Beverage Container Market Size and Share Forecast Outlook 2025 to 2035
Beverage Can Ends Market Size and Share Forecast Outlook 2025 to 2035
Beverage Cups Market Size and Share Forecast Outlook 2025 to 2035
Beverage Can Seamers Market Size and Share Forecast Outlook 2025 to 2035
Beverage Aluminum Cans Market Size and Share Forecast Outlook 2025 to 2035
Beverage Stabilizer Market Growth, Trends, Share, 2025 to 2035

Thank you!
You will receive an email from our Business Development Manager. Please be sure to check your SPAM/JUNK folder too.
Chat With
MaRIA