The Wooden Crate market is experiencing steady growth, driven by the increasing demand for reliable, sustainable, and cost-effective packaging solutions across multiple industries. Wooden crates are being widely adopted for the secure storage and transportation of goods, particularly in sectors such as logistics, manufacturing, agriculture, and e-commerce. The market is further supported by the durability, reusability, and eco-friendliness of wooden packaging compared with alternatives such as plastic or metal containers.
Advances in manufacturing processes, including precision cutting and optimized joinery, are enhancing product consistency and performance. Growing awareness regarding sustainability and adherence to environmental regulations are motivating businesses to shift toward renewable materials, reinforcing the appeal of wooden crates.
Additionally, increasing global trade and supply chain complexity are driving the need for standardized packaging that protects goods during transit As companies prioritize operational efficiency, product safety, and sustainability, the Wooden Crate market is positioned for sustained growth, with opportunities emerging from innovative designs, material optimization, and the expansion of industrial logistics networks.

| Metric | Value |
|---|---|
| Wooden Crate Market Estimated Value in (2025 E) | USD 1.1 billion |
| Wooden Crate Market Forecast Value in (2035 F) | USD 1.6 billion |
| Forecast CAGR (2025 to 2035) | 3.5% |

The market is segmented by Material, Product Type, and End Use and region. By Material, the market is divided into Hardwood and Softwood. In terms of Product Type, the market is classified into Open Style and Sheathed. Based on End Use, the market is segmented into Logistics And Transportation, Building And Construction, Food And Beverage, Agriculture, Chemicals, Pharmaceuticals And Medical Device, and Automotive. Regionally, the market is classified into North America, Latin America, Western Europe, Eastern Europe, Balkan & Baltic Countries, Russia & Belarus, Central Asia, East Asia, South Asia & Pacific, and the Middle East & Africa.

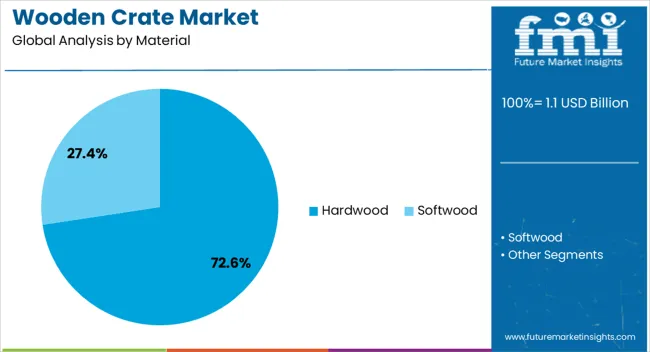
The hardwood material segment is projected to hold 72.6% of the Wooden Crate market revenue in 2025, establishing it as the leading material type. Growth in this segment is driven by hardwood’s superior strength, durability, and resistance to environmental stress, making it ideal for heavy and high-value cargo. Hardwood crates provide reliable protection against impact, moisture, and temperature fluctuations during storage and transportation, reducing product damage and associated costs.
The long service life and ability to withstand repeated use without compromising structural integrity further enhance its adoption. Manufacturers are increasingly leveraging sustainable hardwood sourcing and advanced processing techniques to ensure quality and compliance with environmental regulations.
The segment’s strong market position is also supported by preference among logistics companies and industrial end users who require secure and robust packaging solutions As demand for reliable, eco-friendly, and long-lasting packaging continues to rise, hardwood is expected to maintain its dominance, supported by consistent performance and operational cost benefits.

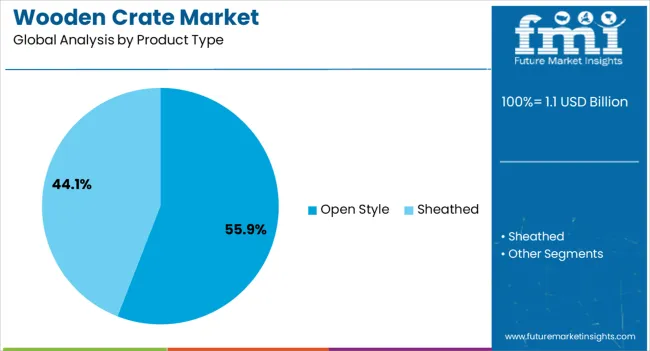
The open style product type segment is anticipated to account for 55.9% of the market revenue in 2025, making it the leading product type. Its growth is driven by its versatility and ease of use for a wide range of applications, particularly in logistics and storage operations. Open style crates facilitate convenient loading, unloading, and visual inspection of goods while maintaining structural integrity.
They are preferred in supply chains where frequent access to cargo is required without compromising safety. The design supports stacking and handling using forklifts and other industrial equipment, improving operational efficiency. As companies aim to optimize warehouse and transportation workflows, open style crates are increasingly chosen for their adaptability and practicality.
Additionally, cost-effectiveness achieved through reduced material usage and simplified manufacturing processes reinforces their appeal As industrial packaging demands grow across manufacturing, e-commerce, and distribution networks, the open style segment is expected to remain the primary driver of product type adoption, supported by continued preference for flexible and efficient packaging solutions.

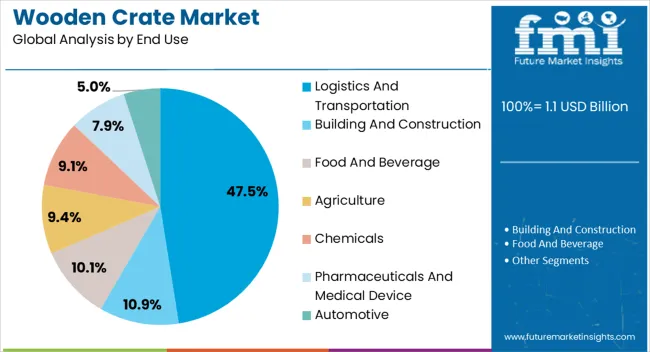
The logistics and transportation segment is projected to hold 47.5% of the market revenue in 2025, establishing it as the leading end-use industry. Growth in this segment is being driven by the rising need for secure and efficient packaging for global trade, supply chain operations, and industrial distribution. Wooden crates provide reliable protection during long-distance transport, safeguarding goods from damage, moisture, and vibration.
Their durability, reusability, and compliance with shipping regulations make them a preferred choice for logistics service providers and manufacturers handling high-value or sensitive cargo. Integration with pallet systems, forklifts, and intermodal transport solutions enhances operational efficiency.
The segment is further supported by expanding e-commerce networks, increased industrial production, and the demand for sustainable packaging solutions in global supply chains As businesses continue to prioritize operational efficiency, product safety, and cost-effective transportation, the logistics and transportation segment is expected to remain the primary driver of market growth, supported by ongoing innovations in crate design, material optimization, and sustainable sourcing practices.
The scope for wooden crate rose at a 2.7% CAGR between 2020 and 2025. The global market is achieving heights to grow at a moderate CAGR of 3.5% over the forecast period 2025 to 2035.
There was an increasing awareness of environmental issues during the historical period, leading businesses to seek sustainable packaging alternatives during the historical period.
Wooden crates, being biodegradable and recyclable, also experienced increased demand as a result.
Countries got more of products that are capable to withstand long transport journeys, with the progress of globalisation and increase in the volume of trade between countries, which contributed to the market growth.
Wooden crates, with their sturdy construction, were well suited for shipping a variety of goods, especially fragile items sold online.
The heightened horizon of online retailing and e-commerce raised the market growth. Many innovations in manufacturing technology will accelerate the design of wooden crates that are lighter, stronger, but also less cost effective.
Creation of proficient machining procedures applying smart technologies and improvement of the materials, for instance, will let manufacturers make the top notch crates with excellent performance functionality.
The versatility of wooden crates will increase their use for more than just transportation and storage, not only in shipping but also in other different industrial applications.
Crates made from wood, will be transformed into potentially profitable solution in which businesses are constantly searching for the creative uses for the wooden packaging.
The below table showcases revenues in terms of the top 5 leading countries, spearheaded by India and China. The countries will lead the market through 2035.
| Countries | Forecast CAGRs from 2025 to 2035 |
|---|---|
| The United States | 1.1% |
| Germany | 0.9% |
| China | 4.5% |
| Japan | 1.6% |
| India | 5.9% |

The wooden crate market in the United States will expand at a CAGR of 1.1% through 2035. Growing consumer awareness and regulatory initiatives focused on sustainability drive the demand for eco-friendly packaging solutions in the United States.
Wooden crates, being biodegradable, renewable, and recyclable, align with sustainability goals and preferences, boosting their adoption in various industries and contributing to market growth.
The continued growth of e-commerce in the country drives the demand for packaging solutions that ensure the safe and secure delivery of products to doorsteps of consumers. Wooden crates provide durable and protective packaging for a wide range of goods, supporting the expansion of online retail and driving market growth.

The wooden crate market in Germany to expand at a CAGR of 0.9% through 2035. Germany has a well-developed logistics and transportation infrastructure, including ports, railways, and highways.
Wooden crates play a crucial role in the efficient and reliable transportation of goods within Germany and across European markets. The demand for wooden crates is driven by the need for secure and standardized packaging solutions that meet the requirements of the logistics industry.
German consumers and businesses value quality, craftsmanship, and attention to detail. Wooden crates, often associated with traditional craftsmanship and artisanal quality, appeal to German consumers seeking authentic and high quality packaging solutions. The premium aesthetic appeal of wooden crates enhances the perceived value of packaged goods, driving market growth in Germany.
Wooden crate trends in China are taking a turn for the better. A 4.5% CAGR is forecast for the country from 2025 to 2035. Ongoing infrastructure development projects in China, including transportation networks, logistics hubs, and port facilities, create opportunities for packaging solutions to support the movement of goods.
Wooden crates play a vital role in efficient and secure transportation, benefiting from infrastructure development and driving market growth. China is a global manufacturing hub, producing a wide range of goods for domestic consumption and export.
The need of manufacturing sector for packaging materials to transport products within China and to international markets drives demand for wooden crates, supporting market growth in the country.

The wooden crate market in Japan is poised to expand at a CAGR of 1.6% through 2035. Japan has stringent regulations and standards for packaging materials, ensuring product safety, hygiene, and environmental sustainability.
Wooden crates manufactured to meet regulatory requirements, such as moisture resistance and pest control, ensure compliance and market acceptance, driving their adoption in various industries.
Japanese consumers prefer products made from natural materials, such as wood, bamboo, and paper, due to their aesthetic appeal, warmth, and authenticity. Wooden crates, with their natural beauty and tactile qualities, resonate with Japanese consumers and businesses seeking sustainable and visually pleasing packaging solutions.
The wooden crate market in India will expand at a CAGR of 5.9% through 2035. Government initiatives and policies aimed at promoting the manufacturing sector, supporting small scale industries, and encouraging sustainable practices contribute to the growth of the wooden crate market in India.
Incentives, subsidies, and regulatory support for eco-friendly packaging solutions encourage businesses to adopt wooden crates, driving market growth. The pharmaceutical and healthcare sectors in India require specialized packaging solutions to transport medicines, medical devices, and healthcare products.
Wooden crates provide secure and hygienic packaging, meeting the stringent requirements of pharmaceutical and healthcare industries and driving market demand.
The below table highlights how hardwood segment is leading the market in terms of material type, and will account for a share of 72.6% in 2025.
Based on end use, the logistics and transportation segment is gaining heights and will to account for a share of 47.5% in 2025.
| Category | Shares in 2025 |
|---|---|
| Hardwood | 72.6% |
| Logistics and Transportation | 47.5% |
Based on material type, the hardwood segment will dominate the wooden crate market. Hardwood crates have a longer lifespan compared to softwood or engineered wood alternatives.
Their inherent durability and resistance to wear and tear allow them to withstand repeated use and rough handling, reducing the need for frequent replacements and contributing to cost savings over time.
Hardwood materials, such as oak, maple, and cherry, are known for their exceptional durability, strength, and resilience. Wooden crates made from hardwoods offer superior protection and structural integrity, making them ideal for heavy duty applications and long term use.
In terms of end use, the logistics and transportation segment will dominate the wooden crate market. Wooden crates are known for their durability, strength, and structural integrity, making them ideal for handling and transporting heavy, bulky, or irregularly shaped goods.
Their robust construction ensures that products remain intact and secure throughout the logistics chain, minimizing losses and ensuring customer satisfaction. Wooden crates offer excellent protection and safety for goods during transportation and logistics operations.
They provide a sturdy and secure enclosure that shields products from impacts, vibrations, and external elements, reducing the risk of damage, breakage, or spoilage during transit.

A deep dive in the competitive landscape of the wooden crate market states that the industry is burgeoning and giants are working day in and out to achieve goals and to stand out unique in the queue.
Company Portfolio
| Attribute | Details |
|---|---|
| Estimated Market Size in 2025 | USD 1.1 billion |
| Projected Market Valuation in 2035 | USD 1.5 billion |
| Value-based CAGR 2025 to 2035 | 3.5% |
| Forecast Period | 2025 to 2035 |
| Historical Data Available for | 2020 to 2025 |
| Market Analysis | Value in USD Billion |
| Key Regions Covered | North America; Latin America; Western Europe; Eastern Europe; South Asia and Pacific; East Asia; The Middle East & Africa |
| Key Market Segments Covered | Material, Product Type, End Use, Region |
| Key Countries Profiled | The United States, Canada, Brazil, Mexico, Germany, France, France, Spain, Italy, Russia, Poland, Czech Republic, Romania, India, Bangladesh, Australia, New Zealand, China, Japan, South Korea, GCC countries, South Africa, Israel |
| Key Companies Profiled | FoamCraft Packaging Inc.; C Jackson & Sons Ltd.; Poole & Sons, Inc.; Herwood Inc.; C&K Box Company, Inc.; Tree Brand Packaging, Inc.; Ongna Wood Products, Inc.; LJB Timber Packaging Pty. Ltd. |
The global wooden crate market is estimated to be valued at USD 1.1 billion in 2025.
The market size for the wooden crate market is projected to reach USD 1.6 billion by 2035.
The wooden crate market is expected to grow at a 3.5% CAGR between 2025 and 2035.
The key product types in wooden crate market are hardwood and softwood.
In terms of product type, open style segment to command 55.9% share in the wooden crate market in 2025.


Full Research Suite comprises of:
Market outlook & trends analysis
Interviews & case studies
Strategic recommendations
Vendor profiles & capabilities analysis
5-year forecasts
8 regions and 60+ country-level data splits
Market segment data splits
12 months of continuous data updates
DELIVERED AS:
PDF EXCEL ONLINE
Market Share Insights of Wooden Crate Providers
Wooden Pallet Rental Service Market Size and Share Forecast Outlook 2025 to 2035
Wooden Cutlery Market Size and Share Forecast Outlook 2025 to 2035
Wooden & Plywood Packaging Market Size and Share Forecast Outlook 2025 to 2035
Wooden Furniture Market Size and Share Forecast Outlook 2025 to 2035
Wooden Interior Door Market Size and Share Forecast Outlook 2025 to 2035
Wooden Decking Market Size, Growth, and Forecast 2025 to 2035
Wooden Barrels Market Growth - Demand & Forecast 2025 to 2035
Wooden Box Market Demand & Premium Packaging Trends 2024-2034
Wooden Pallets Market
Wooden Pallet Collars Market
Crate Handling Systems Market Size and Share Forecast Outlook 2025 to 2035
Crate Washer Market Analysis - Size and Share Forecast Outlook 2025 to 2035
Crates Market Report - Industry Trends & Demand Forecast 2025 to 2035
Crates And Pallets Packaging Market
HDPE Crate Market Forecast and Outlook 2025 to 2035
Metal Crates Market
Plastic Crates Market Size and Share Forecast Outlook 2025 to 2035
Reusable Crate Welding Lines Market Size and Share Forecast Outlook 2025 to 2035
Beverage Crate Market Analysis – Size, Share, & Forecast Outlook 2025 to 2035

Thank you!
You will receive an email from our Business Development Manager. Please be sure to check your SPAM/JUNK folder too.
Chat With
MaRIA