Wooden & Plywood Packaging Market Snapshot (2023 to 2033)

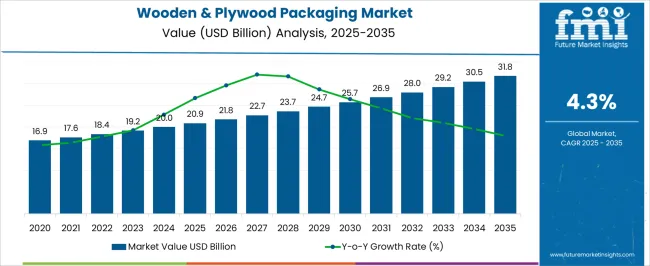
The global wooden & plywood packaging market size is expected to be valued at US$ 19.1 billion in 2023. Artistic and craftsmanship appeal, bolsters the overall scope for wooden & plywood packaging market, which is projected to grow at a CAGR of 4.5% between 2023 and 2033, totaling around US$ 29.6 billion by 2033.

Attribute Details
Wooden & Plywood Packaging Market Value 2023 US$ 19.1 billion
Wooden & Plywood Packaging Market Projected Value (2033) US$ 29.6 billion
Wooden & Plywood Packaging Market CAGR (2023 to 2033) 4.5%

The rise of e-commerce has transformed the way consumers shop, leading to a significant shift in the retail landscape. Businesses are placing increased emphasis on creating unique and memorable experiences for customers, as traditional brick-and-mortar stores give way to online shopping platforms. One of the key aspects of this evolving customer journey is the unboxing experience, which has gained considerable importance in recent years.

The unboxing experience begins the moment a customer's order is confirmed. When a package arrives, it creates a sense of anticipation and excitement. Wooden and plywood packaging, with its natural and tactile appearance, further elevates these emotions. The texture, aroma, and appearance of wood contribute to a sensory experience that builds anticipation, making customers eager to see what's inside.

Wooden and plywood packaging exudes a sense of elegance, sophistication, and authenticity. The visual appeal of these materials enhances the overall aesthetics of the package. The rich, natural tones and textures of wood create an immediate sense of luxury, setting a positive tone for the unboxing experience.

There is a gradual reveal of the enclosed product, as the recipient opens the wooden or plywood packaging. The unveiling process adds a layer of suspense and drama, creating a memorable and cinematic moment. Brands can capitalize on this opportunity to create a sense of wonder and surprise.

Don't pay for what you don't need

Customize your report by selecting specific countries or regions and save 30%!

Global Wooden & Plywood Packaging Market Historical Analysis (2018 To 2022) Vs. Forecast Outlook (2023 To 2033)

The global demand for wooden & plywood packaging increased at a CAGR of 2.2% during the forecast period between 2018 and 2022, reaching a total of US$ 29.6 billion in 2033.

According to Future Market Insights, a market research and competitive intelligence provider, the wooden & plywood packaging market was valued at US$ 18.2 billion in 2022.

The escalating global concern over plastic pollution and its adverse impact on the environment has prompted a widespread movement towards more sustainable and eco-friendly packaging solutions. Wooden and plywood packaging has emerged as a compelling alternative to traditional plastic packaging, offering a range of environmental benefits that resonate with both consumers and businesses.

Plastic packaging has long been associated with environmental challenges, including littering, ocean pollution, and the persistence of plastic waste in natural ecosystems. Wooden and plywood packaging provides a viable alternative that significantly reduces the dependence on plastic materials, helping to mitigate plastic pollution.

Unlike plastic, which can take hundreds of years to break down, wood is a natural material that decomposes relatively quickly. Wooden and plywood packaging are biodegradable, meaning they can be naturally broken down by microorganisms over time, without leaving behind harmful microplastics.

Wood is a renewable resource, as trees can be replanted and harvested sustainably, which contrasts with plastic, which is derived from non-renewable fossil fuels. The use of renewable materials contributes to the conservation of natural resources and reduces the carbon footprint of packaging.

Factors Driving the Market for Wooden & Plywood Packaging

Sustainable Packaging Solutions is Likely to be Beneficial for Market Growth

The emphasis on sustainability and eco-friendliness has become a cornerstone of modern business practices, and the packaging industry is no exception. Brands and manufacturers are seeking packaging solutions that align with these values, as consumers become more environmentally conscious and demand greener products. The shift in consumer behavior and preferences has led to a significant increase in the demand for sustainable packaging solutions, including wooden and plywood packaging.

Wood is a natural and renewable resource. Unlike non-renewable materials like plastic, which are derived from fossil fuels and are finite in supply, wood can be sustainably sourced from responsibly managed forests, which ensures a continuous supply of raw material for wooden and plywood packaging.

One of the critical environmental advantages of wooden and plywood packaging is their biodegradability. The materials break down naturally over time through the action of microorganisms, returning to the earth without leaving behind harmful pollutants or microplastics, which contrasts with plastic, which can persist in the environment for centuries.

The production of wooden and plywood packaging generally has a lower carbon footprint compared to plastic. The energy-intensive processes involved in plastic production, such as polymerization and refining, contribute to higher greenhouse gas emissions. In contrast, wood processing and manufacturing typically require less energy and generate fewer emissions.

Reduced Carbon Footprint to Fuel the Market Growth

The carbon footprint of a product or material refers to the total greenhouse gas emissions generated throughout its lifecycle, from raw material extraction and production to transportation, use, and disposal. Wooden and plywood packaging materials are often touted for their reduced carbon footprint compared to alternatives like plastic or metal.

Wood is a natural and renewable resource. Trees absorb carbon dioxide (CO2) from the atmosphere during their growth, acting as a carbon sink. When wood is harvested and used for packaging, the carbon stored in the wood remains locked away from the atmosphere, reducing net CO2 emissions.

The production of wooden and plywood packaging typically requires less energy compared to the energy-intensive processes involved in plastic or metal production. The reduced energy demand contributes to lower greenhouse gas emissions.

The manufacturing processes for wood and plywood packaging involve fewer emissions of greenhouse gases. For instance, the extraction of raw materials and the processing of wood generally produce fewer emissions than the production of plastics, which involves petrochemical refining.

Ismail Sutaria
Ismail Sutaria

Principal Consultant

Talk to Analyst

Find your sweet spots for generating winning opportunities in this market.

Category-wise Insights

Plywood to Take the Lion’s Share

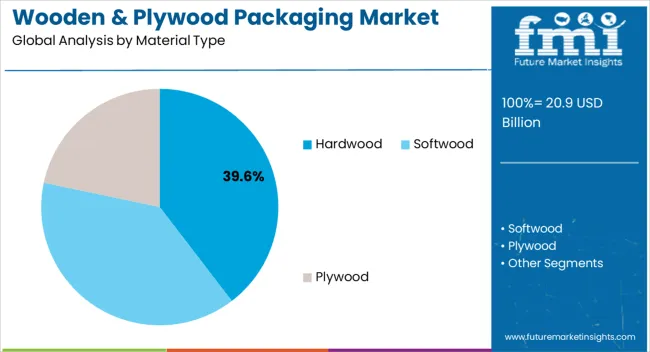
By material type, plywood segment is estimated to be the leading segment at a CAGR of 4.4% during the forecast period.

Plywood is composed of multiple layers of wood veneers bonded together with adhesive. The layered structure enhances its strength and durability, making it suitable for packaging heavy and fragile items. Plywood packaging provides reliable protection during transportation and handling.

Plywood can be easily cut, shaped, and customized to suit various packaging needs. It can be designed to accommodate products of different shapes and sizes, offering flexibility to packaging designers and manufacturers.

Plywood is often more affordable than solid wood, making it an economical choice for packaging solutions. Its cost-effectiveness is especially important for businesses looking to balance quality packaging with budget constraints.

Plywood is derived from renewable resources, and its manufacturing process generally requires less energy compared to other materials like plastics or metals. The eco-friendly aspect appeals to environmentally conscious consumers and businesses seeking sustainable packaging solutions.

Bakery & Confectionery to be the Most Lucrative End Use Segment

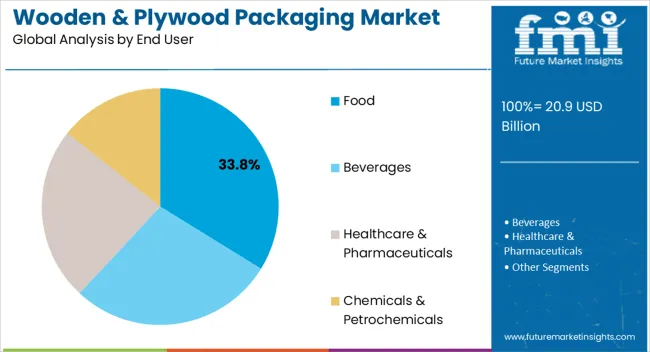
By end user, bakery & confectionery sub-segment of food segment is estimated to be the leading segment at a CAGR of 4.4% during the forecast period.

Bakery and confectionery products are often delicate and prone to breakage. Wooden and plywood packaging provides sturdy protection during transportation and handling, reducing the risk of damage and preserving the quality of the products.

Plywood packaging can be easily customized to fit various bakery and confectionery items, such as cakes, pastries, cookies, and chocolates. Businesses can create unique packaging designs that align with their brand identity and attract consumer attention.

Wooden and plywood packaging adds a touch of rustic elegance to bakery and confectionery products. The natural look and feel of wood enhance the visual appeal of the packaged items, contributing to an enhanced product presentation.

The use of sustainable packaging materials like wood is gaining traction, as consumers become more environmentally conscious. Wooden and plywood packaging align with the demand for eco-friendly packaging solutions, appealing to environmentally conscious consumers.

Region-wise Insights

Regulatory Emphasis on Sustainability to Uplift the Sales of Wooden & Plywood Packaging in North America

North America has been witnessing a significant shift towards sustainable and eco-friendly packaging solutions. Wooden and plywood packaging materials align well with this trend, as they are renewable, biodegradable, and have a lower environmental impact compared to conventional packaging materials like plastics.

Government regulations and initiatives aimed at reducing plastic waste and promoting environmentally friendly practices are driving businesses to explore alternative packaging options. Wooden and plywood packaging offer a compliant solution that meets sustainability requirements.

North American consumers appreciate products that convey a natural and authentic feel. Wooden and plywood packaging align with this preference, adding a rustic and organic touch to product presentation, which can resonate well with local consumers.

The rise of e-commerce and online retail in North America has created a need for effective and protective packaging solutions. Wooden and plywood packaging materials provide robust protection during shipping, ensuring products reach customers in optimal condition. The region is expected to hold a CAGR of 4.4% over the analysis period.

Rapid Urbanization & Population to Increase Wooden & Plywood Packaging Sales in Asia Pacific

The Asia Pacific region is witnessing a surge in e-commerce and online retail, leading to a higher demand for packaging materials that can withstand the rigors of shipping and handling. Wooden and plywood packaging provides robust protection for products during transit, contributing to the growth of the e-commerce sector.

Rapid urbanization and population growth are driving demand for various consumer goods and packaged products. Wooden and plywood packaging materials offer a versatile and customizable option to cater to the diverse packaging needs of a growing population.

Governments and businesses in the Asia Pacific region are increasingly focusing on sustainability and environmentally friendly practices. Wooden and plywood packaging materials align with these initiatives as they are renewable, biodegradable, and have a lower environmental impact compared to traditional packaging materials.

Wooden and plywood packaging materials have cultural significance and are often associated with tradition, authenticity, and craftsmanship in many Asian countries. The aesthetic appeal can enhance the perceived value of products and resonate with consumers. The region is expected to hold a CAGR of 4.3% over the analysis period.
Get the data you need at a Fraction of the cost

Personalize your report by choosing insights you need
and save 40%!

Competitive Landscape

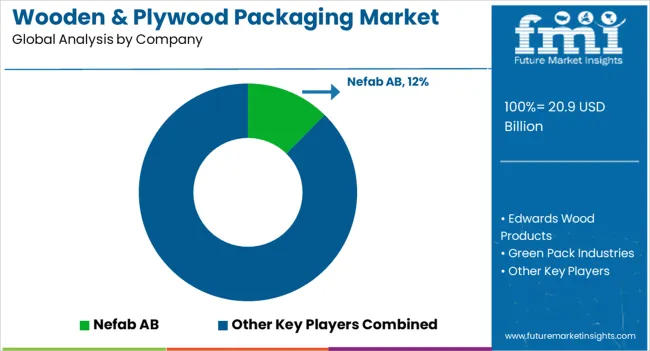
Key players in the wooden & plywood packaging market are strongly focusing on profit generation from their existing product portfolios along while exploring potential new applications. The players are emphasizing on increasing their wooden & plywood packaging production capacities, to cater to the demand from numerous end use industries. Prominent players are also pushing for geographical expansion to decrease the dependency on imported wooden & plywood packaging.

Recent Developments:

  • In 2023, Nefab AB acquired Green Pack Industries, a leading manufacturer of wooden and plywood packaging solutions.
  • In 2023, Edwards Wood Products, Inc. launched its new line of sustainable wooden pallets.
  • In 2022, Stora Enso launched its new wood-based composite, DuraSense, for cosmetics, food, and luxury brands.
  • In 2022, C&K Box Company, Inc. acquired Shur-way Industries, Inc., a leading manufacturer of wooden and plywood boxes.

Scope of the Report

Attribute Details
Forecast Period 2023 to 2033
Historical Data Available for 2018 to 2022
Market Analysis USD Billion for value and Tons for Volume
Key Regions Covered North America, Latin America, Western Europe, Eastern Europe, South Asia & Pacific, East Asia, and Middle East & Africa
Key Countries Covered United States, Canada, Brazil, Mexico, Germany, United Kingdom, France, Spain, Italy, Poland, Russia, Czech Republic, Romania, India, Bangladesh, Australia, New Zealand, China, Japan, South Korea, GCC Countries, South Africa, Israel.
Key Segments Covered Material Type, Product Type, End User, and Region
Key Companies Profiled Nefab AB, Edwards Wood Products, Inc., Green Pack Industries, Napa Wooden Box Co., Ongna Wood Products, Inc., Shur-way Industries, Inc., Rowlinson Packaging Ltd, C&K Box Company, Inc., C Jackson & Sons Ltd., Bay wood products, Inc., Arrington Lumber and Pallet Company, LJB Timber Packaging Pty. Ltd.
Report Coverage Market Forecast, brand share analysis, competition intelligence, DROT analysis, Market Dynamics and Challenges, Strategic Growth Initiatives
Customization & Pricing Available upon Request

Key Segments Profiled In The Global Wooden & Plywood Packaging Market

By Material Type:

  • Hardwood
    • Oak
    • Teak
    • Maple
  • Softwood
    • Pines
    • Spruces
  • Plywood

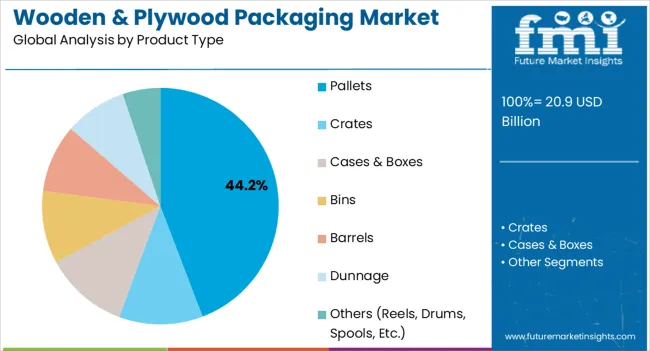
By Product Type:

  • Crates
  • Pallets
    • Stringer Pallets
    • Block Pallets
  • Cases & Boxes
  • Bins
  • Barrels
  • Dunnage
  • Others (reels, drums, spools, etc.)

By End User:

  • Food
    • Fruits & Vegetables
    • Bakery & Confectionery
    • Meat, Poultry, & Seafood
    • Ready to Eat
    • Others (Spices & Condiments, etc.)
  • Beverages
    • Alcoholic Drinks
    • Ready to Drink
    • Bottled Water
    • Sports Drinks
    • Carbonated Drinks
  • Healthcare & Pharmaceuticals
  • Chemicals & Petrochemicals
  • Home Care and Personal Care
  • Others (Electrical & Electronics, etc.)

Region:

  • North America
  • Latin America
  • Western Europe
  • Eastern Europe
  • South Asia and Pacific
  • East Asia
  • Middle East and Africa (MEA)

Frequently Asked Questions

How Much the Wooden & Plywood Packaging Market Pegged to Attain?

The wooden & plywood packaging market is pegged to attain US$ 19.1 billion in 2023.

What is the Growth Potential of the Market?

The growth potential of the market is 4.5% through 2033.

What Factor is Driving the Wooden & Plywood Packaging Market?

Eco-friendly and sustainable packaging solutions is driving the product sales.

Based on Material, Which Segment is Expected to Have a Giant Share?

Plywood is expected to enjoy a large share in the market.

Which Sub-segment of Food Segment is Offering High Lucrativeness?

Bakery and confectionery offer high lucrativeness to market players.

Table of Content
1. Executive Summary
    1.1. Global Market Outlook
    1.2. Demand-side Trends
    1.3. Supply-side Trends
    1.4. Technology Roadmap Analysis
    1.5. Analysis and Recommendations
2. Market Overview
    2.1. Market Coverage / Taxonomy
    2.2. Market Definition / Scope / Limitations
3. Market Background
    3.1. Market Dynamics
        3.1.1. Drivers
        3.1.2. Restraints
        3.1.3. Opportunity
        3.1.4. Trends
    3.2. Scenario Forecast
        3.2.1. Demand in Optimistic Scenario
        3.2.2. Demand in Likely Scenario
        3.2.3. Demand in Conservative Scenario
    3.3. Opportunity Map Analysis
    3.4. Product Life Cycle Analysis
    3.5. Supply Chain Analysis
        3.5.1. Supply Side Participants and their Roles
            3.5.1.1. Producers
            3.5.1.2. Mid-Level Participants (Traders/ Agents/ Brokers)
            3.5.1.3. Wholesalers and Distributors
        3.5.2. Value Added and Value Created at Node in the Supply Chain
        3.5.3. List of Raw Material Suppliers
        3.5.4. List of Existing and Potential Buyer’s
    3.6. Investment Feasibility Matrix
    3.7. Value Chain Analysis
        3.7.1. Profit Margin Analysis
        3.7.2. Wholesalers and Distributors
        3.7.3. Retailers
    3.8. PESTLE and Porter’s Analysis
    3.9. Regulatory Landscape
        3.9.1. By Key Regions
        3.9.2. By Key Countries
    3.10. Regional Parent Market Outlook
    3.11. Production and Consumption Statistics
    3.12. Import and Export Statistics
4. Global Market Analysis 2018 to 2022 and Forecast, 2023 to 2033
    4.1. Historical Market Size Value (US$ Million) & Volume (Units) Analysis, 2018 to 2022
    4.2. Current and Future Market Size Value (US$ Million) & Volume (Units) Projections, 2023 to 2033
        4.2.1. Y-o-Y Growth Trend Analysis
        4.2.2. Absolute $ Opportunity Analysis
5. Global Market Analysis 2018 to 2022 and Forecast 2023 to 2033, By Material Type
    5.1. Introduction / Key Findings
    5.2. Historical Market Size Value (US$ Million) & Volume (Units) Analysis By Material Type, 2018 to 2022
    5.3. Current and Future Market Size Value (US$ Million) & Volume (Units) Analysis and Forecast By Material Type, 2023 to 2033
        5.3.1. Hardwood
            5.3.1.1. Oak
            5.3.1.2. Teak
            5.3.1.3. Maple
        5.3.2. Softwood
            5.3.2.1. Pines
            5.3.2.2. Spruces
        5.3.3. Plywood
    5.4. Y-o-Y Growth Trend Analysis By Material Type, 2018 to 2022
    5.5. Absolute $ Opportunity Analysis By Material Type, 2023 to 2033
6. Global Market Analysis 2018 to 2022 and Forecast 2023 to 2033, By Product Type
    6.1. Introduction / Key Findings
    6.2. Historical Market Size Value (US$ Million) & Volume (Units) Analysis By Product Type, 2018 to 2022
    6.3. Current and Future Market Size Value (US$ Million) & Volume (Units) Analysis and Forecast By Product Type, 2023 to 2033
        6.3.1. Crates
        6.3.2. Pallets
            6.3.2.1. Stringer Pallets
            6.3.2.2. Block Pallets
        6.3.3. Cases & Boxes
        6.3.4. Bins
        6.3.5. Barrels
        6.3.6. Dunnage
        6.3.7. Others
    6.4. Y-o-Y Growth Trend Analysis By Product Type, 2018 to 2022
    6.5. Absolute $ Opportunity Analysis By Product Type, 2023 to 2033
7. Global Market Analysis 2018 to 2022 and Forecast 2023 to 2033, By End User
    7.1. Introduction / Key Findings
    7.2. Historical Market Size Value (US$ Million) & Volume (Units) Analysis By End User, 2018 to 2022
    7.3. Current and Future Market Size Value (US$ Million) & Volume (Units) Analysis and Forecast By End User, 2023 to 2033
        7.3.1. Food
            7.3.1.1. Fruits & Vegetables
            7.3.1.2. Bakery & Confectionery
            7.3.1.3. Meat, Poultry, & Seafood
            7.3.1.4. Ready to Eat
            7.3.1.5. Others
        7.3.2. Beverages
            7.3.2.1. Alcoholic Drinks
            7.3.2.2. Ready to Drink
            7.3.2.3. Bottled Water
            7.3.2.4. Sports Drinks
            7.3.2.5. Carbonated Drinks
        7.3.3. Healthcare & Pharmaceuticals
        7.3.4. Chemicals & Petrochemicals
        7.3.5. Home Care and Personal Care
        7.3.6. Others
    7.4. Y-o-Y Growth Trend Analysis By End User, 2018 to 2022
    7.5. Absolute $ Opportunity Analysis By End User, 2023 to 2033
8. Global Market Analysis 2018 to 2022 and Forecast 2023 to 2033, By Region
    8.1. Introduction
    8.2. Historical Market Size Value (US$ Million) & Volume (Units) Analysis By Region, 2018 to 2022
    8.3. Current Market Size Value (US$ Million) & Volume (Units) Analysis and Forecast By Region, 2023 to 2033
        8.3.1. North America
        8.3.2. Latin America
        8.3.3. Western Europe
        8.3.4. Eastern Europe
        8.3.5. South Asia and Pacific
        8.3.6. East Asia
        8.3.7. Middle East and Africa
    8.4. Market Attractiveness Analysis By Region
9. North America Market Analysis 2018 to 2022 and Forecast 2023 to 2033, By Country
    9.1. Historical Market Size Value (US$ Million) & Volume (Units) Trend Analysis By Market Taxonomy, 2018 to 2022
    9.2. Market Size Value (US$ Million) & Volume (Units) Forecast By Market Taxonomy, 2023 to 2033
        9.2.1. By Country
            9.2.1.1. The USA
            9.2.1.2. Canada
        9.2.2. By Material Type
        9.2.3. By Product Type
        9.2.4. By End User
    9.3. Market Attractiveness Analysis
        9.3.1. By Country
        9.3.2. By Material Type
        9.3.3. By Product Type
        9.3.4. By End User
    9.4. Key Takeaways
10. Latin America Market Analysis 2018 to 2022 and Forecast 2023 to 2033, By Country
    10.1. Historical Market Size Value (US$ Million) & Volume (Units) Trend Analysis By Market Taxonomy, 2018 to 2022
    10.2. Market Size Value (US$ Million) & Volume (Units) Forecast By Market Taxonomy, 2023 to 2033
        10.2.1. By Country
            10.2.1.1. Brazil
            10.2.1.2. Mexico
            10.2.1.3. Rest of Latin America
        10.2.2. By Material Type
        10.2.3. By Product Type
        10.2.4. By End User
    10.3. Market Attractiveness Analysis
        10.3.1. By Country
        10.3.2. By Material Type
        10.3.3. By Product Type
        10.3.4. By End User
    10.4. Key Takeaways
11. Western Europe Market Analysis 2018 to 2022 and Forecast 2023 to 2033, By Country
    11.1. Historical Market Size Value (US$ Million) & Volume (Units) Trend Analysis By Market Taxonomy, 2018 to 2022
    11.2. Market Size Value (US$ Million) & Volume (Units) Forecast By Market Taxonomy, 2023 to 2033
        11.2.1. By Country
            11.2.1.1. Germany
            11.2.1.2. United Kingdom
            11.2.1.3. France
            11.2.1.4. Spain
            11.2.1.5. Italy
            11.2.1.6. Rest of Western Europe
        11.2.2. By Material Type
        11.2.3. By Product Type
        11.2.4. By End User
    11.3. Market Attractiveness Analysis
        11.3.1. By Country
        11.3.2. By Material Type
        11.3.3. By Product Type
        11.3.4. By End User
    11.4. Key Takeaways
12. Eastern Europe Market Analysis 2018 to 2022 and Forecast 2023 to 2033, By Country
    12.1. Historical Market Size Value (US$ Million) & Volume (Units) Trend Analysis By Market Taxonomy, 2018 to 2022
    12.2. Market Size Value (US$ Million) & Volume (Units) Forecast By Market Taxonomy, 2023 to 2033
        12.2.1. By Country
            12.2.1.1. Poland
            12.2.1.2. Russia
            12.2.1.3. Czech Republic
            12.2.1.4. Romania
            12.2.1.5. Rest of Eastern Europe
        12.2.2. By Material Type
        12.2.3. By Product Type
        12.2.4. By End User
    12.3. Market Attractiveness Analysis
        12.3.1. By Country
        12.3.2. By Material Type
        12.3.3. By Product Type
        12.3.4. By End User
    12.4. Key Takeaways
13. South Asia and Pacific Market Analysis 2018 to 2022 and Forecast 2023 to 2033, By Country
    13.1. Historical Market Size Value (US$ Million) & Volume (Units) Trend Analysis By Market Taxonomy, 2018 to 2022
    13.2. Market Size Value (US$ Million) & Volume (Units) Forecast By Market Taxonomy, 2023 to 2033
        13.2.1. By Country
            13.2.1.1. India
            13.2.1.2. Bangladesh
            13.2.1.3. Australia
            13.2.1.4. New Zealand
            13.2.1.5. Rest of South Asia and Pacific
        13.2.2. By Material Type
        13.2.3. By Product Type
        13.2.4. By End User
    13.3. Market Attractiveness Analysis
        13.3.1. By Country
        13.3.2. By Material Type
        13.3.3. By Product Type
        13.3.4. By End User
    13.4. Key Takeaways
14. East Asia Market Analysis 2018 to 2022 and Forecast 2023 to 2033, By Country
    14.1. Historical Market Size Value (US$ Million) & Volume (Units) Trend Analysis By Market Taxonomy, 2018 to 2022
    14.2. Market Size Value (US$ Million) & Volume (Units) Forecast By Market Taxonomy, 2023 to 2033
        14.2.1. By Country
            14.2.1.1. China
            14.2.1.2. Japan
            14.2.1.3. South Korea
        14.2.2. By Material Type
        14.2.3. By Product Type
        14.2.4. By End User
    14.3. Market Attractiveness Analysis
        14.3.1. By Country
        14.3.2. By Material Type
        14.3.3. By Product Type
        14.3.4. By End User
    14.4. Key Takeaways
15. Middle East and Africa Market Analysis 2018 to 2022 and Forecast 2023 to 2033, By Country
    15.1. Historical Market Size Value (US$ Million) & Volume (Units) Trend Analysis By Market Taxonomy, 2018 to 2022
    15.2. Market Size Value (US$ Million) & Volume (Units) Forecast By Market Taxonomy, 2023 to 2033
        15.2.1. By Country
            15.2.1.1. GCC Countries
            15.2.1.2. South Africa
            15.2.1.3. Israel
            15.2.1.4. Rest of MEA
        15.2.2. By Material Type
        15.2.3. By Product Type
        15.2.4. By End User
    15.3. Market Attractiveness Analysis
        15.3.1. By Country
        15.3.2. By Material Type
        15.3.3. By Product Type
        15.3.4. By End User
    15.4. Key Takeaways
16. Key Countries Market Analysis
    16.1. USA
        16.1.1. Pricing Analysis
        16.1.2. Market Share Analysis, 2022
            16.1.2.1. By Material Type
            16.1.2.2. By Product Type
            16.1.2.3. By End User
    16.2. Canada
        16.2.1. Pricing Analysis
        16.2.2. Market Share Analysis, 2022
            16.2.2.1. By Material Type
            16.2.2.2. By Product Type
            16.2.2.3. By End User
    16.3. Brazil
        16.3.1. Pricing Analysis
        16.3.2. Market Share Analysis, 2022
            16.3.2.1. By Material Type
            16.3.2.2. By Product Type
            16.3.2.3. By End User
    16.4. Mexico
        16.4.1. Pricing Analysis
        16.4.2. Market Share Analysis, 2022
            16.4.2.1. By Material Type
            16.4.2.2. By Product Type
            16.4.2.3. By End User
    16.5. Germany
        16.5.1. Pricing Analysis
        16.5.2. Market Share Analysis, 2022
            16.5.2.1. By Material Type
            16.5.2.2. By Product Type
            16.5.2.3. By End User
    16.6. United Kingdom
        16.6.1. Pricing Analysis
        16.6.2. Market Share Analysis, 2022
            16.6.2.1. By Material Type
            16.6.2.2. By Product Type
            16.6.2.3. By End User
    16.7. France
        16.7.1. Pricing Analysis
        16.7.2. Market Share Analysis, 2022
            16.7.2.1. By Material Type
            16.7.2.2. By Product Type
            16.7.2.3. By End User
    16.8. Spain
        16.8.1. Pricing Analysis
        16.8.2. Market Share Analysis, 2022
            16.8.2.1. By Material Type
            16.8.2.2. By Product Type
            16.8.2.3. By End User
    16.9. Italy
        16.9.1. Pricing Analysis
        16.9.2. Market Share Analysis, 2022
            16.9.2.1. By Material Type
            16.9.2.2. By Product Type
            16.9.2.3. By End User
    16.10. Poland
        16.10.1. Pricing Analysis
        16.10.2. Market Share Analysis, 2022
            16.10.2.1. By Material Type
            16.10.2.2. By Product Type
            16.10.2.3. By End User
    16.11. Russia
        16.11.1. Pricing Analysis
        16.11.2. Market Share Analysis, 2022
            16.11.2.1. By Material Type
            16.11.2.2. By Product Type
            16.11.2.3. By End User
    16.12. Czech Republic
        16.12.1. Pricing Analysis
        16.12.2. Market Share Analysis, 2022
            16.12.2.1. By Material Type
            16.12.2.2. By Product Type
            16.12.2.3. By End User
    16.13. Romania
        16.13.1. Pricing Analysis
        16.13.2. Market Share Analysis, 2022
            16.13.2.1. By Material Type
            16.13.2.2. By Product Type
            16.13.2.3. By End User
    16.14. India
        16.14.1. Pricing Analysis
        16.14.2. Market Share Analysis, 2022
            16.14.2.1. By Material Type
            16.14.2.2. By Product Type
            16.14.2.3. By End User
    16.15. Bangladesh
        16.15.1. Pricing Analysis
        16.15.2. Market Share Analysis, 2022
            16.15.2.1. By Material Type
            16.15.2.2. By Product Type
            16.15.2.3. By End User
    16.16. Australia
        16.16.1. Pricing Analysis
        16.16.2. Market Share Analysis, 2022
            16.16.2.1. By Material Type
            16.16.2.2. By Product Type
            16.16.2.3. By End User
    16.17. New Zealand
        16.17.1. Pricing Analysis
        16.17.2. Market Share Analysis, 2022
            16.17.2.1. By Material Type
            16.17.2.2. By Product Type
            16.17.2.3. By End User
    16.18. China
        16.18.1. Pricing Analysis
        16.18.2. Market Share Analysis, 2022
            16.18.2.1. By Material Type
            16.18.2.2. By Product Type
            16.18.2.3. By End User
    16.19. Japan
        16.19.1. Pricing Analysis
        16.19.2. Market Share Analysis, 2022
            16.19.2.1. By Material Type
            16.19.2.2. By Product Type
            16.19.2.3. By End User
    16.20. South Korea
        16.20.1. Pricing Analysis
        16.20.2. Market Share Analysis, 2022
            16.20.2.1. By Material Type
            16.20.2.2. By Product Type
            16.20.2.3. By End User
    16.21. GCC Countries
        16.21.1. Pricing Analysis
        16.21.2. Market Share Analysis, 2022
            16.21.2.1. By Material Type
            16.21.2.2. By Product Type
            16.21.2.3. By End User
    16.22. South Africa
        16.22.1. Pricing Analysis
        16.22.2. Market Share Analysis, 2022
            16.22.2.1. By Material Type
            16.22.2.2. By Product Type
            16.22.2.3. By End User
    16.23. Israel
        16.23.1. Pricing Analysis
        16.23.2. Market Share Analysis, 2022
            16.23.2.1. By Material Type
            16.23.2.2. By Product Type
            16.23.2.3. By End User
17. Market Structure Analysis
    17.1. Competition Dashboard
    17.2. Competition Benchmarking
    17.3. Market Share Analysis of Top Players
        17.3.1. By Regional
        17.3.2. By Material Type
        17.3.3. By Product Type
        17.3.4. By End User
18. Competition Analysis
    18.1. Competition Deep Dive
        18.1.1. Nefab AB
            18.1.1.1. Overview
            18.1.1.2. Product Portfolio
            18.1.1.3. Profitability by Market Segments
            18.1.1.4. Sales Footprint
            18.1.1.5. Strategy Overview
                18.1.1.5.1. Marketing Strategy
                18.1.1.5.2. Product Strategy
                18.1.1.5.3. Channel Strategy
        18.1.2. Edwards Wood Products
            18.1.2.1. Overview
            18.1.2.2. Product Portfolio
            18.1.2.3. Profitability by Market Segments
            18.1.2.4. Sales Footprint
            18.1.2.5. Strategy Overview
                18.1.2.5.1. Marketing Strategy
                18.1.2.5.2. Product Strategy
                18.1.2.5.3. Channel Strategy
        18.1.3. Green Pack Industries
            18.1.3.1. Overview
            18.1.3.2. Product Portfolio
            18.1.3.3. Profitability by Market Segments
            18.1.3.4. Sales Footprint
            18.1.3.5. Strategy Overview
                18.1.3.5.1. Marketing Strategy
                18.1.3.5.2. Product Strategy
                18.1.3.5.3. Channel Strategy
        18.1.4. Napa Wooden Box Co.
            18.1.4.1. Overview
            18.1.4.2. Product Portfolio
            18.1.4.3. Profitability by Market Segments
            18.1.4.4. Sales Footprint
            18.1.4.5. Strategy Overview
                18.1.4.5.1. Marketing Strategy
                18.1.4.5.2. Product Strategy
                18.1.4.5.3. Channel Strategy
        18.1.5. Ongna Wood Products
            18.1.5.1. Overview
            18.1.5.2. Product Portfolio
            18.1.5.3. Profitability by Market Segments
            18.1.5.4. Sales Footprint
            18.1.5.5. Strategy Overview
                18.1.5.5.1. Marketing Strategy
                18.1.5.5.2. Product Strategy
                18.1.5.5.3. Channel Strategy
        18.1.6. Shur-way Industries Inc.
            18.1.6.1. Overview
            18.1.6.2. Product Portfolio
            18.1.6.3. Profitability by Market Segments
            18.1.6.4. Sales Footprint
            18.1.6.5. Strategy Overview
                18.1.6.5.1. Marketing Strategy
                18.1.6.5.2. Product Strategy
                18.1.6.5.3. Channel Strategy
        18.1.7. Rowlinson Packaging Ltd
            18.1.7.1. Overview
            18.1.7.2. Product Portfolio
            18.1.7.3. Profitability by Market Segments
            18.1.7.4. Sales Footprint
            18.1.7.5. Strategy Overview
                18.1.7.5.1. Marketing Strategy
                18.1.7.5.2. Product Strategy
                18.1.7.5.3. Channel Strategy
        18.1.8. C&K Box Company Inc.
            18.1.8.1. Overview
            18.1.8.2. Product Portfolio
            18.1.8.3. Profitability by Market Segments
            18.1.8.4. Sales Footprint
            18.1.8.5. Strategy Overview
                18.1.8.5.1. Marketing Strategy
                18.1.8.5.2. Product Strategy
                18.1.8.5.3. Channel Strategy
        18.1.9. C Jackson & Sons Ltd.
            18.1.9.1. Overview
            18.1.9.2. Product Portfolio
            18.1.9.3. Profitability by Market Segments
            18.1.9.4. Sales Footprint
            18.1.9.5. Strategy Overview
                18.1.9.5.1. Marketing Strategy
                18.1.9.5.2. Product Strategy
                18.1.9.5.3. Channel Strategy
        18.1.10. Bay wood products Inc.
            18.1.10.1. Overview
            18.1.10.2. Product Portfolio
            18.1.10.3. Profitability by Market Segments
            18.1.10.4. Sales Footprint
            18.1.10.5. Strategy Overview
                18.1.10.5.1. Marketing Strategy
                18.1.10.5.2. Product Strategy
                18.1.10.5.3. Channel Strategy
        18.1.11. Arrington Lumber and Pallet Company
            18.1.11.1. Overview
            18.1.11.2. Product Portfolio
            18.1.11.3. Profitability by Market Segments
            18.1.11.4. Sales Footprint
            18.1.11.5. Strategy Overview
                18.1.11.5.1. Marketing Strategy
                18.1.11.5.2. Product Strategy
                18.1.11.5.3. Channel Strategy
        18.1.12. LJB Timber Packaging Pty. Ltd.
            18.1.12.1. Overview
            18.1.12.2. Product Portfolio
            18.1.12.3. Profitability by Market Segments
            18.1.12.4. Sales Footprint
            18.1.12.5. Strategy Overview
                18.1.12.5.1. Marketing Strategy
                18.1.12.5.2. Product Strategy
                18.1.12.5.3. Channel Strategy
19. Assumptions & Acronyms Used
20. Research Methodology
Recommendations

Packaging

Wooden Box Market

April 2024

REP-GB-9215

339 pages

Chemicals & Materials

Plywood Market

November 2023

REP-GB-3463

322 pages

Packaging

Wooden Barrels Market

January 2023

REP-GB-13181

250 pages

Packaging

Plywood Boxes Market

October 2022

REP-GB-5794

250 pages

Explore Packaging Insights

View Reports
Future Market Insights

Wooden & Plywood Packaging Market

Schedule a Call