
- Market Size (2026)
- USD 14.4 Bn
- Forecast (2036)
- USD 106.3 Bn
- CAGR (2026 to 2036)
- 22.1%
How big is Oil & Gas Analytics Market in 2026?
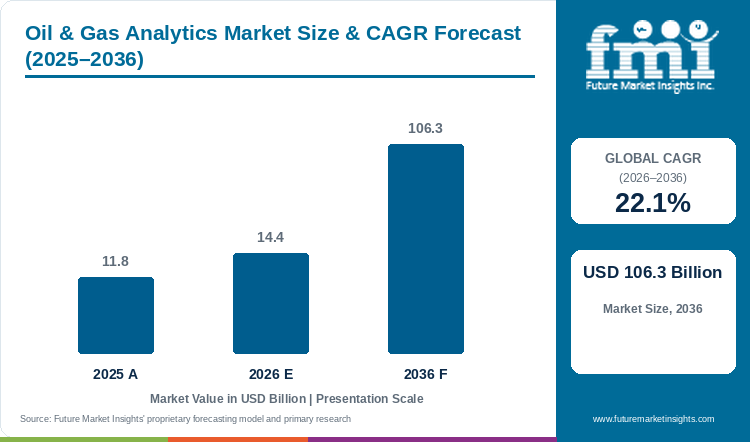
Demand is projected to expand at 22.1% CAGR from 2026 to 2036. Market value rises from USD 11.8 billion in 2025 to USD 14.41 billion in 2026 and USD 106.35 billion by 2036.
The oil and gas analytics market is estimated at USD 14.41 billion in 2026 and is projected to reach USD 106.35 billion by 2036, compared with USD 11.8 billion in 2025, as operators seek applications that connect subsurface and operating data with decisions about production and asset performance. The buying requirement includes the ability to use existing records and maintain an analytical model within the operating workflow, rather than simply add storage capacity. SLB's Delfi platform illustrates the use of a subscription software environment across exploration and production, while Microsoft's energy data platform emphasises the connections needed between information and industry applications. Public petroleum information also has a role in the operating environment, as demonstrated by Norway's dashboards for exploration wells and resources. Customers nevertheless need an application suited to their own decision and data, because technology readiness can vary between established production tools and models still requiring validation. The UK technology assessment makes those differences visible across named applications. Commercial growth therefore depends on integration and continuing support as well as software capability, with suppliers competing on how reliably their analysis fits the customer's field and planning process.
Key Market Trends & Insights
- Petroleum-specific decisions create a clearer software requirement than general AI spending.
- Model readiness does not remove the need for operating validation.
- Decision-focused integration can connect existing data with a paid service.
Regional Highlights
- Saudi petroleum operators evaluating analytics need a defined connection between the application and the operating task, whether the requirement concerns production planning, equipment behaviour or the interpretation of subsurface information (FMI outlook: 23.6% CAGR, 2026 to 2036).
- Norway's petroleum information environment includes public dashboards addressing exploration wells and resource data, giving industry participants a practical example of information organised around defined petroleum subjects (FMI outlook: 22.1% CAGR, 2026 to 2036).
- The UK petroleum analytics opportunity includes established production applications alongside newer models at different stages of technical development, which makes readiness a meaningful part of procurement (FMI outlook: 22.1% CAGR, 2026 to 2036).
Market Size & Forecast
Table 1: Market Size and Forecast for Oil & Gas Analytics Market (USD billion and percentage), 2025 to 2036
| Metric | Value |
|---|---|
| 2025 market value | USD 11.8 billion |
| 2026 market value | USD 14.41 billion |
| 2036 market value | USD 106.35 billion |
| CAGR 2026 to 2036 | 22.1% |
| Revenue increase 2026 to 2036 | USD 91.94 billion |
| Market expansion 2026 to 2036 | 7.38 times |
Petroleum analytics demand develops around decisions that require a usable connection between operating records and a maintained model, giving implementation quality a direct influence on software value. The forecast covers applications serving those petroleum workflows, with integration, user access and continuing support shaping the ability of a customer to carry analytical work into routine planning or production.
The Smart Mining Technologies Market offers a related industrial example of connecting equipment information with operating decisions, giving analytics suppliers another application setting to compare.
Petroleum applications and data integration
Petroleum information is being organised into applications that support identifiable technical and operating tasks. Norway’s public dashboards, the UK’s technology-readiness assessment and commercial energy-data platforms illustrate how the availability of records is being connected with practical analytical use.
Table 2: Industry evidence relevant to the oil & gas analytics market
| Indicator | Data point or observation | Market relevance | Source |
|---|---|---|---|
| Public petroleum information | Norway describes dashboards for exploration wells and petroleum resources. | Organised information supports defined industry tasks. | |
| Technology readiness | The UK assessment distinguishes readiness levels for analytical tools. | Application maturity affects implementation work. | |
| Connected applications | SLB and Microsoft describe petroleum software and energy-data environments. | Data access and application integration support continuing use. |
Analyst Perspective
"Energy analytics starts with operational information that teams can connect to a useful decision. A cloud platform needs dependable data handling and a fit with existing applications, while integration and continuing administration influence how consistently the customer can use analysis across its energy operations."
- Nikhil Kaitwade, Future Market Insights
How is the Oil & Gas Analytics Market segmented?
The market is segmented by Deployment, Application, and Region.
The market is segmented by Deployment, Application and Region, with upstream, midstream and downstream workflows considered separately and hosted deployment distinguished from on-premise systems.
Why does the Upstream analytics segment account for a substantial share of application demand?
Table 3: Application Share for Oil & Gas Analytics Market (percentage share), 2026
| Application | Scenario share estimate (2026) |
|---|---|
| Upstream analytics | 48.0% |
| Midstream and downstream analytics combined | 52.0% |
| Total | 100.0% |
Table 4: Segment Position and Market Growth for Oil & Gas Analytics Market, 2026 to 2036
| Metric | Value |
|---|---|
| Global CAGR (2026 to 2036) | 22.1% |
| Profiled application segment | Upstream analytics |
The Upstream analytics segment accounts for an estimated 48.0% of application demand in 2026 because exploration and production decisions depend on combining subsurface information with records of field behaviour. A useful application can support reservoir interpretation, production forecasting or the monitoring of operating equipment, while the customer needs to understand how the model relates to the decision being made. SLB describes Delfi as a software environment spanning exploration, development, drilling and production, which illustrates the range of related workflows within this application group. Integration remains central to purchasing, because a technically capable model needs suitable data and a workable route into the customer's planning process before it can support repeated operating decisions.
The Upstream analytics segment accounts for an estimated 48.0% of application demand under the 2026 market scenario.
- The Upstream analytics segment accounts for an estimated 48.0% of application demand in 2026.
- Upstream software purchases are shaped by the model's petroleum application, the data available and the support needed to keep it usable.
What supports hosted systems within the deployment mix?
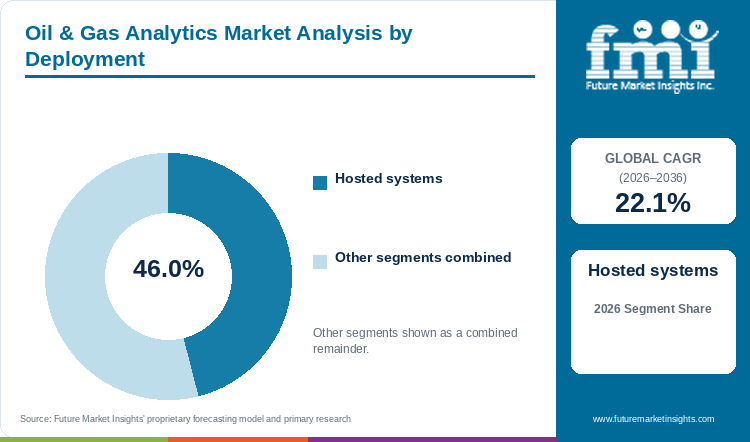
Table 5: Deployment Share for Oil & Gas Analytics Market (percentage share), 2026
| Deployment | Scenario share estimate (2026) |
|---|---|
| Hosted systems | 46.0% |
| On-premise systems | 54.0% |
| Total | 100.0% |
Hosted systems represent an estimated 46.0% of deployment demand in 2026, offering a route for teams to access petroleum applications and data across locations without administering every part of the underlying environment themselves. The purchasing decision still depends on the software and information responsibilities included in the service. Microsoft's Azure Data Manager for Energy describes a managed platform aligned with OSDU standards and connections with industry applications, while SLB offers Delfi through a subscription model. Customers therefore compare access control, integration and ongoing support alongside the hosting arrangement, with the choice influenced by how existing subsurface and operating records can be used within the proposed environment.
The Hosted systems segment accounts for an estimated 46.0% of deployment demand under the 2026 market scenario.
- The Hosted systems segment accounts for an estimated 46.0% of deployment demand in 2026.
- On-premise deployments remain relevant where an operator's architecture or operating requirements favour locally administered systems.
- Recovery installations discussed in the Flare Gas Recovery System Market can provide operating records that petroleum teams use when evaluating gas-handling performance.
What are the drivers, restraints, and opportunities in the Oil & Gas Analytics Market?
Petroleum analytics gains commercial value when a maintained application connects relevant records with a defined operating decision. Integration effort and application maturity can slow deployment, while clearer interfaces and continuing support create opportunities for suppliers to improve the customer’s route to routine use.
Driver
Operators need petroleum information that can be used within an identifiable planning or production decision, giving application fit and model maintenance a direct role in software purchasing. Norway’s public dashboards and the UK’s technology assessment describe specific information tasks and applications within the sector. Commercial providers can serve related customer requirements when their software connects the relevant records with a usable and maintained operating workflow.
Restraint
An analytics application needs validation against the data and decision involved in its intended use, while integration can remain demanding even when the underlying technology is established. The UK assessment distinguishes tools at different readiness levels. Customers therefore need to consider the work required to fit an application into their environment, with continuing support relevant to preserving the usefulness of a model as operating records and conditions change.
Opportunity
A supplier can create value by connecting a petroleum application with the records and user responsibilities needed to operate it consistently. SLB’s Delfi and Microsoft’s energy data platform illustrate related roles in software access and information integration. Providers that explain those interfaces clearly can help customers evaluate a practical deployment and the continuing services required to keep the analytical result useful within an operating decision.
Reliable process records depend in part on measurement practice, creating a connection with the instrument capabilities covered in the Multifunction Calibrators Market.
Which country CAGRs are profiled in the Oil & Gas Analytics Market?
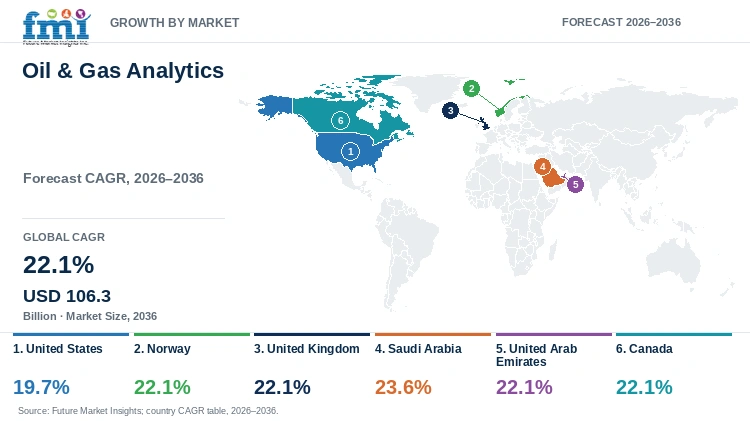
Table 6: Country CAGR Comparison for Oil & Gas Analytics Market (CAGR percentage), 2026 to 2036
| Country | CAGR |
|---|---|
| United States | 19.7% |
| Norway | 22.1% |
| United Kingdom | 22.1% |
| Saudi Arabia | 23.6% |
| United Arab Emirates | 22.1% |
| Canada | 22.1% |
Country-wise Analysis
United States Oil & Gas Analytics Market Outlook (2026 to 2036)
US petroleum analytics customers need applications that connect field information with an identifiable production or planning decision, particularly when records originate in different systems and operating locations. Microsoft's energy data platform describes a managed environment that supports OSDU compatibility and integration with industry applications, providing one example of the infrastructure behind those workflows. The operator still needs to define the model and the decision it supports, because a shared data environment becomes commercially useful when users can apply it within everyday work. Suppliers consequently compete on integration and continuing model support alongside software capability, while customer teams compare access controls and the responsibilities included in the service before committing to a deployment.
Norway Oil & Gas Analytics Market Outlook (2026 to 2036)
Norway's petroleum information environment includes public dashboards addressing exploration wells and resource data, giving industry participants a practical example of information organised around defined petroleum subjects. The Offshore Directorate describes these applications in its account of 2025 digitalisation activity. Commercial analytics providers serving operators in the country need to connect that wider information setting with customer-specific records and decisions, including the models used in field planning and production work. Buyers consequently examine how an application handles the meaning and history of its inputs, while suppliers need to maintain the connection between the analytical result and the operating workflow in which that result will be used.
United Kingdom Oil & Gas Analytics Market Outlook (2026 to 2036)
The UK petroleum analytics opportunity includes established production applications alongside newer models at different stages of technical development, which makes readiness a meaningful part of procurement. The North Sea Transition Authority's technology assessment distinguishes self-service analytics and production forecasting from developing microseismic machine-learning applications. An operator comparing those offers needs to understand what remains to be validated for its own data and decision, while the supplier needs a practical implementation route rather than a general statement of analytical capability. Integration with existing production work also affects value, because a useful model must remain understandable and maintainable as operating conditions and the available information change during its period of use.
Saudi Arabia Oil & Gas Analytics Market Outlook (2026 to 2036)
Saudi petroleum operators evaluating analytics need a defined connection between the application and the operating task, whether the requirement concerns production planning, equipment behaviour or the interpretation of subsurface information. Large operating systems can create substantial information requirements, although the purchased software needs to address an identifiable decision rather than the general scale of petroleum activity. The supplier's proposition consequently depends on data integration and a model suited to the field, with clear responsibility for maintaining its usefulness after deployment. Buyers also need to compare how applications can work with existing records and user permissions, so continuing support and implementation capability remain relevant alongside the functions demonstrated during a software evaluation.
United Arab Emirates Oil & Gas Analytics Market Outlook (2026 to 2036)
UAE petroleum analytics purchases involve both the information environment and the applications used to interpret that information, giving integration a central role in the supplier comparison. A subsurface team needs access to usable records while retaining a clear understanding of which model supports the intended decision and who maintains it as the project develops. Microsoft's energy data platform illustrates the separate role of managed data infrastructure and connections with industry software. For the customer, the practical question is how those elements fit within an operating workflow, while vendors need an offer that explains implementation responsibilities and the ongoing support attached to the analytical application after the initial deployment.
Canada Oil & Gas Analytics Market Outlook (2026 to 2036)
Canadian field-analytics customers need models that fit the production workflow and the information available for the asset being evaluated, which makes application selection more specific than a broad investment in digital infrastructure. A supplier can support planning or operating decisions when the relevant data can be connected with a maintained analytical model and a user who understands its purpose. Subscription environments such as SLB's Delfi demonstrate one route for bringing applications and data together across petroleum disciplines. Buyers comparing that route with other deployments also need to examine service responsibilities and the work required to preserve the model's usefulness as operating records and field conditions develop over time.
Who are the notable companies in the Oil & Gas Analytics Market?
SLB; Halliburton; Baker Hughes; IBM; Microsoft
SLB, Halliburton and Baker Hughes bring petroleum and industrial application experience, while IBM and Microsoft contribute enterprise data and computing capabilities. The relevant comparison follows the decision being supported, since subsurface analysis, production planning and energy-data management involve different combinations of models, records and user responsibilities.
Competitive Benchmarking: Oil & Gas Analytics Market
Table 7: Competitive positioning for the oil & gas analytics market
| Company | Positioning | Commercial distinction |
|---|---|---|
| SLB | Petroleum digital and analytical technology | Subsurface and production workflow fit |
| Halliburton | Petroleum software and services | Model scope and operating integration |
| Baker Hughes | Industrial and petroleum analytics | Defined application and validation |
| IBM | Enterprise data and analytics | Petroleum-specific configuration and service boundary |
| Microsoft | Cloud and analytics technology | Infrastructure versus application-level value |
Key Developments in the Oil & Gas Analytics Market
- Norway describes petroleum dashboards for exploration wells and resources. Industry users need information organised around specific petroleum subjects.
- The UK technology assessment distinguishes the readiness of named analytical tools. Operators need a model appropriate to their actual application.
- SLB and Microsoft describe connected software and energy-data environments. Teams need applications that can access relevant records.
Key Players in the Oil & Gas Analytics Market
Petroleum digital and analytical technology
- SLB
Petroleum software and services
- Halliburton
Industrial and petroleum analytics
- Baker Hughes
Enterprise data and analytics
- IBM
Cloud and analytics technology
- Microsoft
Oil & Gas Analytics Market Report Scope
Table 8: Report Scope for Oil & Gas Analytics Market, 2026 to 2036
| Coverage field | Report scope |
|---|---|
| Market definition | The market covers petroleum-specific analytics software and subsurface and production decision workflows. Generic AI investment and data-storage volume are excluded, as is unrelated oilfield capital spending. |
| Quantitative units | USD billion |
| Historical reference year | 2025 |
| Forecast period | 2026 to 2036 |
| Market breakdown | Deployment; Application; Region |
| Countries profiled | United States; Norway; United Kingdom; Saudi Arabia; United Arab Emirates; Canada |
| Regions covered | North America; Latin America; Western Europe; Eastern Europe; East Asia; South Asia and Pacific; Middle East and Africa |
| Key companies profiled | SLB; Halliburton; Baker Hughes; IBM; Microsoft |
Oil & Gas Analytics Market Research Methodology
Table 9: Research Methodology for Oil & Gas Analytics Market, 2026 edition
| Method | Approach |
|---|---|
| Market definition | The market covers petroleum-specific analytics software and subsurface and production decision workflows. Generic AI investment and data-storage volume are excluded, as is unrelated oilfield capital spending. |
| Secondary research | Public institutional reports, regulator publications, technical literature and supplier documentation provide the operating context for the market. |
| Quantitative coverage | Market values are expressed in USD billion, with a 2025 base value, a 2026 estimate and a projection for 2036. |
| Segment and country assessment | Segment categories retain distinct demand measures, while each country profile is linked with its estimated CAGR for 2026 to 2036. |
| Company comparison | Representative participants are compared by the product or service offered, the customer application and the implementation requirements relevant to procurement. |
Oil & Gas Analytics Market by Segments
Oil & Gas Analytics Market segmented by Deployment:
- On-premise systems
- Hosted systems
Oil & Gas Analytics Market segmented by Application:
- Upstream
- Exploration and drilling
- Field surveillance and monitoring
- Production planning and forecasting
- Equipment maintenance
- Asset performance and workforce management
- Midstream
- Pipeline SCADA
- Fleet and storage optimisation
- Downstream
- Commodity trading
- Demand forecasting
- Pricing and refining
- Exploration and drilling
Oil & Gas Analytics Market by Region
- North America
- United States
- Canada
- Latin America
- Brazil
- Mexico
- Argentina
- Chile
- Western Europe
- Germany
- France
- United Kingdom
- Italy
- Spain
- Benelux
- Nordics
- Eastern Europe
- Poland
- Czech Republic
- Romania
- Hungary
- East Asia
- China
- Japan
- South Korea
- South Asia and Pacific
- India
- ASEAN
- Australia and New Zealand
- Middle East and Africa
- GCC Countries
- South Africa
- Türkiye
- Israel
Research Sources and Bibliography
- [1] Norwegian Offshore Directorate. 2026. The Shelf in 2025: Data management, digitalisation and cooperation
- [2] North Sea Transition Authority. 2025. Technology Insights 2025: Digital and data
- [3] SLB. Accessed 16 October 2026. Delfi digital platform
- [4] Microsoft. Accessed 16 October 2026. Azure Data Manager for Energy overview
This Report Answers
- How large is the Oil & Gas Analytics Market in 2026?
- What is the growth outlook for the Oil & Gas Analytics Market through 2036?
- What is the 2026 share of Upstream analytics?
- What is the 2026 share of Hosted systems?
- Which profiled market has the highest projected growth?
- Who are the notable participants in the Oil & Gas Analytics Market?
Table of Content
- Key Takeaways
- Market Size and CAGR
- Top Growth Driver
- Fastest Growing Segment
- Leading Region
- Key Companies
- Emerging Opportunities
- Executive Summary
- Global Market Outlook
- Demand-side Trends
- Supply-side Trends
- Technology Roadmap Analysis
- Analysis and Recommendations
- Analyst Perspective (What is happening? Why now? What should investors know?)
- Key Questions Answered
- How large is the market?
- What is the CAGR?
- What are key trends?
- Which region dominates?
- Who are the leaders?
Read More...
- Market Overview
- Market Coverage / Taxonomy
- Market Definition / Scope / Limitations
- Research Methodology
- Chapter Orientation
- Analytical Lens and Working Hypotheses
- Market Structure, Signals, and Trend Drivers
- Benchmarking and Cross-market Comparability
- Market Sizing, Forecasting, and Opportunity Mapping
- Research Design and Evidence Framework
- Desk Research Programme (Secondary Evidence)
- Expert Input and Fieldwork (Primary Evidence)
- Tooling, Models, and Reference Databases
- Data Engineering and Model Build
- Quality Assurance and Audit Trail
- Market Background
- Market Dynamics (Drivers, Restraints, Opportunity, Trends)
- Scenario Forecast (Optimistic, Likely, Conservative)
- Impact Analysis
- AI Impact
- Sustainability Impact
- Regulatory Impact
- Technology Impact
- Consumer / Buyer Analysis
- Purchase Drivers
- Adoption Barriers
- Buyer Journey
- Opportunity Map Analysis
- Product Life Cycle Analysis
- Supply Chain Analysis
- Investment Feasibility Matrix
- Value Chain Analysis
- PESTLE and Porter's Analysis
- Regulatory Landscape
- Regional Parent Market Outlook
- Production and Consumption Statistics
- Import and Export Statistics
- Global Market Analysis and Forecast, 2021 to 2036
- Historical Market Size Value (USD Billion) Analysis, 2021 to 2025
- Current and Future Market Size Value (USD Billion) Projections, 2026 to 2036
- Y-o-Y Growth Trend Analysis
- Absolute $ Opportunity Analysis
- Global Market Pricing Analysis, 2021 to 2036
- Global Market Analysis and Forecast, By Deployment, 2021 to 2036
- Introduction / Key Findings
- Historical Market Size Value (USD Billion) Analysis By Deployment, 2021 to 2025
- Current and Future Market Size Value (USD Billion) Analysis and Forecast By Deployment, 2026 to 2036
- On-premise systems
- Hosted systems
- Y-o-Y Growth Trend Analysis By Deployment, 2021 to 2025
- Absolute $ Opportunity Analysis By Deployment, 2026 to 2036
- Global Market Analysis and Forecast, By Application, 2021 to 2036
- Introduction / Key Findings
- Historical Market Size Value (USD Billion) Analysis By Application, 2021 to 2025
- Current and Future Market Size Value (USD Billion) Analysis and Forecast By Application, 2026 to 2036
- Upstream
- Exploration and drilling
- Field surveillance and monitoring
- Production planning and forecasting
- Equipment maintenance
- Asset performance and workforce management
- Midstream
- Pipeline SCADA
- Fleet and storage optimisation
- Downstream
- Commodity trading
- Demand forecasting
- Pricing and refining
- Y-o-Y Growth Trend Analysis By Application, 2021 to 2025
- Absolute $ Opportunity Analysis By Application, 2026 to 2036
- Global Market Analysis and Forecast, By Region, 2021 to 2036
- Introduction
- Historical Market Size Value (USD Billion) Analysis By Region, 2021 to 2025
- Current Market Size Value (USD Billion) Analysis and Forecast By Region, 2026 to 2036
- North America
- Latin America
- Western Europe
- Eastern Europe
- East Asia
- South Asia and Pacific
- Middle East and Africa
- Market Attractiveness Analysis By Region
- North America Market Analysis and Forecast, By Country, 2021 to 2036
- Historical Market Size Value (USD Billion) Trend Analysis By Market Taxonomy, 2021 to 2025
- Market Size Value (USD Billion) Forecast By Market Taxonomy, 2026 to 2036
- By Country
- United States
- Canada
- By Deployment
- By Application
- By Country
- Market Attractiveness Analysis
- By Country
- By Deployment
- By Application
- Key Takeaways
- Latin America Market Analysis and Forecast, By Country
- Historical Market Size Value (USD Billion) Trend Analysis By Market Taxonomy, 2021 to 2025
- Market Size Value (USD Billion) Forecast By Market Taxonomy, 2026 to 2036
- By Country
- Brazil
- Mexico
- Argentina
- Chile
- By Deployment
- By Application
- By Country
- Market Attractiveness Analysis
- By Country
- By Deployment
- By Application
- Key Takeaways
- Western Europe Market Analysis and Forecast, By Country
- Historical Market Size Value (USD Billion) Trend Analysis By Market Taxonomy, 2021 to 2025
- Market Size Value (USD Billion) Forecast By Market Taxonomy, 2026 to 2036
- By Country
- United Kingdom
- Norway
- Germany
- France
- Italy
- Spain
- Benelux
- Nordics
- By Deployment
- By Application
- By Country
- Market Attractiveness Analysis
- By Country
- By Deployment
- By Application
- Key Takeaways
- Eastern Europe Market Analysis and Forecast, By Country
- Historical Market Size Value (USD Billion) Trend Analysis By Market Taxonomy, 2021 to 2025
- Market Size Value (USD Billion) Forecast By Market Taxonomy, 2026 to 2036
- By Country
- Poland
- Czech Republic
- Romania
- Hungary
- By Deployment
- By Application
- By Country
- Market Attractiveness Analysis
- By Country
- By Deployment
- By Application
- Key Takeaways
- East Asia Market Analysis and Forecast, By Country
- Historical Market Size Value (USD Billion) Trend Analysis By Market Taxonomy, 2021 to 2025
- Market Size Value (USD Billion) Forecast By Market Taxonomy, 2026 to 2036
- By Country
- China
- Japan
- South Korea
- By Deployment
- By Application
- By Country
- Market Attractiveness Analysis
- By Country
- By Deployment
- By Application
- Key Takeaways
- South Asia and Pacific Market Analysis and Forecast, By Country
- Historical Market Size Value (USD Billion) Trend Analysis By Market Taxonomy, 2021 to 2025
- Market Size Value (USD Billion) Forecast By Market Taxonomy, 2026 to 2036
- By Country
- India
- ASEAN
- Australia and New Zealand
- By Deployment
- By Application
- By Country
- Market Attractiveness Analysis
- By Country
- By Deployment
- By Application
- Key Takeaways
- Middle East and Africa Market Analysis and Forecast, By Country
- Historical Market Size Value (USD Billion) Trend Analysis By Market Taxonomy, 2021 to 2025
- Market Size Value (USD Billion) Forecast By Market Taxonomy, 2026 to 2036
- By Country
- Saudi Arabia
- United Arab Emirates
- GCC Countries
- South Africa
- Türkiye
- Israel
- By Deployment
- By Application
- By Country
- Market Attractiveness Analysis
- By Country
- By Deployment
- By Application
- Key Takeaways
- Key Countries Market Analysis
- United States
- Pricing Analysis
- Market Share Analysis, 2025
- By Deployment
- By Application
- Canada
- Pricing Analysis
- Market Share Analysis, 2025
- By Deployment
- By Application
- Mexico
- Pricing Analysis
- Market Share Analysis, 2025
- By Deployment
- By Application
- Brazil
- Pricing Analysis
- Market Share Analysis, 2025
- By Deployment
- By Application
- Chile
- Pricing Analysis
- Market Share Analysis, 2025
- By Deployment
- By Application
- Germany
- Pricing Analysis
- Market Share Analysis, 2025
- By Deployment
- By Application
- United Kingdom
- Pricing Analysis
- Market Share Analysis, 2025
- By Deployment
- By Application
- Italy
- Pricing Analysis
- Market Share Analysis, 2025
- By Deployment
- By Application
- Spain
- Pricing Analysis
- Market Share Analysis, 2025
- By Deployment
- By Application
- France
- Pricing Analysis
- Market Share Analysis, 2025
- By Deployment
- By Application
- India
- Pricing Analysis
- Market Share Analysis, 2025
- By Deployment
- By Application
- ASEAN
- Pricing Analysis
- Market Share Analysis, 2025
- By Deployment
- By Application
- Australia and New Zealand
- Pricing Analysis
- Market Share Analysis, 2025
- By Deployment
- By Application
- China
- Pricing Analysis
- Market Share Analysis, 2025
- By Deployment
- By Application
- Japan
- Pricing Analysis
- Market Share Analysis, 2025
- By Deployment
- By Application
- South Korea
- Pricing Analysis
- Market Share Analysis, 2025
- By Deployment
- By Application
- Poland
- Pricing Analysis
- Market Share Analysis, 2025
- By Deployment
- By Application
- Hungary
- Pricing Analysis
- Market Share Analysis, 2025
- By Deployment
- By Application
- Türkiye
- Pricing Analysis
- Market Share Analysis, 2025
- By Deployment
- By Application
- South Africa
- Pricing Analysis
- Market Share Analysis, 2025
- By Deployment
- By Application
- Norway
- Pricing Analysis
- Market Share Analysis, 2025
- By Deployment
- By Application
- Saudi Arabia
- Pricing Analysis
- Market Share Analysis, 2025
- By Deployment
- By Application
- United Arab Emirates
- Pricing Analysis
- Market Share Analysis, 2025
- By Deployment
- By Application
- United States
- Market Structure Analysis
- Competition Dashboard
- Competition Benchmarking
- Market Share Analysis of Top Players
- By Regional
- By Deployment
- By Application
- Emerging Startups
- Innovation Benchmarking
- Competition Analysis
- Competition Deep Dive
- SLB
- Overview
- Product Portfolio
- Profitability by Market Segments
- Sales Footprint
- Strategy Overview
- Marketing Strategy
- Product Strategy
- Channel Strategy
- Halliburton
- Baker Hughes
- IBM
- Microsoft
- SLB
- Case Studies
- Success Stories
- Recent Developments
- Competition Deep Dive
- Assumptions & Acronyms Used
List of Tables
- Table 1: Global Market Value (USD Billion) Forecast by Region, 2021 to 2036
- Table 2: Global Market Value (USD Billion) Forecast by Deployment, 2021 to 2036
- Table 3: Global Market Value (USD Billion) Forecast by Application, 2021 to 2036
- Table 4: North America Market Value (USD Billion) Forecast by Country, 2021 to 2036
- Table 5: North America Market Value (USD Billion) Forecast by Deployment, 2021 to 2036
- Table 6: North America Market Value (USD Billion) Forecast by Application, 2021 to 2036
- Table 7: Latin America Market Value (USD Billion) Forecast by Country, 2021 to 2036
- Table 8: Latin America Market Value (USD Billion) Forecast by Deployment, 2021 to 2036
- Table 9: Latin America Market Value (USD Billion) Forecast by Application, 2021 to 2036
- Table 10: Western Europe Market Value (USD Billion) Forecast by Country, 2021 to 2036
- Table 11: Western Europe Market Value (USD Billion) Forecast by Deployment, 2021 to 2036
- Table 12: Western Europe Market Value (USD Billion) Forecast by Application, 2021 to 2036
- Table 13: Eastern Europe Market Value (USD Billion) Forecast by Country, 2021 to 2036
- Table 14: Eastern Europe Market Value (USD Billion) Forecast by Deployment, 2021 to 2036
- Table 15: Eastern Europe Market Value (USD Billion) Forecast by Application, 2021 to 2036
- Table 16: East Asia Market Value (USD Billion) Forecast by Country, 2021 to 2036
- Table 17: East Asia Market Value (USD Billion) Forecast by Deployment, 2021 to 2036
- Table 18: East Asia Market Value (USD Billion) Forecast by Application, 2021 to 2036
- Table 19: South Asia and Pacific Market Value (USD Billion) Forecast by Country, 2021 to 2036
- Table 20: South Asia and Pacific Market Value (USD Billion) Forecast by Deployment, 2021 to 2036
- Table 21: South Asia and Pacific Market Value (USD Billion) Forecast by Application, 2021 to 2036
- Table 22: Middle East and Africa Market Value (USD Billion) Forecast by Country, 2021 to 2036
- Table 23: Middle East and Africa Market Value (USD Billion) Forecast by Deployment, 2021 to 2036
- Table 24: Middle East and Africa Market Value (USD Billion) Forecast by Application, 2021 to 2036
List of Figures
- Figure 1: Global Market Pricing Analysis
- Figure 2: Global Market Value (USD Billion) Forecast 2021-2036
- Figure 3: Global Market Value Share and BPS Analysis by Deployment, 2026 and 2036
- Figure 4: Global Market Y-o-Y Growth Comparison by Deployment, 2026-2036
- Figure 5: Global Market Attractiveness Analysis by Deployment
- Figure 6: Global Market Value Share and BPS Analysis by Application, 2026 and 2036
- Figure 7: Global Market Y-o-Y Growth Comparison by Application, 2026-2036
- Figure 8: Global Market Attractiveness Analysis by Application
- Figure 9: Global Market Value (USD Billion) Share and BPS Analysis by Region, 2026 and 2036
- Figure 10: Global Market Y-o-Y Growth Comparison by Region, 2026-2036
- Figure 11: Global Market Attractiveness Analysis by Region
- Figure 12: North America Market Incremental Dollar Opportunity, 2026-2036
- Figure 13: Latin America Market Incremental Dollar Opportunity, 2026-2036
- Figure 14: Western Europe Market Incremental Dollar Opportunity, 2026-2036
- Figure 15: Eastern Europe Market Incremental Dollar Opportunity, 2026-2036
- Figure 16: East Asia Market Incremental Dollar Opportunity, 2026-2036
- Figure 17: South Asia and Pacific Market Incremental Dollar Opportunity, 2026-2036
- Figure 18: Middle East and Africa Market Incremental Dollar Opportunity, 2026-2036
- Figure 19: North America Market Value Share and BPS Analysis by Country, 2026 and 2036
- Figure 20: North America Market Value Share and BPS Analysis by Deployment, 2026 and 2036
- Figure 21: North America Market Y-o-Y Growth Comparison by Deployment, 2026-2036
- Figure 22: North America Market Attractiveness Analysis by Deployment
- Figure 23: North America Market Value Share and BPS Analysis by Application, 2026 and 2036
- Figure 24: North America Market Y-o-Y Growth Comparison by Application, 2026-2036
- Figure 25: North America Market Attractiveness Analysis by Application
- Figure 26: Latin America Market Value Share and BPS Analysis by Country, 2026 and 2036
- Figure 27: Latin America Market Value Share and BPS Analysis by Deployment, 2026 and 2036
- Figure 28: Latin America Market Y-o-Y Growth Comparison by Deployment, 2026-2036
- Figure 29: Latin America Market Attractiveness Analysis by Deployment
- Figure 30: Latin America Market Value Share and BPS Analysis by Application, 2026 and 2036
- Figure 31: Latin America Market Y-o-Y Growth Comparison by Application, 2026-2036
- Figure 32: Latin America Market Attractiveness Analysis by Application
- Figure 33: Western Europe Market Value Share and BPS Analysis by Country, 2026 and 2036
- Figure 34: Western Europe Market Value Share and BPS Analysis by Deployment, 2026 and 2036
- Figure 35: Western Europe Market Y-o-Y Growth Comparison by Deployment, 2026-2036
- Figure 36: Western Europe Market Attractiveness Analysis by Deployment
- Figure 37: Western Europe Market Value Share and BPS Analysis by Application, 2026 and 2036
- Figure 38: Western Europe Market Y-o-Y Growth Comparison by Application, 2026-2036
- Figure 39: Western Europe Market Attractiveness Analysis by Application
- Figure 40: Eastern Europe Market Value Share and BPS Analysis by Country, 2026 and 2036
- Figure 41: Eastern Europe Market Value Share and BPS Analysis by Deployment, 2026 and 2036
- Figure 42: Eastern Europe Market Y-o-Y Growth Comparison by Deployment, 2026-2036
- Figure 43: Eastern Europe Market Attractiveness Analysis by Deployment
- Figure 44: Eastern Europe Market Value Share and BPS Analysis by Application, 2026 and 2036
- Figure 45: Eastern Europe Market Y-o-Y Growth Comparison by Application, 2026-2036
- Figure 46: Eastern Europe Market Attractiveness Analysis by Application
- Figure 47: East Asia Market Value Share and BPS Analysis by Country, 2026 and 2036
- Figure 48: East Asia Market Value Share and BPS Analysis by Deployment, 2026 and 2036
- Figure 49: East Asia Market Y-o-Y Growth Comparison by Deployment, 2026-2036
- Figure 50: East Asia Market Attractiveness Analysis by Deployment
- Figure 51: East Asia Market Value Share and BPS Analysis by Application, 2026 and 2036
- Figure 52: East Asia Market Y-o-Y Growth Comparison by Application, 2026-2036
- Figure 53: East Asia Market Attractiveness Analysis by Application
- Figure 54: South Asia and Pacific Market Value Share and BPS Analysis by Country, 2026 and 2036
- Figure 55: South Asia and Pacific Market Value Share and BPS Analysis by Deployment, 2026 and 2036
- Figure 56: South Asia and Pacific Market Y-o-Y Growth Comparison by Deployment, 2026-2036
- Figure 57: South Asia and Pacific Market Attractiveness Analysis by Deployment
- Figure 58: South Asia and Pacific Market Value Share and BPS Analysis by Application, 2026 and 2036
- Figure 59: South Asia and Pacific Market Y-o-Y Growth Comparison by Application, 2026-2036
- Figure 60: South Asia and Pacific Market Attractiveness Analysis by Application
- Figure 61: Middle East and Africa Market Value Share and BPS Analysis by Country, 2026 and 2036
- Figure 62: Middle East and Africa Market Value Share and BPS Analysis by Deployment, 2026 and 2036
- Figure 63: Middle East and Africa Market Y-o-Y Growth Comparison by Deployment, 2026-2036
- Figure 64: Middle East and Africa Market Attractiveness Analysis by Deployment
- Figure 65: Middle East and Africa Market Value Share and BPS Analysis by Application, 2026 and 2036
- Figure 66: Middle East and Africa Market Y-o-Y Growth Comparison by Application, 2026-2036
- Figure 67: Middle East and Africa Market Attractiveness Analysis by Application
- Figure 68: Global Market - Tier Structure Analysis
- Figure 69: Global Market - Company Share Analysis
Frequently Asked Questions
How large is the Oil & Gas Analytics Market in 2026?
The market is estimated at USD 14.41 billion in 2026, compared with USD 11.8 billion in 2025.
What is the growth outlook for the Oil & Gas Analytics Market through 2036?
The market is projected to reach USD 106.35 billion by 2036, representing a CAGR of 22.1% from 2026 to 2036.
What is the 2026 share of Upstream analytics?
The Upstream analytics segment is estimated to account for 48% of application demand under the 2026 market scenario. Upstream software purchases are shaped by the model's petroleum application, the data available and the support needed to keep it usable.
What is the 2026 share of Hosted systems?
The Hosted systems segment is estimated to account for 46% of deployment demand under the 2026 market scenario. On-premise deployments remain relevant where an operator's architecture or operating requirements favour locally administered systems.
Which profiled market has the highest projected growth?
Saudi Arabia has the highest projected rate among the markets profiled, at 23.6% CAGR from 2026 to 2036.
Who are the notable participants in the Oil & Gas Analytics Market?
Representative participants include SLB, Halliburton, Baker Hughes, IBM, Microsoft.
Preview the report firsthand - request a free sample
Get SampleGet the brochure for pricing and purchase details.
Get PDF
