Reports

- Global Locations -

Headquarters

Future Market Insights, Inc.

Christiana Corporate, 200
Continental Drive, Suite 401,
Newark, Delaware - 19713,
United States

T: +1-845-579-5705

Americas

Future Market Insights, Inc.

616 Corporate Way, Suite 2-9018,
Valley Cottage, NY 10989, United States

T: +1-347-918-3531

MEA

Future Market Insights

1602-6 Jumeirah Bay X2 Tower, Plot No: JLT-PH2-X2A,
Jumeirah Lakes Towers, Dubai,
United Arab Emirates

Europe

Future Market Insights

3rd Floor, 207 Regent Street,
W1B 3HH London
United Kingdom

T: + 44 (0) 20 8123 9659
D: +44 (0) 20 3287 4268

Asia Pacific

Future Market Insights

IndiaLand Global Tech Park, Unit UG-1, Behind Grand HighStreet, Phase 1, Hinjawadi, MH, Pune – 411057, India

About the Report

The oil & gas industry has witnessed substantial growth in the recent decades. This growth is expected to persist over the coming years owing to increasing investments for oil & gas exploration activities across the globe. Oil & gas seals are necessary components having varied applications including drilling, processing refining and transportation, etc. Subsequently, the growth in oil & gas industry creates opportunities for these seals.

In its new study, ESOMAR-certified market research and consulting firm Future Market Insights (FMI) offers insights about key factors driving demand for oil & gas seals. The report tracks the global sales of oil & gas seals in 20+ high-growth markets, along with analyzing the impact COVID-19 has had on oil & gas seals.

Don't pay for what you don't need

Customize your report by selecting specific countries or regions and save 30%!

Historical and Future Outlook on Oil and Gas Seals

According to FMI’s analysis, oil & gas seals sales have grown at 2.1% CAGR between 2016 and 2020. Compliance with challenges like extreme temperatures, high pressures, and exposure to aggressive fluids has always been the prime concern for oil & gas companies. Choosing a suitable sealing compound for equipment used in the oilfield service environment is critical for safety, reliability, and minimal downtime.

As the Oil & Gas industry pushes its equipment to ever greater limits for exploring new avenues of obtaining oil, the need for more robust, high-performance seals is expected to surge during the coming years. Leading manufacturers are focused on developing technologically advanced seals specifically for high pressures and high temperatures, as well as rapid gas decompression, such as Trelleborg’s XploR S-Seal and XploR FS-Seal.

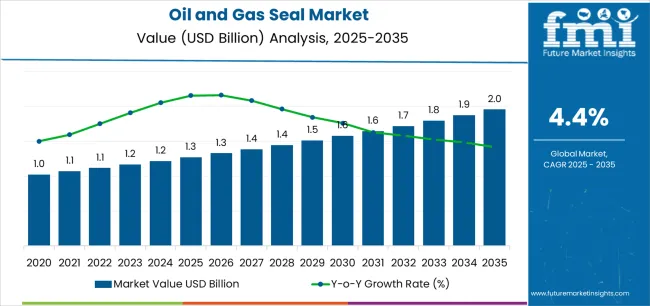
The COVID-19 pandemic has negatively impacted the oil & gas seals market, witnessing a significant plunge in 2020. With a number of end users affected in regions like North America, Europe and Asia-Pacific, the supply and shortage in demand are expected to result in a significant drop in Y-O-Y growth, yet FMI expects global oil & gas seals market to grow at 3.3% CAGR through 2031.

Expanding Oil & Gas Industry to Provide Stimulus

Globally, the oil & gas industry has demonstrated immense potential, attributed to increased reliance on fossil fuels for numerous economic activities. This trend is expected to remain prevalent across the 2021-2031 forecast period. Consequently, a number of upstream, mid-stream and downstream exploration projects have been and will be undertaking in the future.

According to the U.S Energy Information Administration, global crude oil production is expected to aggrandize, with OPEC likely to average 27.2 million barrels per day in 2021, an increase from 25.6 million barrels per day in 2020. On January 5, 2021, OPEC and partner countries announced they would maintain a production increase of 500 thousand barrels per day. The agreement also calls for production increases from Russia and Kazakhstan by February and March.

The agency further projects the consumption of petroleum and other liquids to rise by 5.6 million barrels per day in 2021 and by 3.3 million barrels per day in 2022. Attributed to all these trends, the number of exploration projects will surge, generating high demand for oil & gas seals to aid in proper extraction processes.

Nikhil Kaitwade
Nikhil Kaitwade

Principal Consultant

Talk to Analyst

Find your sweet spots for generating winning opportunities in this market.

Will Oil & Gas Seals Demand be Impacted by Tech Innovation?

Digital transformation is expected to play an instrumental role in augmenting growth of the oil & gas industry. A combination of disruptive technologies such as robotics, AI, IoT and other advanced technologies is expected to render the virtual landscape worth a multi-trillion-dollar industry. Hence, prominent oil & gas giants are likely to effectively leverage the same across their supply chains to streamline exploration processes.

Upstream exploration projects are likely to exhibit key growth potential, according to IT giant Infosys. The company advocates that exploration companies must capitalize on geological data analytical capabilities by incorporating machine learning approaches. For instance, blockchain technology can set standards of collaboration among stakeholders and service providers. The technology is likely to help reduce cost by eliminating transaction fees and also enhance data security.

Furthermore, robots may be deployed to co-ordinate and execute operations in oil wells or fields along with drones and other autonomous vehicles. Robots themselves may be able to operate drilling equipment for which the demand for seals shall remain high, pivoting growth in a positive direction in the future.  

What is the Regulatory Impact on Global Oil and Gas Seals Sales?

A key number of regulatory bodies have prescribed different norms for designing, installation and usage of oil & gas seals. Materials used for manufacturing seals for the oil & gas industry must be compliant with industry standards made by the International Organization for Standardization (ISO), Norsk Sokkels Konkurranseposisjon (NORSOK), NACE (National Association Corrosion Engineers) and American Petroleum Institute (API), etc.

Get the data you need at a Fraction of the cost

Personalize your report by choosing insights you need
and save 40%!

Country-wise Insights

How Lucrative is the U.S. Oil and Gas Seals Market?

According to Future Market Insights (FMI), the U.S oil & gas seals market was valued at US$ 152.6 Mn as of 2020. A drastic downswing was experienced due to declining output levels resulting from ceasing oil & gas exploration projects, anticipated to last until 2022. However, long-term prospects are expected to remain heightened as demand-supply shocks reconcile.

The U.S Energy Information Administration estimates that the United States is amongst the world’s largest crude oil producers, with nearly 70% of the output yielded across five major states: Texas (41.4%), Dakota (11.6%), New Mexico (7.4%), Oklahoma (4.7%) and Colorado (4.2%). As of 2019, 15% of the global oil output was registered by the United States alone. Likewise, the country is the world’s largest natural gas producer, generating 951 billion cubic meters as of 2019.

Advances in horizontal drilling and hydraulic fracturing have unlocked these previously inaccessible resources transforming the U.S. onshore market, with the share of horizontal drilling rigs active in the U.S. Attributing to these factors the U.S. remains one of the largest markets for oil & gas seals in the world, which invariably makes it a lucrative pocket for oil & gas seals manufacturers.

Prominent manufacturers such as BAL SEAL Engineering and Seal Master Corporation have a significant presence across the U.S landscape. The former manufacturers the Bal Spring canted oil springs that surpass API 622, API 641 and ISO 1548 Standards and achieve near-zero emissions. The latter provided fabric reinforced inflatable seals comprising of elastomers which regulate the introduction of engineered force, as well as seals manufactured from rubber.

What is the Outlook on German Oil & Gas Seals Market?

According to BP Statistical Review of World Energy, as of 2019, Germany was the largest energy consumer across Europe and the 7th largest consumer in the world. However, majority of these requirements are fulfilled by imports rather than domestic production. Petroleum and other liquids constitute the primary energy sources, accounting for 35% of total consumption, amounting to 2.4 million barrels per day.

With respect to natural gas, Germany consumed 8.6 billion cubic feet per day in 2019, representing a quarter of the total primary energy consumption. While these figures appear to point towards a strong growth trajectory, expansion prospects for oil and gas seals are expected to remain moderate, with government initiatives actively encouraging a transition towards green energy sources.

Initiatives such as the Renewable Energy Sources Act 2000, the Heat-Power Cogeneration Act 2002 and the Integrated Energy and Climate Programme have made significant strides in reducing the adverse impact of fossil fuels consumption. In 2013, over 146 million tons of CO­2 equivalent emissions were offset due to these initiatives. This is expected to continue in the future, thus rendering penetration of oil & gas seals manufacturers moderate. FMI projects the German market to register an annual growth of over 1% through 2021.

U.K. to Emerge as a Significant Sweet Spot for Oil & Gas Seals Manufacturers

The U.K oil & gas seals market is poised to yield a revenue share exceeding 9% through 2021, according to FMI. A valuation of US$ 21.4 Mn is projected for the region for the current year. Accounting for over 75% of total primary energy needs, the UK oil and gas exploration industry is poised to reach new heights in forthcoming years.

According to Oil & Gas UK, oil and gas provide 97% of transport fuel as well for electricity generation. Furthermore, they are important feedstocks for petrochemical industries producing pharmaceuticals, cosmetics, plastics and domestic appliances. Also, over £ 200 billion have been invested in developing new resources since the past 40 years.

Over the years, numerous cutting-edge exploration technologies have peppered the U.K oil & gas exploration landscape. The region is widely considered a leader in subsea operations and deep underwater experience. Owing to these broad trends, sales of oil & gas seals across the market are expected to widen, generating significant revenue pools through 2031.

The Future of Russia Oil & Gas Seals Market

Perhaps no market is as opportunistic as Russia, which is likely to generate US$ 139.2 Mn in revenue by 2021-end. A value CAGR of nearly 3% is anticipated for the upcoming forecast period. A temporary downswing was experienced amid the pandemic crisis, with initial projections about the oil and gas landscape to prolong until the next half-a-decade. Fortunately, recovery has been better than expected.

The Russian market is highly opportunistic, given the fact that it possesses the world’s largest petroleum industry, comprising of the world’s largest numbers of natural gas reserves. As of 2019, it produced nearly 700 billion cubic meters of natural gas, representing an increase of 10 billion cubic meters since 2018. Moreover, it produces 12% of the world’s oil.

Owing to the presence of immense reserves, numerous oil & gas companies have undertaken exploration projects in recent years. Prominent companies include Rosneft, Gazprom, Lukoil, Surguneftegas, and Tatneft who have initiated various on-shore and off-shore exploration projects. Owing to these trends, oil and gas seal manufacturers are finding significant ground across the country. TREM Engineering is the dominant seal provider, manufacturing mechanical seals for pumps for API applications

Opportunities Abound across China

China is the world’s most populous country, comprising 1.4 billion people as of 2019. It is also the world’s fastest growing economy, rendering it to be the largest energy producer and consumer across the world. As per the Energy Information Administration’s projections, out of the total primary energy consumption mix, approximately 30% of consumption resulted from petroleum and natural gas.

While China was the 5th largest producer of petroleum and other liquids in 2019, majority of its production comes from legacy fields which require expensive enhanced oil recovery techniques to sustain production. Hence, companies are investigating advanced drilling techniques to enhance productivity, which also includes extensive deployment of oil & gas seals, providing traction to the market.

A proliferating automotive market is amongst the key drivers of the Chinese fossil fuels market. Despite the penetration of hybrid and electric vehicles, the popularity of petrol and diesel driven cars is not expected to wane soon, thereby keeping the demand for hydrocarbons afloat in forthcoming years. New-energy vehicles made up 5% of China’s new auto sales in 2020.

Oil and Gas Seals Market

India to Witness Burgeoning Oil & Gas Seals Sales

The oil & gas industry in India is among the eight core industries, playing a pivotal role influencing decision making for other important sectors of the economy, concludes the India Brand Equity Foundation (IBEF). It is expected to be the largest non-OECD petroleum consumption growth engine, with oil refining capacities accounting for 249.9 million metric tons, rendering it the 2nd largest refiner in Asia.

Over the years, key investments by prominent players in oil and gas exploration have multiplied manifold. In November 2020, for instance, JBM, a regional commercial vehicle and auto parts manufacturer inked a MoU with the Ministry of Petroleum and Natural Gas (MoPNG), Government of India, for the development of Compressed Biogas projects.

Likewise, in October 2020, Torrent Gas Ltd. announced its plan to spend Rs. 8,000 crores (US$ 1.1 billion) spanning over the next five years to expand its urban gas operations with the objective of establishing 500 CNG dispensing pumps by 2023. Such important developments are encouraging proliferation of key oil & gas seal manufacturers across the country.

Max Spare Limited is the most prominent oil & gas seals manufacturers across the Indian landscape. The company specializes in rubber elastomers, thermoplastics and thermoplastic elastomers based oil & gas seals. The company has developed high quality thermoplastic elastomers and provides high compatible polyurethane grade seals with superior abrasion and extrusion resistance. 

Category-wise Insights

What’s the Market Share of Plastic/Polymers Oil and Gas Seals?

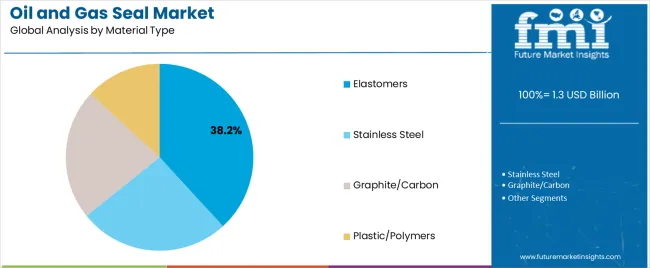
The plastic/polymers segment will continue accounting for more than one third of the global share among material types through the forecast period. According to FMI, the segment is expected to hold nearly 37% of the market, in terms of material type, by the end of 2031. This is due to its product characteristics that make them compatible for all types of applications.

Why are Mechanical Oil & Gas Seals Preferred?

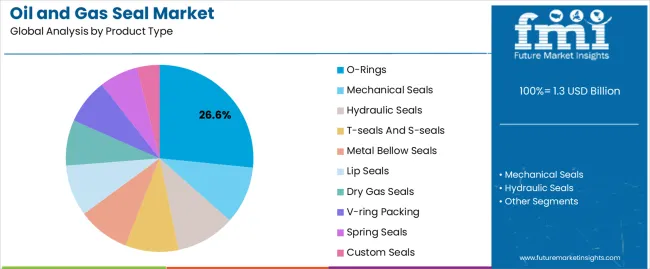
By product type, mechanical seals are expected to account for the highest value, reaching nearly US$ 38 Mn by 2021 end. The segment is poised to yield nearly 17% of the total market revenue. Heightened adoption is largely due to reduced daily maintenance, no damage to pump sleeves or shafts, ensuring a corrosion free atmosphere and preventing dirt accumulation in the extraction machine.

Simultaneously, dry gas seals are expected to gather momentum, reaching almost US$ 35 Mn by the end of the current year. Dry gas seals are non-contacting mechanical seals, which eliminates the problem of seal wear. A typical lifespan of a dry gas seal is as long as 15 years, making them highly durable. Furthermore, they help reduce maintenance and operating costs along with decreased emission levels.

Why Distribution Applications Hold Higher Market Share?

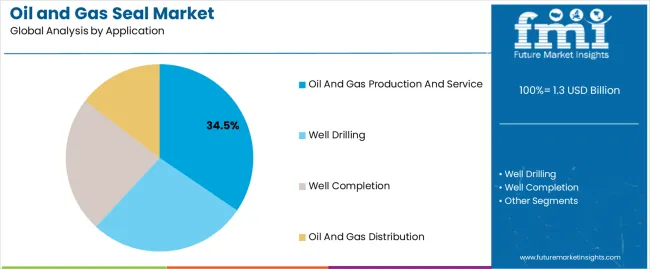
Accounting for over 25% of the overall share through the forecast period, distribution applications drives continue to account for bulk of demand for oil & gas seals. Growth in the segment is primarily due to the rapid development of refining & distillation units along with deployment of transportation pipelines & carrier vessels.

Upstream Exploration Projects to Gain Spotlight

In terms of process, the upstream segment is likely to remain a key revenue engine, expected to generate over 2/5th revenue share throughout the forecast period. Increasing number of upstream oil and gas exploration projects is expected to steer market growth in a positive direction.

Some of the leading upstream projects include the Alaska LNG Liquefaction Plant (US$ 43 billion), Rovuma LNG Project (US$ 33 billion), Al Zour Refinery (US$ 16 billion), South Pars Phases 13-14 (US$ 13 billion), Scarborough Gas Project & Pluto LNG Expansion (US$ 11 billion), Dangote Refinery and Polypropylene Plant (US$ 11 billion) Nord Stream 2 Gas Pipeline (US$ 10.8 billion), Cameron LNG Liquefaction Plant (US$ 10.2 billion), Surat Gas Project (US$ 7.15 billion) and the Trans Adriatic Pipeline (US$ 5.5 billion).

Competitive Landscape

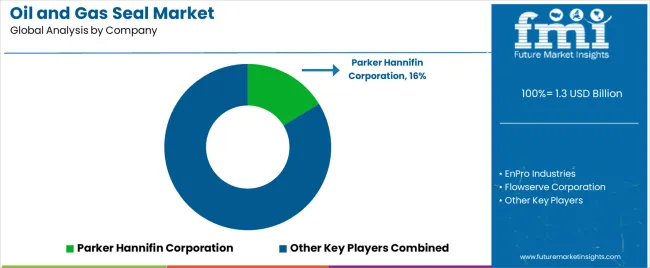
The oil & gas seals market is a highly competitive market dominated by global players offering cost-competitive products. Some of the players are focusing to carve a niche for specific demography. The market is highly consolidated, with key players holding over 75% of the revenue.

It is characterized by large supplier base and strong B2B networks. The market has robust partnerships throughout the value chain. There is ample focus on innovations. Companies operating in the oil & gas seals market are aiming at strategic collaborations with end users and regional distributors to address the requirements of an expanding customer base. Suppliers of oil & gas seals adopt acquisition and regional expansion strategies to establish a foothold.

Brand consciousness and aggressive marketing makes it challenging for new entrants in the oil & gas seals market. Through these developments, companies are aiming at competitive advantage. Furthermore, advent of online sales channel is also expected to create positive growth prospects for the growth in demand for oil & gas seals.

Some of the leading companies operating in the market are:

  • Parker Hannifin Corporation
  • EnPro Industries 
  • Flowserve Corporation 
  • Dätwyler Holding Inc. 
  • Freudenberg Group 
  • John Crane
  • Trelleborg AB 
  • EagleBurgmann 
  • Sinoseal Holding Co., Ltd. 
  • AESSEAL 
  • Hallite Seals 
  • James Walker 
  • NAK Sealing Technologies Corporation 

*The list is not exhaustive, and only for representational purposes. Full competitive intelligence with SWOT analysis available in the report.

Scope of the Report

Attribute Details
Forecast Period 2021 to 2031
Historical Data Available for 2016 to 2020
Market Analysis USD Million for value and Units for Volume
Key Regions Covered North America, Latin America, Europe, East Asia, South Asia & Pacific, Middle East & Africa
Key Countries Covered USA, Canada, Germany, UK, France, Italy, Spain, Russia, China, Japan, South Korea, India, Thailand, Malaysia, Vietnam, Indonesia, Australia, New Zealand, GCC Countries, Turkey, Northern Africa, South Africa
Key Segments Covered Product Type, Material Type, Application, Process Type, and Region
Key Companies Profiled
  • Parker Hannifin Corporation
  • EnPro Industries
  • Flowserve Corporation
  • Dätwyler Holding Inc.
  • Freudenberg Group
  • John Crane
  • Trelleborg AB
  • EagleBurgmann
  • Sinoseal Holding Co., Ltd.
  • AESSEAL
  • Hallite Seals
  • James Walker
  • NAK Sealing Technologies Corporation
Report Coverage Market Forecast, brand share analysis, competition intelligence, DROT analysis, Market Dynamics and Challenges, Strategic Growth Initiatives
Customization & Pricing Available upon Request

Key Segments

Product Type

  • Mechanical Seals
  • Hydraulic Seals
  • O-Rings
  • T-Seals & S-Seals
  • Metal Bellow Seals
  • Lip Seals
  • Dry Gas Seals
  • V-Ring Packing
  • Spring Seals
  • Custom Seals

Application

  • Well Drilling
  • Well Completion
  • Well Production & Service
  • Distribution
    • Refining & Distillation Units
    • Transportation Pipelines & Carrier Vessels

Material Type

  • Stainless Steel
  • Graphite/Carbon
  • Elastomers
  • Plastic/Polymers
    • PTFE
    • PEEK

Process Type

  • Upstream
  • Midstream
  • Downstream

Region

  • North America
  • Latin America
  • Europe
  • East Asia
  • South Asia & Pacific
  • Middle East and Africa (MEA)

Frequently Asked Questions

Q1. Which is the most lucrative market for oil & gas seals?

GCC currently leads the global market for oil & gas seals. Sales in GCC will be over 16% of total demand throughout the forecast period.

Q2. Which are the top-selling oil & gas seals?

T-Seals & S-Seals are highly sought-after for many applications. The demand for T-Seals & S-Seals is expected to remain high in the near future, especially due to its proliferated usage across different application in drilling, refining and distribution.

Q3. Which industry accounts for highest demand for oil & gas seals?

Oil & gas seals are widely used in distribution applications. Their usage in Refining & Distillation Units, and Transportation Pipelines & Carrier Vessels is rising day-by-day.

Q4. Which are some of the leading oil & gas seals manufacturers?

Some of the leading companies manufacturing oil & gas seals are Parker Hannifin Corporation, EnPro Industries, Dätwyler Holding Inc., Freudenberg Group, Trelleborg AB, etc.

Q5. Which material is widely used by oil and gas seals manufacturers?

The seals made from plastic/polymers or elastomers are driving sales of oil & gas seals because they are comparatively economical and durable.

Table of Content

1. Executive Summary

    1.1. Global Market Outlook

    1.2. Demand Side Trends

    1.3. Supply Side Trends

    1.4. Technology Roadmap

    1.5. Analysis and Recommendations

2. Market Overview

    2.1. Market Coverage / Taxonomy

    2.2. Market Definition / Scope / Limitations

3. Key Market Trends

4. Key Success Factors

5. Global Oil & Gas Seals Market Demand Analysis 2016-2020 and Forecast, 2021-2031

    5.1. Historical Market Volume (Units) Analysis, 2016-2020

    5.2. Current and Future Market Volume (Units) Projections, 2021-2031

    5.3. Y-o-Y Growth Trend Analysis

6. Global Oil & Gas Seals Market - Pricing Analysis

    6.1. Pricing Break-up By Product Type

    6.2. Regional Pricing Analysis 

7. Global Oil & Gas Seals Market Demand (in Value or Size in US$ Mn) Analysis 2016-2020 and Forecast, 2021-2031

    7.1. Historical Market Value (US$ Mn) Analysis, 2016-2020

    7.2. Current and Future Market Value (US$ Mn) Projections, 2021-2031

        7.2.1. Y-o-Y Growth Trend Analysis

        7.2.2. Absolute $ Opportunity Analysis

8. Market Background

    8.1. Macro-Economic Factors

        8.1.1. Global Economic Outlook

        8.1.2. GDP Growth Outlook

        8.1.3. Oil & Gas Industry Growth Outlook

        8.1.4. Natural Gas Production & Consumption Overview

        8.1.5. List of Key Oil & Gas Projects

    8.2. Forecast Factors - Relevance & Impact

    8.3. COVID-19 impact Analysis

        8.3.1. Potential Impact

        8.3.2. COVID-19 Impact On Oil & Gas Industry

        8.3.3. Rebound Scenario 

        8.3.4. Potential Impact on the Market

        8.3.5. Key Factors for the Market Participants to Over Come COVID-19 Impact

    8.4. Value Chain Analysis

    8.5. Market Dynamics

        8.5.1. Drivers

        8.5.2. Restraints

        8.5.3. Opportunity Analysis

9. Global Oil & Gas Seals Market Analysis 2016-2020 and Forecast 2021-2031, by Product Type 

    9.1. Introduction / Key Findings

    9.2. Historical Market Size (US$ Mn) and Volume Analysis By Product Type, 2016-2020

    9.3. Current and Future Market Size (US$ Mn) and Volume Analysis and Forecast By Product Type, 2021-2031

        9.3.1. Mechanical Seals

        9.3.2. Hydraulic Seals

        9.3.3. O-Rings

        9.3.4. T-Seals & S-Seals

        9.3.5. Metal Bellow Seals

        9.3.6. Lip Seals

        9.3.7. Dry gas Seals

        9.3.8. V-Ring Packing

        9.3.9. Spring Seals

        9.3.10. Custom Seals

    9.4. Market Attractiveness Analysis By Product Type

10. Global Oil & Gas Seals Market Analysis 2016-2020 and Forecast 2021-2031, By Application 

    10.1. Introduction / Key Findings

    10.2. Historical Market Size (US$ Mn) and Volume Analysis By Application, 2016-2020

    10.3. Current and Future Market Size (US$ Mn) and Volume Analysis and Forecast By Application, 2021-2031

        10.3.1. Well Drilling

        10.3.2. Well Completion

        10.3.3. Well Production & Services

        10.3.4. Distribution

            10.3.4.1. Refining & Distillation Units

            10.3.4.2. Transportation Pipelines & Carrier Vessels

    10.4.  Market Attractiveness Analysis By Product Type

11. Global Oil & Gas Seals Market Analysis 2016-2020 and Forecast 2021-2031, by Material Type 

    11.1. Introduction / Key Findings

    11.2. Historical Market Size (US$ Mn) and Volume Analysis By Material Type, 2016-2020

    11.3. Current and Future Market Size (US$ Mn) and Volume Analysis and Forecast By Material Type, 2021-2031

        11.3.1. Stainless Steel

        11.3.2. Graphite/Carbon

        11.3.3. Elastomers

        11.3.4. Plastic/ Polymers

            11.3.4.1. PTFE

            11.3.4.2. PEEK

    11.4. Market Attractiveness Analysis By Material Type

12. Global Oil & Gas Seals Market Analysis 2016-2020 and Forecast 2021-2031, by Process

    12.1. Introduction / Key Findings

    12.2. Historical Market Size (US$ Mn) and Volume Analysis By Process, 2016-2020

    12.3. Current and Future Market Size (US$ Mn) and Volume Analysis and Forecast By Process, 2021-2031

        12.3.1. Upstream

        12.3.2. Midstream

        12.3.3. Downstream 

    12.4. Market Attractiveness Analysis By Material Type

13. Global Oil & Gas Seals Market Analysis 2016-2020 and Forecast 2021-2031, by Region

    13.1. Introduction

    13.2. Historical Market Size (US$ Mn) and Volume Analysis By Region, 2016-2020

    13.3. Current Market Size (US$ Mn) and Volume Analysis and Forecast By Region, 2021-2031

        13.3.1. North America

        13.3.2. Latin America

        13.3.3. Europe

        13.3.4. East Asia

        13.3.5. South Asia & Pacific

        13.3.6. Middle East & Africa

    13.4. Market Attractiveness Analysis By Region

14. North America Oil & Gas Seals Market Analysis 2016-2020 and Forecast 2021-2031

    14.1. Introduction

    14.2. Pricing Analysis

    14.3. Historical Market Size (US$ Mn) and Volume Trend Analysis By Market Taxonomy, 2016-2020

    14.4. Market Size (US$ Mn) and Volume Forecast By Market Taxonomy, 2021-2031

        14.4.1. By Product Type

        14.4.2. By Application

        14.4.3. By Material Type

        14.4.4. By Process

        14.4.5. By Country

            14.4.5.1. U.S.

            14.4.5.2. Canada

    14.5. Market Attractiveness Analysis

        14.5.1. By Product Type

        14.5.2. By Application

        14.5.3. By Material Type

        14.5.4. By Process

        14.5.5. By Country

15. Latin America Oil & Gas Seals Market Analysis 2016-2020 and Forecast 2021-2031

    15.1. Introduction

    15.2. Pricing Analysis

    15.3. Historical Market Size (US$ Mn) and Volume Trend Analysis By Market Taxonomy, 2016-2020

    15.4. Market Size (US$ Mn) and Volume Forecast By Market Taxonomy, 2021-2031

        15.4.1. By Product Type

        15.4.2. By Application

        15.4.3. By Material Type

        15.4.4. By Process

        15.4.5. By Country

            15.4.5.1. Brazil

            15.4.5.2. Mexico

            15.4.5.3. Rest of Latin America

    15.5. Market Attractiveness Analysis

        15.5.1. By Product Type

        15.5.2. By Application

        15.5.3. By Material Type

        15.5.4. By Process

        15.5.5. By Country

16. Europe Oil & Gas Seals Market Analysis 2016-2020 and Forecast 2021-2031

    16.1. Introduction

    16.2. Pricing Analysis

    16.3. Historical Market Size (US$ Mn) and Volume Trend Analysis By Market Taxonomy, 2016-2020

    16.4. Market Size (US$ Mn) and Volume Forecast By Market Taxonomy, 2021-2031

        16.4.1. By Product Type

        16.4.2. By Application

        16.4.3. By Material Type

        16.4.4. By Process

        16.4.5. By Country

            16.4.5.1. Germany

            16.4.5.2. Italy

            16.4.5.3. France

            16.4.5.4. U.K.

            16.4.5.5. Spain

            16.4.5.6. NORDICS

            16.4.5.7. Russia

            16.4.5.8. Rest of Europe

    16.5. Market Attractiveness Analysis

        16.5.1. By Product Type

        16.5.2. By Application

        16.5.3. By Material Type

        16.5.4. By Process

        16.5.5. By Country

17. South Asia & Pacific Oil & Gas Seals Market Analysis 2016-2020 and Forecast 2021-2031

    17.1. Introduction

    17.2. Pricing Analysis

    17.3. Historical Market Size (US$ Mn) and Volume Trend Analysis By Market Taxonomy, 2016-2020

    17.4. Market Size (US$ Mn) and Volume Forecast By Market Taxonomy, 2021-2031

        17.4.1. By Product Type

        17.4.2. By Application

        17.4.3. By Material Type

        17.4.4. By Process

        17.4.5. By Country

            17.4.5.1. India

            17.4.5.2. ASEAN

            17.4.5.3. Australia

            17.4.5.4. Rest of South Asia & Pacific

    17.5. Market Attractiveness Analysis

        17.5.1. By Product Type

        17.5.2. By Application

        17.5.3. By Material Type

        17.5.4. By Process

        17.5.5. By Country

18. East Asia Oil & Gas Seals Market Analysis 2016-2020 and Forecast 2021-2031

    18.1. Introduction

    18.2. Pricing Analysis

    18.3. Historical Market Size (US$ Mn) and Volume Trend Analysis By Market Taxonomy, 2016-2020

    18.4. Market Size (US$ Mn) and Volume Forecast By Market Taxonomy, 2021-2031

        18.4.1. By Product Type

        18.4.2. By Application

        18.4.3. By Material Type

        18.4.4. By Process

        18.4.5. By Country

            18.4.5.1. China

            18.4.5.2. Japan 

            18.4.5.3. South Korea 

    18.5. Market Attractiveness Analysis

        18.5.1. By Product Type

        18.5.2. By Application

        18.5.3. By Material Type

        18.5.4. By Process

        18.5.5. By Country

19. Middle East and Africa Oil & Gas Seals Market Analysis 2016-2020 and Forecast 2021-2031

    19.1. Introduction

    19.2. Pricing Analysis

    19.3. Historical Market Size (US$ Mn) and Volume Trend Analysis By Market Taxonomy, 2016-2020

    19.4. Market Size (US$ Mn) and Volume Forecast By Market Taxonomy, 2021-2031

        19.4.1. By Product Type

        19.4.2. By Application

        19.4.3. By Material Type

        19.4.4. By Process

        19.4.5. By Country

            19.4.5.1. GCC Countries

            19.4.5.2. Turkey

            19.4.5.3. Iran

            19.4.5.4. Northern Africa

            19.4.5.5. South Africa

            19.4.5.6. Rest of Middle East and Africa

    19.5. Market Attractiveness Analysis

        19.5.1. By Product Type

        19.5.2. By Application

        19.5.3. By Material Type

        19.5.4. By Process

        19.5.5. By Country

20. Key and Emerging Countries Oil & Gas Seals Market Analysis 

    20.1. U.S. Oil & Gas Seals Market Analysis

        20.1.1. By Product Type

        20.1.2. By Application

        20.1.3. By Material Type

        20.1.4. By Process

    20.2. Canada Oil & Gas Seals Market Analysis

        20.2.1. By Product Type

        20.2.2. By Application

        20.2.3. By Material Type

        20.2.4. By Process

    20.3. Mexico Oil & Gas Seals Market Analysis

        20.3.1. By Product Type

        20.3.2. By Application

        20.3.3. By Material Type

        20.3.4. By Process

    20.4. Brazil Oil & Gas Seals Market Analysis

        20.4.1. By Product Type

        20.4.2. By Application

        20.4.3. By Material Type

        20.4.4. By Process

    20.5. Germany Oil & Gas Seals Market Analysis

        20.5.1. By Product Type

        20.5.2. By Application

        20.5.3. By Material Type

        20.5.4. By Process

    20.6. Italy Oil & Gas Seals Market Analysis

        20.6.1. By Product Type

        20.6.2. By Application

        20.6.3. By Material Type

        20.6.4. By Process

    20.7. France Oil & Gas Seals Market Analysis

        20.7.1. By Product Type

        20.7.2. By Application

        20.7.3. By Material Type

        20.7.4. By Process

    20.8. U.K. Oil & Gas Seals Market Analysis

        20.8.1. By Product Type

        20.8.2. By Application

        20.8.3. By Material Type

        20.8.4. By Process

    20.9. Spain Oil & Gas Seals Market Analysis

        20.9.1. By Product Type

        20.9.2. By Application

        20.9.3. By Material Type

        20.9.4. By Process

    20.10. Russia Oil & Gas Seals Market Analysis

        20.10.1. By Product Type

        20.10.2. By Application

        20.10.3. By Material Type

        20.10.4. By Process

    20.11. China Oil & Gas Seals Market Analysis

        20.11.1. By Product Type

        20.11.2. By Application

        20.11.3. By Material Type

        20.11.4. By Process

    20.12. Japan Oil & Gas Seals Market Analysis

        20.12.1. By Product Type

        20.12.2. By Application

        20.12.3. By Material Type

        20.12.4. By Process

    20.13. South Korea Oil & Gas Seals Market Analysis

        20.13.1. By Product Type

        20.13.2. By Application

        20.13.3. By Material Type

        20.13.4. By Process

    20.14. India Oil & Gas Seals Market Analysis

        20.14.1. By Product Type

        20.14.2. By Application

        20.14.3. By Material Type

        20.14.4. By Process

    20.15. ASEAN Oil & Gas Seals Market Analysis

        20.15.1. By Product Type

        20.15.2. By Application

        20.15.3. By Material Type

        20.15.4. By Process

    20.16. Oceania Oil & Gas Seals Market Analysis

        20.16.1. By Product Type

        20.16.2. By Application

        20.16.3. By Material Type

        20.16.4. By Process

    20.17. GCC Countries Oil & Gas Seals Market Analysis

        20.17.1. By Product Type

        20.17.2. By Application

        20.17.3. By Material Type

        20.17.4. By Process

    20.18. Turkey Oil & Gas Seals Market Analysis

        20.18.1. By Product Type

        20.18.2. By Application

        20.18.3. By Material Type

        20.18.4. By Process

    20.19. Northern Africa Oil & Gas Seals Market Analysis

        20.19.1. By Product Type

        20.19.2. By Application

        20.19.3. By Material Type

        20.19.4. By Process 

    20.20. South Africa Oil & Gas Seals Market Analysis

        20.20.1. By Product Type

        20.20.2. By Application

        20.20.3. By Material Type

        20.20.4. By Process

21. Market Structure Analysis

    21.1. Key Players – Market Positioning

    21.2. Market Analysis by Tier of Companies (Oil & Gas Seals)

    21.3. Market Share Analysis of Top Players

    21.4. Market Presence Analysis

        21.4.1. By Regional footprint of Players

        21.4.2. Product foot print by Players

22. Competition Analysis

    22.1. Competition Dashboard

    22.2. Competition Deep Dive 

        22.2.1. Parker Hannifin Corporation

            22.2.1.1. Overview

            22.2.1.2. Product Portfolio

            22.2.1.3. Profitability by Market Segments (Product/ Region)

            22.2.1.4. Strategy Overview

        22.2.2. Trelleborg AB

            22.2.2.1. Overview

            22.2.2.2. Product Portfolio

            22.2.2.3. Profitability by Market Segments (Product/ Region)

            22.2.2.4. Strategy Overview

        22.2.3. EagleBurgmann

            22.2.3.1. Overview

            22.2.3.2. Product Portfolio

            22.2.3.3. Profitability by Market Segments (Product/ Region)

            22.2.3.4. Strategy Overview

        22.2.4. James Walker & Co.

            22.2.4.1. Overview

            22.2.4.2. Product Portfolio

            22.2.4.3. Profitability by Market Segments (Product/ Region)

            22.2.4.4. Strategy Overview

        22.2.5. Freudenberg Group

            22.2.5.1. Overview

            22.2.5.2. Product Portfolio

            22.2.5.3. Profitability by Market Segments (Product/ Region)

            22.2.5.4. Strategy Overview

        22.2.6. John Crane

            22.2.6.1. Overview

            22.2.6.2. Product Portfolio

            22.2.6.3. Profitability by Market Segments (Product/ Region)

            22.2.6.4. Strategy Overview

        22.2.7. Flowserve Corporation

            22.2.7.1. Overview

            22.2.7.2. Product Portfolio

            22.2.7.3. Profitability by Market Segments (Product/ Region)

            22.2.7.4. Strategy Overview

        22.2.8. AESSEAL

            22.2.8.1. Overview

            22.2.8.2. Product Portfolio

            22.2.8.3. Profitability by Market Segments (Product/ Region)

            22.2.8.4. Strategy Overview

        22.2.9. Technetics Group

            22.2.9.1. Overview

            22.2.9.2. Product Portfolio

            22.2.9.3. Profitability by Market Segments (Product/ Region)

            22.2.9.4. Strategy Overview

        22.2.10. TREM Engineering SC

            22.2.10.1. Overview

            22.2.10.2. Product Portfolio

            22.2.10.3. Profitability by Market Segments (Product/ Region)

            22.2.10.4. Strategy Overview

        22.2.11. Suebel Seals Belgium

            22.2.11.1. Overview

            22.2.11.2. Product Portfolio

            22.2.11.3. Profitability by Market Segments (Product/ Region)

            22.2.11.4. Strategy Overview

        22.2.12. Durlon

            22.2.12.1. Overview

            22.2.12.2. Product Portfolio

            22.2.12.3. Profitability by Market Segments (Product/ Region)

            22.2.12.4. Strategy Overview

        22.2.13. Sinoseal Holding Co., Ltd.

            22.2.13.1. Overview

            22.2.13.2. Product Portfolio

            22.2.13.3. Profitability by Market Segments (Product/ Region)

            22.2.13.4. Strategy Overview

        22.2.14. Sealmatic

            22.2.14.1. Overview

            22.2.14.2. Product Portfolio

            22.2.14.3. Profitability by Market Segments (Product/ Region)

            22.2.14.4. Strategy Overview

        22.2.15. STB GmbH

            22.2.15.1. Overview

            22.2.15.2. Product Portfolio

            22.2.15.3. Profitability by Market Segments (Product/ Region)

            22.2.15.4. Strategy Overview

        22.2.16. Angst+Pfister

            22.2.16.1. Overview

            22.2.16.2. Product Portfolio

            22.2.16.3. Profitability by Market Segments (Product/ Region)

            22.2.16.4. Strategy Overview

        22.2.17. Dätwyler Holding Inc.

            22.2.17.1. Overview

            22.2.17.2. Product Portfolio

            22.2.17.3. Profitability by Market Segments (Product/ Region)

            22.2.17.4. Strategy Overview

        22.2.18. EnPro Industries

            22.2.18.1. Overview

            22.2.18.2. Product Portfolio

            22.2.18.3. Profitability by Market Segments (Product/ Region)

            22.2.18.4. Strategy Overview

        22.2.19. Hallite Seals

            22.2.19.1. Overview

            22.2.19.2. Product Portfolio

            22.2.19.3. Profitability by Market Segments (Product/ Region)

            22.2.19.4. Strategy Overview

        22.2.20. NAK Sealing Technologies Corporation

            22.2.20.1. Overview

            22.2.20.2. Product Portfolio

            22.2.20.3. Profitability by Market Segments (Product/ Region)

            22.2.20.4. Strategy Overview

        22.2.21. Ningbo Sunwell Sealing Materials Co., Ltd.

            22.2.21.1. Overview

            22.2.21.2. Product Portfolio

            22.2.21.3. Profitability by Market Segments (Product/ Region)

            22.2.21.4. Strategy Overview

        22.2.22. YALAN Seals Ltd.

            22.2.22.1. Overview

            22.2.22.2. Product Portfolio

            22.2.22.3. Profitability by Market Segments (Product/ Region)

            22.2.22.4. Strategy Overview

        22.2.23. Max Spare Limited

            22.2.23.1. Overview

            22.2.23.2. Product Portfolio

            22.2.23.3. Profitability by Market Segments (Product/ Region)

            22.2.23.4. Strategy Overview

23. Assumptions and Acronyms Used

24. Research Methodology

Don't pay for what you don't need

Customize your report by selecting specific countries or regions and save 30%!

List of Tables

Table 01: Global Oil & Gas Seals Market Value (US$ Mn) & Volume (Units) Historical Data 2016-2020 and Forecast 2021-2031 by Product Type

Table 02: Global Oil & Gas Seals Market Value (US$ Mn) & Volume (Units) Historical Data 2016-2020 and Forecast 2021-2031 by Product Type

Table 03: Global Oil & Gas Seals Market Value (US$ Mn) & Volume (Units) Historical Data 2016-2020 and Forecast 2021-2031 by Application

Table 04: Global Oil & Gas Seals Market Value (US$ Mn) & Volume (Units) Historical Data 2016-2020 and Forecast 2021-2031 by Material Type

Table 05: Global Oil & Gas Seals Market Value (US$ Mn) & Volume (Units) Historical Data 2016-2020 and Forecast 2021-2031 by Process

Table 06: Global Oil & Gas Seals Market Value (US$ Mn) & Volume (Units) Historical Data 2016-2020 and Forecast 2021-2031 by Region

Table 07: North America Oil & Gas Seals Market Value (US$ Mn) & Volume (Units) Historical Data 2016-2020 and Forecast 2021-2031 by Product Type

Table 08: North America Oil & Gas Seals Market Value (US$ Mn) & Volume (Units) Historical Data 2016-2020 and Forecast 2021-2031 by Product Type

Table 09: North America Oil & Gas Seals Market Value (US$ Mn) & Volume (Units) Historical Data 2016-2020 and Forecast 2021-2031 by Application

Table 10: North America Oil & Gas Seals Market Value (US$ Mn) & Volume (Units) Historical Data 2016-2020 and Forecast 2021-2031 by Material Type

Table 11: North America Oil & Gas Seals Market Value (US$ Mn) & Volume (Units) Historical Data 2016-2020 and Forecast 2021-2031 by Process

Table 12: North America Oil & Gas Seals Market Value (US$ Mn) & Volume (Units) Historical Data 2016-2020 and Forecast 2021-2031 by Country

Table 13: Latin America Oil & Gas Seals Market Value (US$ Mn) & Volume (Units) Historical Data 2016-2020 and Forecast 2021-2031 by Product Type

Table 14: Latin America Oil & Gas Seals Market Value (US$ Mn) & Volume (Units) Historical Data 2016-2020 and Forecast 2021-2031 by Product Type

Table 15: Latin America Oil & Gas Seals Market Value (US$ Mn) & Volume (Units) Historical Data 2016-2020 and Forecast 2021-2031 by Application

Table 16: Latin America Oil & Gas Seals Market Value (US$ Mn) & Volume (Units) Historical Data 2016-2020 and Forecast 2021-2031 by Material Type

Table 17: Latin America Oil & Gas Seals Market Value (US$ Mn) & Volume (Units) Historical Data 2016-2020 and Forecast 2021-2031 by Process

Table 18: Latin America Oil & Gas Seals Market Value (US$ Mn) & Volume (Units)  Historical Data 2016-2020 and Forecast 2021-2031 by Country

Table 19: Europe Oil & Gas Seals Market Value (US$ Mn) & Volume (Units) Historical Data 2016-2020 and Forecast 2021-2031 by Product Type

Table 20: Europe Oil & Gas Seals Market Value (US$ Mn) & Volume (Units) Historical Data 2016-2020 and Forecast 2021-2031 by Product Type

Table 21: Europe Oil & Gas Seals Market Value (US$ Mn) & Volume (Units) Historical Data 2016-2020 and Forecast 2021-2031 by Application

Table 22: Europe Oil & Gas Seals Market Value (US$ Mn) & Volume (Units) Historical Data 2016-2020 and Forecast 2021-2031 by Material Type

Table 23: Europe Oil & Gas Seals Market Value (US$ Mn) & Volume (Units) Historical Data 2016-2020 and Forecast 2021-2031 by Process

Table 24: Europe Oil & Gas Seals Market Volume (Units) Historical Data 2016-2020 and Forecast 2021-2031 by Country

Table 25: South Asia and Pacific Oil & Gas Seals Market Value (US$ Mn) & Volume (Units) Historical Data 2016-2020 and Forecast 2021-2031 by Product Type

Table 26: South Asia and Pacific Oil & Gas Seals Market Value (US$ Mn) & Volume (Units) Historical Data 2016-2020 and Forecast 2021-2031 by Product Type

Table 27: South Asia and Pacific Oil & Gas Seals Market Value (US$ Mn) & Volume (Units) Historical Data 2016-2020 and Forecast 2021-2031 by Application

Table 28: South Asia and Pacific Oil & Gas Seals Market Value (US$ Mn) & Volume (Units) Historical Data 2016-2020 and Forecast 2021-2031 by Material Type

Table 29: South Asia and Pacific Oil & Gas Seals Market Value (US$ Mn) & Volume (Units) Historical Data 2016-2020 and Forecast 2021-2031 by Process

Table 30: South Asia & Pacific Oil & Gas Seals Market Value (US$ Mn) & Volume (Units) Historical Data 2016-2020 and Forecast 2021-2031 by Country

Table 31: East Asia Oil & Gas Seals Market Value (US$ Mn) & Volume (Units) Historical Data 2016-2020 and Forecast 2021-2031 by Product Type

Table 32: East Asia Oil & Gas Seals Market Value (US$ Mn) & Volume (Units) Historical Data 2016-2020 and Forecast 2021-2031 by Product Type

Table 33: East Asia Oil & Gas Seals Market Value (US$ Mn) & Volume (Units) Historical Data 2016-2020 and Forecast 2021-2031 by Application

Table 34: East Asia Oil & Gas Seals Market Value (US$ Mn) & Volume (Units) Historical Data 2016-2020 and Forecast 2021-2031 by Material Type

Table 35: East Asia Oil & Gas Seals Market Value (US$ Mn) & Volume (Units) Historical Data 2016-2020 and Forecast 2021-2031 by Process

Table 36: East Asia Oil & Gas Seals Market Value (US$ Mn) & Volume (Units) Historical Data 2016-2020 and Forecast 2021-2031 by Country

Table 37: Middle East & Africa Oil & Gas Seals Market Value (US$ Mn) & Volume (Units) Historical Data 2016-2020 and Forecast 2021-2031 by Product Type

Table 38: Middle East & Africa Oil & Gas Seals Market Value (US$ Mn) & Volume (Units) Historical Data 2016-2020 and Forecast 2021-2031 by Product Type

Table 39: Middle East & Africa Oil & Gas Seals Market Value (US$ Mn) & Volume (Units) Historical Data 2016-2020 and Forecast 2021-2031 by Application

Table 40: Middle East & Africa Oil & Gas Seals Market Value (US$ Mn) & Volume (Units) Historical Data 2016-2020 and Forecast 2021-2031 by Material Type

Table 41: Middle East & Africa Oil & Gas Seals Market Value (US$ Mn) & Volume (Units) Historical Data 2016-2020 and Forecast 2021-2031 by Process

Table 42: Middle East & Africa Oil & Gas Seals Market Value (US$ Mn) & Volume (Units) Historical Data 2016-2020 and Forecast 2021-2031 by Country
Nikhil Kaitwade
Nikhil Kaitwade

Principal Consultant

Talk to Analyst

Find your sweet spots for generating winning opportunities in this market.

List of Charts

Figure 01: Global Oil & Gas Seals Market Volume (Units) and Y-o-Y Growth Rate From 2021-2031

Figure 02: Global Oil & Gas Seals Market Value (US$ Mn) and Y-o-Y Growth Rate From 2021-2031

Figure 03: Global Oil & Gas Seals Market Value BPS Analysis by Product Type – 2021 & 2031

Figure 04: Global Oil & Gas Seals Market Y-o-Y Growth (%) by Product Type, 2021-2031

Figure 05: Global Oil & Gas Seals Market Attractiveness Analysis by Product Type, 2021-2031

Figure 06: Global Oil & Gas Seals Market Incremental $ Opportunity by Product Type, 2021-2031

Figure 07: Global Oil & Gas Seals Market Value BPS Analysis by Application– 2021 & 2031

Figure 08: Global Oil & Gas Seals Market Y-o-Y Growth (%) by Application, 2021-2031

Figure 09: Global Oil & Gas Seals Market Attractiveness Analysis by Application, 2021-2031

Figure 10: Global Oil & Gas Seals Market Incremental $ Opportunity by Application, 2021-2031

Figure 11: Global Oil & Gas Seals Market Value BPS Analysis by Material Type– 2021 & 2031

Figure 12: Global Oil & Gas Seals Market Y-o-Y Growth (%) by Material Type, 2021-2031

Figure 13: Global Oil & Gas Seals Market Attractiveness Analysis by Material Type, 2021-2031

Figure 14: Global Oil & Gas Seals Market Incremental $ Opportunity by Material Type, 2021-2031

Figure 15: Global Oil & Gas Seals Market Value BPS Analysis by Process– 2021 & 2031

Figure 16: Global Oil & Gas Seals Market Y-o-Y Growth (%) by Process, 2021-2031

Figure 17: Global Oil & Gas Seals Market Attractiveness Analysis by Process, 2021-2031

Figure 18: Global Oil & Gas Seals Market Incremental $ Opportunity by Process, 2021-2031

Figure 19: Global Oil & Gas Seals Market Value BPS Analysis by Region – 2021 & 2031

Figure 20: Global Oil & Gas Seals Market Y-o-Y Growth (%) by Region, 2021-2031

Figure 21: Global Oil & Gas Seals Market Attractiveness Analysis by Region, 2021-2031

Figure 22: Global Oil & Gas Seals Market Incremental $ Opportunity by Region, 2021-2031

Figure 23: North America Oil & Gas Seals Market Value BPS Analysis by Product Type – 2021 & 2031

Figure 24: North America Oil & Gas Seals Market Y-o-Y Growth (%) by Product Type, 2021-2031

Figure 25: North America Oil & Gas Seals Market Attractiveness Analysis by Product Type, 2021-2031

Figure 26: North America Oil & Gas Seals Market Value BPS Analysis by Application– 2021 & 2031

Figure 27: North America Oil & Gas Seals Market Y-o-Y Growth (%) by Application, 2021-2031

Figure 28: North America Oil & Gas Seals Market Attractiveness Analysis by Application, 2021-2031

Figure 29: North America Oil & Gas Seals Market Value BPS Analysis by Material Type– 2021 & 2031

Figure 30: North America Oil & Gas Seals Market Y-o-Y Growth (%) by Material Type, 2021-2031

Figure 31: North America Oil & Gas Seals Market Attractiveness Analysis by Material Type, 2021-2031

Figure 32: North America Oil & Gas Seals Market Value BPS Analysis by Process– 2021 & 2031

Figure 33: North America Oil & Gas Seals Market Y-o-Y Growth (%) by Process, 2021-2031

Figure 34: North America Oil & Gas Seals Market Attractiveness Analysis by Process, 2021-2031

Figure 35: North America Oil & Gas Seals Market Share and BPS Analysis by Country - 2021 & 2031

Figure 36: North America Oil & Gas Seals Market Y-o-Y Growth by Country, 2021-2031

Figure 37: North America Oil & Gas Seals Market Attractiveness Analysis by Country, 2021-2031

Figure 38: North America Market Incremental $ Opportunity by Country, 2021-2031

Figure 39: Latin America Oil & Gas Seals Market Value BPS Analysis by Product Type – 2021 & 2031

Figure 40: Latin America Oil & Gas Seals Market Y-o-Y Growth (%) by Product Type, 2021-2031

Figure 41: Latin America Oil & Gas Seals Market Attractiveness Analysis by Product Type, 2021-2031

Figure 42: Latin America Oil & Gas Seals Market Value BPS Analysis by Application– 2021 & 2031

Figure 43: Latin America Oil & Gas Seals Market Y-o-Y Growth (%) by Application, 2021-2031

Figure 44: Latin America Oil & Gas Seals Market Attractiveness Analysis by Application, 2021-2031

Figure 45: Latin America Oil & Gas Seals Market Value BPS Analysis by Material Type– 2021 & 2031

Figure 46: Latin America Oil & Gas Seals Market Y-o-Y Growth (%) by Material Type, 2021-2031

Figure 47: Latin America Oil & Gas Seals Market Attractiveness Analysis by Material Type, 2021-2031

Figure 48: Latin America Oil & Gas Seals Market Value BPS Analysis by Process– 2021 & 2031

Figure 49: Latin America Oil & Gas Seals Market Y-o-Y Growth (%) by Process, 2021-2031

Figure 50: Latin America Oil & Gas Seals Market Attractiveness Analysis by Process, 2021-2031

Figure 51: Latin America Oil & Gas Seals Market Share and BPS Analysis by Country - 2021 & 2031

Figure 52: Latin America Oil & Gas Seals Market Y-o-Y Growth by Country, 2021-2031

Figure 53: Latin America Oil & Gas Seals Market Attractiveness Analysis by Country, 2021-2031

Figure 54: Latin America Oil & Gas Seals Market Incremental $ Opportunity by Country, 2021-2031

Figure 55: Europe Oil & Gas Seals Market Value BPS Analysis by Product Type – 2021 & 2031

Figure 56: Europe Oil & Gas Seals Market Y-o-Y Growth (%) by Product Type, 2021-2031

Figure 57: Europe Oil & Gas Seals Market Attractiveness Analysis by Product Type, 2021-2031

Figure 58: Europe Oil & Gas Seals Market Value BPS Analysis by Application– 2021 & 2031

Figure 59: Europe Oil & Gas Seals Market Y-o-Y Growth (%) by Application, 2021-2031

Figure 60: Europe Oil & Gas Seals Market Attractiveness Analysis by Application, 2021-2031

Figure 61: Europe Oil & Gas Seals Market Value BPS Analysis by Material Type– 2021 & 2031

Figure 62: Europe Oil & Gas Seals Market Y-o-Y Growth (%) by Material Type, 2021-2031

Figure 63: Europe Oil & Gas Seals Market Attractiveness Analysis by Material Type, 2021-2031

Figure 64: Europe Oil & Gas Seals Market Value BPS Analysis by Process– 2021 & 2031

Figure 65: Europe Oil & Gas Seals Market Y-o-Y Growth (%) by Process, 2021-2031

Figure 66: Europe Oil & Gas Seals Market Attractiveness Analysis by Process, 2021-2031

Figure 67: Europe Oil & Gas Seals Market Share and BPS Analysis by Country - 2021 & 2031

Figure 68: Europe Oil & Gas Seals Market Y-o-Y Growth by Country, 2021-2031

Figure 69: Europe Oil & Gas Seals Market Attractiveness Analysis by Country, 2021-2031

Figure 70: Europe Oil & Gas Seals Market Incremental $ Opportunity by Country, 2021-2031

Figure 71: South Asia and Pacific Oil & Gas Seals Market Value BPS Analysis by Product Type – 2021 & 2031

Figure 72: South Asia and Pacific Oil & Gas Seals Market Y-o-Y Growth (%) by Product Type, 2021-2031

Figure 73: South Asia and Pacific Oil & Gas Seals Market Attractiveness Analysis by Product Type, 2021-2031

Figure 74: South Asia and Pacific Oil & Gas Seals Market Value BPS Analysis by Application– 2021 & 2031

Figure 75: South Asia and Pacific Oil & Gas Seals Market Y-o-Y Growth (%) by Application, 2021-2031

Figure 76: South Asia and Pacific Oil & Gas Seals Market Attractiveness Analysis by Application, 2021-2031

Figure 77: South Asia and Pacific Oil & Gas Seals Market Value BPS Analysis by Material Type– 2021 & 2031

Figure 78: South Asia and Pacific Oil & Gas Seals Market Y-o-Y Growth (%) by Material Type, 2021-2031

Figure 79: South Asia and Pacific Oil & Gas Seals Market Attractiveness Analysis by Material Type, 2021-2031

Figure 80: South Asia and Pacific Oil & Gas Seals Market Value BPS Analysis by Process– 2021 & 2031

Figure 81: South Asia and Pacific Oil & Gas Seals Market Y-o-Y Growth (%) by Process, 2021-2031

Figure 82: South Asia and Pacific Oil & Gas Seals Market Attractiveness Analysis by Process, 2021-2031

Figure 83: South Asia & Pacific Oil & Gas Seals Market Share and BPS Analysis by Country - 2021 & 2031

Figure 84: South Asia & Pacific Oil & Gas Seals Market Y-o-Y Growth by Country, 2021-2031

Figure 85: South Asia & Pacific Oil & Gas Seals Market Attractiveness Analysis by Country, 2021-2031

Figure 86: South Asia & Pacific Oil & Gas Seals Market Incremental $ Opportunity by Country, 2021-2031

Figure 87: East Asia Oil & Gas Seals Market Value BPS Analysis by Product Type – 2021 & 2031

Figure 88: East Asia Oil & Gas Seals Market Y-o-Y Growth (%) by Product Type, 2021-2031

Figure 89: East Asia Oil & Gas Seals Market Attractiveness Analysis by Product Type, 2021-2031

Figure 90: East Asia Oil & Gas Seals Market Value BPS Analysis by Application– 2021 & 2031

Figure 91: East Asia Oil & Gas Seals Market Y-o-Y Growth (%) by Application, 2021-2031

Figure 92: East Asia Oil & Gas Seals Market Attractiveness Analysis by Application, 2021-2031

Figure 93: East Asia Oil & Gas Seals Market Value BPS Analysis by Material Type– 2021 & 2031

Figure 94: East Asia Oil & Gas Seals Market Y-o-Y Growth (%) by Material Type, 2021-2031

Figure 95: East Asia Oil & Gas Seals Market Attractiveness Analysis by Material Type, 2021-2031

Figure 96: East Asia Oil & Gas Seals Market Value BPS Analysis by Process– 2021 & 2031

Figure 97: East Asia Oil & Gas Seals Market Y-o-Y Growth (%) by Process, 2021-2031

Figure 98: East Asia Oil & Gas Seals Market Attractiveness Analysis by Process, 2021-2031

Figure 99: East Asia Oil & Gas Seals Market Share and BPS Analysis by Country - 2021 & 2031

Figure 100: East Asia Oil & Gas Seals Market Y-o-Y Growth by Country, 2021-2031

Figure 101: East Asia Oil & Gas Seals Market Attractiveness Analysis by Country, 2021-2031

Figure 102: East Asia Oil & Gas Seals Market Incremental $ Opportunity by Country, 2021-2031

Figure 103: Middle East & Africa Oil & Gas Seals Market Value BPS Analysis by Product Type – 2021 & 2031

Figure 104: Middle East & Africa Oil & Gas Seals Market Y-o-Y Growth (%) by Product Type, 2021-2031

Figure 105: Middle East & Africa Oil & Gas Seals Market Attractiveness Analysis by Product Type, 2021-2031

Figure 106: Middle East & Africa Oil & Gas Seals Market Value BPS Analysis by Application– 2021 & 2031

Figure 107: Middle East & Africa Oil & Gas Seals Market Y-o-Y Growth (%) by Application, 2021-2031

Figure 108: Middle East & Africa Oil & Gas Seals Market Attractiveness Analysis by Application, 2021-2031

Figure 109: Middle East & Africa Oil & Gas Seals Market Value BPS Analysis by Material Type– 2021 & 2031

Figure 110: Middle East & Africa Oil & Gas Seals Market Y-o-Y Growth (%) by Material Type, 2021-2031

Figure 111: Middle East & Africa Oil & Gas Seals Market Attractiveness Analysis by Material Type, 2021-2031

Figure 112: Middle East & Africa Oil & Gas Seals Market Value BPS Analysis by Process– 2021 & 2031

Figure 113: Middle East & Africa Oil & Gas Seals Market Y-o-Y Growth (%) by Process, 2021-2031

Figure 114: Middle East & Africa Oil & Gas Seals Market Attractiveness Analysis by Process, 2021-2031

Figure 115: Middle East & Africa Oil & Gas Seals Market Share and BPS Analysis by Country - 2021 & 2031

Figure 116: Middle East & Africa Oil & Gas Seals Market Y-o-Y Growth by Country, 2021-2031

Figure 117: Middle East & Africa Oil & Gas Seals Market Attractiveness Analysis by Country, 2021-2031

Figure 118: Middle East & Africa Oil & Gas Seals Market Incremental $ Opportunity by Country, 2021-2031

Explore Oil and Gas Insights

View Reports