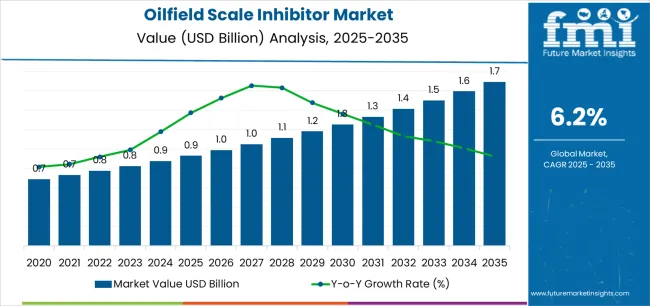
The Oilfield Scale Inhibitor Market is estimated to be valued at USD 0.9 billion in 2025 and is projected to reach USD 1.7 billion by 2035, registering a compound annual growth rate (CAGR) of 6.2% over the forecast period.
The oilfield scale inhibitor market is experiencing robust growth driven by increasing demand for efficient scale prevention in upstream and midstream operations. Rising oil and gas exploration activities, along with enhanced recovery techniques, are contributing to higher consumption of chemical inhibitors across production facilities. The current market scenario reflects a shift toward more sustainable and high-performance formulations that minimize environmental impact while maintaining operational efficiency.
Technological advancements in water treatment and scale monitoring systems are improving inhibitor performance and optimizing dosing precision. Future outlook indicates strong growth potential as aging oilfields and deeper wells require advanced scale control solutions to sustain production rates and reduce equipment maintenance costs.
Growth rationale is based on the industry’s emphasis on operational reliability, cost reduction, and compliance with environmental regulations Expanding investment in oilfield infrastructure and chemical innovation is expected to reinforce market expansion and ensure consistent adoption across global oil-producing regions.

| Metric | Value |
|---|---|
| Oilfield Scale Inhibitor Market Estimated Value in (2025 E) | USD 0.9 billion |
| Oilfield Scale Inhibitor Market Forecast Value in (2035 F) | USD 1.7 billion |
| Forecast CAGR (2025 to 2035) | 6.2% |
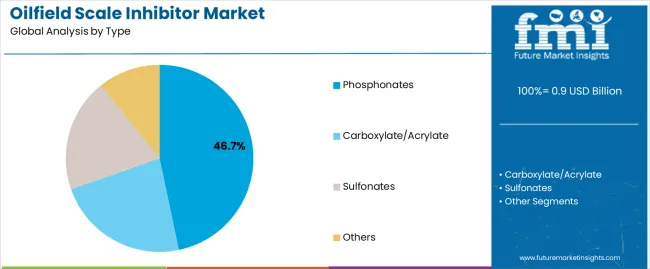
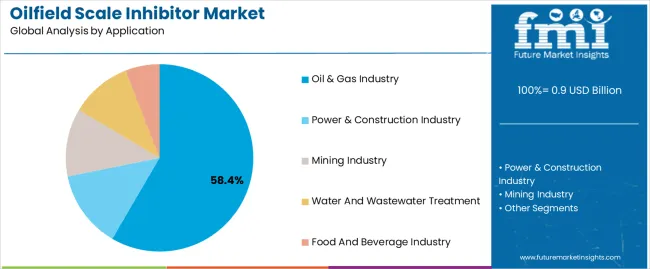
The market is segmented by Type and Application and region. By Type, the market is divided into Phosphonates, Carboxylate/Acrylate, Sulfonates, and Others. In terms of Application, the market is classified into Oil & Gas Industry, Power & Construction Industry, Mining Industry, Water And Wastewater Treatment, and Food And Beverage Industry. Regionally, the market is classified into North America, Latin America, Western Europe, Eastern Europe, Balkan & Baltic Countries, Russia & Belarus, Central Asia, East Asia, South Asia & Pacific, and the Middle East & Africa.

The phosphonates segment, accounting for 46.70% of the type category, has been leading the market due to its superior thermal stability, strong chelating properties, and proven efficiency in preventing scale deposition in high-pressure and high-temperature environments. Its wide adoption across oilfield operations has been supported by cost-effectiveness and compatibility with other treatment chemicals used in production systems.
Continuous improvement in formulation technology has enhanced phosphonate solubility and reduced precipitation risks, ensuring reliable performance in challenging well conditions. The segment’s growth has been reinforced by increasing utilization in water injection systems and flow assurance programs.
Regulatory compliance and ongoing product optimization efforts have further strengthened its position Future market traction is expected as operators continue to prioritize dependable, long-lasting scale inhibitors that ensure uninterrupted production and operational efficiency.

The oil and gas industry segment, representing 58.40% of the application category, has remained dominant owing to the extensive use of scale inhibitors in exploration, drilling, production, and refining processes. Rising global energy demand and growing investments in deepwater and unconventional reserves have increased the need for efficient scale management to safeguard assets and enhance productivity.
Adoption has been supported by advancements in chemical delivery systems and real-time monitoring technologies, which have optimized application efficiency. The segment’s leadership is reinforced by strong integration of scale inhibitors into corrosion and flow assurance programs, reducing downtime and maintenance costs.
Continuous R&D efforts aimed at developing environmentally friendly and thermally stable inhibitors are expected to strengthen adoption further As oilfield operators focus on operational continuity and performance optimization, the application of scale inhibitors in the oil and gas industry will continue to represent the largest and most resilient demand segment in the market.
Between 2020 and 2025, the oilfield scale inhibitor market experienced a robust historical CAGR of 8.2%. This growth was propelled by several factors, including increasing global oil and gas exploration and production activities, rising demand for efficient scale inhibition solutions to mitigate operational challenges, and advancements in scale inhibitor technologies.
The market benefited from the growing emphasis on maximizing production efficiency and minimizing downtime, prompting oilfield operators to invest in scale inhibition strategies to maintain smooth operations.
As the market matured during this period, the growth rate gradually stabilized, reflecting a more saturated market landscape and intensified competition among market players.
Looking ahead to the forecasted period from 2025 to 2035, the market is projected to exhibit a moderated CAGR of 6.5%. This forecasted growth rate reflects several anticipated trends and dynamics shaping the market landscape.
Factors such as evolving regulatory frameworks, technological innovations in scale inhibition solutions, and shifts in oil and gas production patterns are expected to influence market dynamics during this period.
Market maturity and saturation in certain regions may contribute to the moderated growth rate as the market reaches a state of equilibrium.
Despite the moderated growth rate, the market is anticipated to continue witnessing steady demand, driven by the need for effective scale management solutions to support sustainable oil and gas production operations.
| Historical CAGR from 2020 to 2025 | 8.2% |
|---|---|
| Forecast CAGR from 2025 to 2035 | 6.5% |
The provided table illustrates the top five countries in terms of revenue, with South Korea leading the list. With a significant portion of its energy supply coming from imported hydrocarbons, South Korea places great importance on ensuring the efficiency and reliability of its hydrocarbon processing facilities.
The country invests heavily in scale inhibition solutions to prevent scale formation and corrosion in refineries, petrochemical plants, and LNG terminals, thus maintaining operational efficiency and reducing maintenance costs. This proactive approach positions South Korea as a leader in adopting and utilizing oilfield scale inhibitors, driving market leadership in the region.
| Countries | Forecast CAGRs from 2025 to 2035 |
|---|---|
| The United States | 6.8% |
| South Korea | 9% |
| Japan | 8.1% |
| China | 7.3% |
| The United Kingdom | 7.7% |
In the United States, the market is primarily utilized in the extensive shale oil and gas operations, particularly in regions such as the Permian Basin and the Bakken Formation.
With a significant portion of the oil and gas production derived from shale reserves, the demand for scale inhibitors is driven by the need to mitigate scale formation in hydraulic fracturing operations, production wells, and associated infrastructure.
South Korea relies on imported oil and gas to meet its energy needs, and the market plays a crucial role in ensuring the efficiency and reliability of imported hydrocarbon processing facilities.
Scale inhibitors are used in refineries, petrochemical plants, and LNG terminals to prevent scale buildup in processing equipment and pipelines, thereby maintaining operational efficiency and reducing maintenance costs.
Offshore drilling and production activities in the Sea of Japan and the Pacific Ocean characterize the oil and gas industry in Japan. The market is utilized in offshore platforms and subsea infrastructure to prevent scale deposition in production wells, pipelines, and processing facilities.
Scale inhibitors play a vital role in ensuring the uninterrupted flow of hydrocarbons and optimizing production efficiency in offshore oil and gas fields.
The extensive oil and gas production operations drive the oilfield scale inhibitor market, spanning conventional and unconventional reserves.
Scale inhibitors are widely used in production wells, injection systems, and surface facilities to mitigate scale formation and maintain oilfield production rates across various regions, including the Tarim Basin, the Sichuan Basin, and the Bohai Bay.
The market is primarily utilized in the North Sea offshore oil and gas fields in the United Kingdom. Scale inhibitors are crucial for maintaining production efficiency and integrity in aging offshore platforms and subsea installations.
They are applied in production wells, pipelines, and topside processing facilities to prevent scale buildup and ensure the continued flow of hydrocarbons from the North Sea reservoirs.
The below section shows the leading segment. Based on type, the phosphonates segment is expected to register at 6.3% CAGR by 2035. Based on application, the power and construction industry is anticipated to expand at 6.1% CAGR by 2035.
Phosphonates are widely used as scale inhibitors in water treatment processes to prevent scale formation and corrosion in boilers, cooling systems, and desalination plants.
The increasing focus on infrastructure modernization and urbanization drives market growth in the power and construction industry.
| Category | CAGR from 2025 to 2035 |
|---|---|
| Phosphonates | 6.3% |
| Power and Construction Industry | 6.1% |
Based on type, the phosphonates segment is projected to exhibit a CAGR of 6.3%. Phosphonates are chemical compounds known for their scale inhibition properties, making them vital in various industries such as water treatment, agriculture, and oil and gas.
The anticipated growth reflects their increasing adoption across these sectors to mitigate scale formation and corrosion, particularly in water treatment applications where phosphonates are widely used as scale inhibitors in boiler water treatment, cooling water systems, and desalination plants.
Based on application, the power and construction industry is expected to grow at a CAGR of 6.1% by 2035. Several factors, such as urbanization, industrialization, and infrastructure development projects worldwide drive this growth.
In the power sector, phosphonates are used extensively in water treatment processes for power generation plants to prevent scale formation and corrosion in boilers, condensers, and cooling towers.
In the construction industry, phosphonates are utilized in concrete admixtures to enhance the properties of concrete, such as strength, durability, and resistance to chemical attack, thereby supporting the construction of robust and long-lasting infrastructure projects.
The projected expansion underscores the critical role of phosphonates in sustaining the efficiency and longevity of infrastructure in both industries, driving market growth over the forecast period.

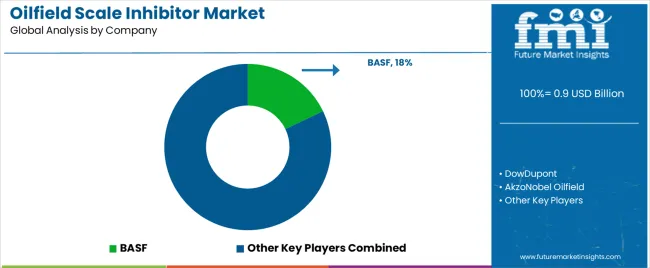
A mix of multinational corporations and regional players characterizes the competitive landscape of the oilfield scale inhibitor market. The industry giants leverage their technological expertise and strong customer relationships to maintain market leadership.
Smaller and niche players offer specialized scale inhibition solutions tailored to specific applications and regional requirements, fostering competition and innovation.
Some of the key developments
| Attributes | Details |
|---|---|
| Estimated Market Size in 2025 | USD 872.6 million |
| Projected Market Valuation in 2035 | USD 1,645 million |
| Value-based CAGR 2025 to 2035 | 6.5% |
| Forecast Period | 2025 to 2035 |
| Historical Data Available for | 2020 to 2025 |
| Market Analysis | Value in USD million |
| Key Regions Covered | North America; Latin America; Western Europe; Eastern Europe; South Asia and Pacific; East Asia; Middle East and Africa |
| Key Market Segments Covered | Type, Application, Region |
| Key Countries Profiled | The United States, Canada, Brazil, Mexico, Germany, The United Kingdom, France, Spain, Italy, Russia, Poland, Czech Republic, Romania, India, Bangladesh, Australia, New Zealand, China, Japan, South Korea, GCC countries, South Africa, Israel |
| Key Companies Profiled | DowDupont; BASF; AkzoNobel Oilfield; Kemira; Solvay; Halliburton; Schlumberger; Baker Hughes; Clariant; Evonik Industries |
The global oilfield scale inhibitor market is estimated to be valued at USD 0.9 billion in 2025.
The market size for the oilfield scale inhibitor market is projected to reach USD 1.7 billion by 2035.
The oilfield scale inhibitor market is expected to grow at a 6.2% CAGR between 2025 and 2035.
The key product types in oilfield scale inhibitor market are phosphonates, carboxylate/acrylate, sulfonates and others.
In terms of application, oil & gas industry segment to command 58.4% share in the oilfield scale inhibitor market in 2025.


Our Research Products

The "Full Research Suite" delivers actionable market intel, deep dives on markets or technologies, so clients act faster, cut risk, and unlock growth.

The Leaderboard benchmarks and ranks top vendors, classifying them as Established Leaders, Leading Challengers, or Disruptors & Challengers.

Locates where complements amplify value and substitutes erode it, forecasting net impact by horizon

We deliver granular, decision-grade intel: market sizing, 5-year forecasts, pricing, adoption, usage, revenue, and operational KPIs—plus competitor tracking, regulation, and value chains—across 60 countries broadly.

Spot the shifts before they hit your P&L. We track inflection points, adoption curves, pricing moves, and ecosystem plays to show where demand is heading, why it is changing, and what to do next across high-growth markets and disruptive tech

Real-time reads of user behavior. We track shifting priorities, perceptions of today’s and next-gen services, and provider experience, then pace how fast tech moves from trial to adoption, blending buyer, consumer, and channel inputs with social signals (#WhySwitch, #UX).

Partner with our analyst team to build a custom report designed around your business priorities. From analysing market trends to assessing competitors or crafting bespoke datasets, we tailor insights to your needs.
Supplier Intelligence
Discovery & Profiling
Capacity & Footprint
Performance & Risk
Compliance & Governance
Commercial Readiness
Who Supplies Whom
Scorecards & Shortlists
Playbooks & Docs
Category Intelligence
Definition & Scope
Demand & Use Cases
Cost Drivers
Market Structure
Supply Chain Map
Trade & Policy
Operating Norms
Deliverables
Buyer Intelligence
Account Basics
Spend & Scope
Procurement Model
Vendor Requirements
Terms & Policies
Entry Strategy
Pain Points & Triggers
Outputs
Pricing Analysis
Benchmarks
Trends
Should-Cost
Indexation
Landed Cost
Commercial Terms
Deliverables
Brand Analysis
Positioning & Value Prop
Share & Presence
Customer Evidence
Go-to-Market
Digital & Reputation
Compliance & Trust
KPIs & Gaps
Outputs
Full Research Suite comprises of:
Market outlook & trends analysis
Interviews & case studies
Strategic recommendations
Vendor profiles & capabilities analysis
5-year forecasts
8 regions and 60+ country-level data splits
Market segment data splits
12 months of continuous data updates
DELIVERED AS:
PDF EXCEL ONLINE
Oilfield Stimulation Chemicals Market Size and Share Forecast Outlook 2025 to 2035
Oilfield Communications Market Size and Share Forecast Outlook 2025 to 2035
Oilfield Surfactants Market Size and Share Forecast Outlook 2025 to 2035
Oilfield Production Chemicals Market – Trends & Forecast 2025 to 2035
Oilfield Chemicals Market Report - Growth, Demand & Forecast 2025 to 2035
Oilfield Roller Chain Market
Descaler Market Size and Share Forecast Outlook 2025 to 2035
Breaking Down Market Share in Descaler Industry
Nanoscale Zero-Valent Iron Market Size and Share Forecast Outlook 2025 to 2035
Nanoscale Sand Mill Market Size and Share Forecast Outlook 2025 to 2035
Nanoscale Chemicals Market Growth - Trends & Forecast 2025 to 2035
FcRn Inhibitors Market Size and Share Forecast Outlook 2025 to 2035
Mine Scaler Market Size and Share Forecast Outlook 2025 to 2035
Grid Scale Stationary Battery Storage Market Size and Share Forecast Outlook 2025 to 2035
PARP Inhibitor Market Analysis – Size, Share, and Forecast Outlook 2025 to 2035
Home Scales Market Size and Share Forecast Outlook 2025 to 2035
Hyperscale Cloud Market Trends - Growth & Forecast 2025 to 2035
CGRP Inhibitors Market Trends - Growth, Demand & Forecast 2025 to 2035
Chip Scale Package LED Market Insights – Trends & Forecast 2025 to 2035
Hyperscale Cloud Industry Market Trends – Growth & Forecast 2024-2034

Thank you!
You will receive an email from our Business Development Manager. Please be sure to check your SPAM/JUNK folder too.
Chat With
MaRIA