Methodology

Oilfield Stimulation Chemicals Market Size and Share Forecast Outlook 2025 to 2035

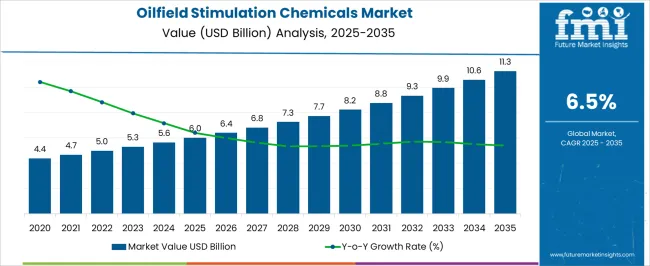
The Oilfield Stimulation Chemicals Market is estimated to be valued at USD 6.0 billion in 2025 and is projected to reach USD 11.3 billion by 2035, registering a compound annual growth rate (CAGR) of 6.5% over the forecast period.
Quick Stats for Oilfield Stimulation Chemicals Market

  • Oilfield Stimulation Chemicals Market Value (2025): USD 6.0 billion
  • Oilfield Stimulation Chemicals Market Forecast Value (2035): USD 11.3 billion
  • Oilfield Stimulation Chemicals Market Forecast CAGR: 6.5%
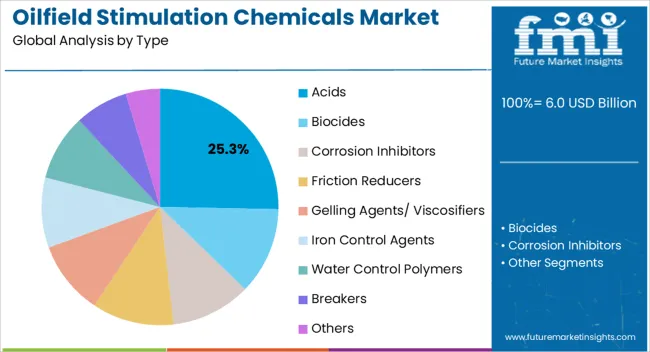
  • Leading Segment in Oilfield Stimulation Chemicals Market in 2025: Acids (25.3%)
  • Key Growth Regions in Oilfield Stimulation Chemicals Market: North America, Asia-Pacific, Europe
  • Top Key Players in Oilfield Stimulation Chemicals Market: Baker Hughes Incorporated, Schlumberger Limited, Halliburton Company, BASF SE, Dow Chemical Company, Clariant AG, Akzo Nobel N.V., Albemarle Corporation, Chevron Phillips Chemical Company, Ecolab Inc., Huntsman Corporation, Solvay S.A., Ashland Global Holdings Inc., Kemira Oyj, Stepan Company, Croda International Plc
Oilfield Stimulation Chemicals Market Market Value Analysis

Oilfield Stimulation Chemicals Market Key Takeaways

Metric Value
Oilfield Stimulation Chemicals Market Estimated Value in (2025 E) USD 6.0 billion
Oilfield Stimulation Chemicals Market Forecast Value in (2035 F) USD 11.3 billion
Forecast CAGR (2025 to 2035) 6.5%

Why is the Oilfield Stimulation Chemicals Market Growing?

The Oilfield Stimulation Chemicals market is witnessing steady growth, driven by the increasing demand for enhanced oil recovery and optimized production from aging and unconventional reservoirs. Rising global energy requirements, coupled with the need to maximize extraction efficiency, are supporting the adoption of advanced stimulation chemicals. Technological advancements in chemical formulations, including acids, surfactants, and viscosifiers, are improving reservoir stimulation performance and reducing operational risks.

Regulatory focus on safe and environmentally responsible chemical usage has encouraged the development of more efficient and less hazardous solutions, enhancing market acceptance. Increasing investments in hydraulic fracturing and well stimulation projects across North America, the Middle East, and Asia Pacific are contributing to market expansion.

The integration of data-driven reservoir analysis and monitoring systems is further optimizing chemical utilization and operational efficiency As exploration and production activities intensify in challenging reservoirs, the demand for high-performance stimulation chemicals is expected to sustain long-term growth, driven by technological innovation, operational cost efficiency, and regulatory compliance.

Segmental Analysis

The oilfield stimulation chemicals market is segmented by type, applications, and geographic regions. By type, oilfield stimulation chemicals market is divided into Acids, Biocides, Corrosion Inhibitors, Friction Reducers, Gelling Agents/ Viscosifiers, Iron Control Agents, Water Control Polymers, Breakers, and Others. In terms of applications, oilfield stimulation chemicals market is classified into Hydraulic Fracturing, Matrix Treatments, Acid Fracking, and Others. Regionally, the oilfield stimulation chemicals industry is classified into North America, Latin America, Western Europe, Eastern Europe, Balkan & Baltic Countries, Russia & Belarus, Central Asia, East Asia, South Asia & Pacific, and the Middle East & Africa.
Insights into the Acids Type Segment

Oilfield Stimulation Chemicals Market Analysis By Type

The acids segment is projected to hold 25.3% of the market revenue in 2025, establishing it as the leading type within oilfield stimulation chemicals. Its dominance is driven by the effectiveness of acids in dissolving formation deposits, enhancing permeability, and improving hydrocarbon flow in both conventional and unconventional reservoirs. These chemicals enable operators to achieve higher extraction efficiency and reduce the risk of formation damage.

Advanced formulations, including hydrochloric and organic acids, are being engineered to provide controlled reaction rates, minimize corrosion, and enhance safety. Integration with modern well stimulation technologies, such as coiled tubing and downhole delivery systems, further supports adoption.

Operational cost benefits, improved production rates, and compatibility with other stimulation chemicals strengthen the market position of acids As exploration moves into more complex reservoirs and deeper wells, acids are expected to remain the preferred choice for stimulation, driven by their proven effectiveness, adaptability, and contribution to enhanced oil recovery.
Insights into the Hydraulic Fracturing Applications Segment

Oilfield Stimulation Chemicals Market Analysis By Applications

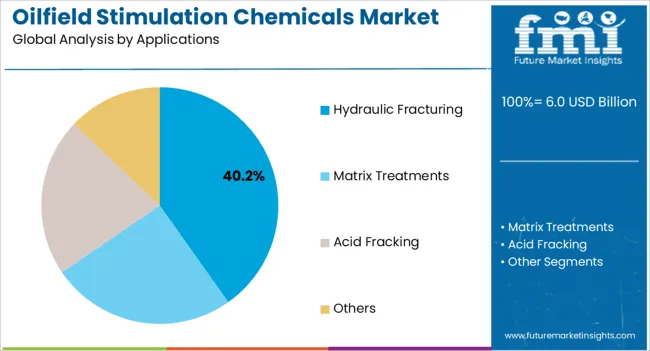
The hydraulic fracturing applications segment is anticipated to account for 40.2% of the market revenue in 2025, making it the leading application area. Its growth is being driven by the increasing use of hydraulic fracturing to unlock hydrocarbons from shale and other unconventional reservoirs. Stimulation chemicals, including acids and surfactants, are critical in enhancing fracture propagation, reducing formation damage, and optimizing hydrocarbon flow.

Advanced chemical formulations improve proppant transport, control fluid viscosity, and mitigate scaling or corrosion risks, thereby increasing operational efficiency. Rising investments in shale gas and tight oil projects across North America and Asia Pacific are further propelling the demand for chemical solutions tailored for hydraulic fracturing.

Environmental regulations and operational safety standards have encouraged the development of more sustainable and effective chemicals As energy demand continues to rise and unconventional resource exploitation expands, hydraulic fracturing is expected to remain the primary driver of growth in the oilfield stimulation chemicals market, supported by technological innovation, enhanced chemical performance, and cost efficiency.

Market Overview

Oilfield Stimulation Chemicals Market Overview

Oilfield Stimulation Chemicals are revolutionary products that are designed to support and enhance the stimulation process during oil extraction. Stimulation treatments are carried out to improve or restore the productivity of an oil well. Oilfield Stimulation Chemicals helps in the free flow of hydrocarbons from wells.

Oilfield Stimulation Chemicals are commonly used in hydraulic fracturing treatment and matrix treatments especially in the processes of emulsification, wetting, and compatibilization. Oilfield Stimulation Chemicals are also used in high-stability foaming systems for formation blocking and foam fracturing. It is also used in down-hole stimulation fluids including slick water fracturing applications.

Oilfield Stimulation Chemicals are finding high usage in various applications and new geographical areas which are driving the market. Different types of chemicals are used in the various process of oil extraction viz. acids, biocides, corrosion inhibitors, friction reducers, gelling agents/ viscosities, iron control agents, water control polymers and breakers.

Out of these, gelling agents or viscosities is the most widely used oilfield stimulation chemical with largest market share. Most commonly used technique among oilfield stimulation is acid stimulation whose work is to clean existing fractures by dissolving filling materials (mostly drilling mud or secondary minerals) and molding them for an efficient removal.

Acid treatment technique is used in bearing rock formations for many years to maintain or increase the rate of flow of oil from production wells or the rate of flow of oil-displacing fluids into injection wells. Because of its vast usage oilfield, stimulation chemicals market will witness an escalating demand in the oil industry.
Analysis of Oilfield Stimulation Chemicals Market By Key Countries

Oilfield Stimulation Chemicals Market Cagr Analysis By Country
Country CAGR
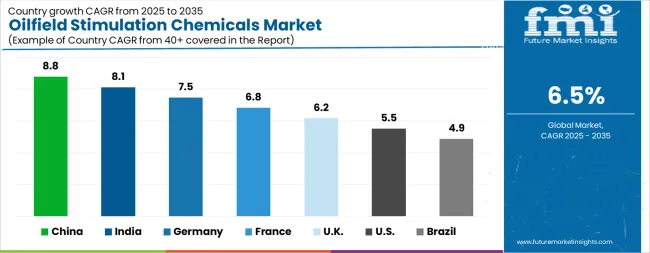
China 8.8%
India 8.1%
Germany 7.5%
France 6.8%
UK 6.2%
USA 5.5%
Brazil 4.9%

Country-wise Analysis

The Oilfield Stimulation Chemicals Market is expected to register a CAGR of 6.5% during the forecast period, exhibiting varied country level momentum. China leads with the highest CAGR of 8.8%, followed by India at 8.1%. Developed markets such as Germany, France, and the UK continue to expand steadily, while the USA is likely to grow at consistent rates. Brazil posts the lowest CAGR at 4.9%, yet still underscores a broadly positive trajectory for the global Oilfield Stimulation Chemicals Market. In 2024, Germany held a dominant revenue in the Western Europe market and is expected to grow with a CAGR of 7.5%. The USA Oilfield Stimulation Chemicals Market is estimated to be valued at USD 2.3 billion in 2025 and is anticipated to reach a valuation of USD 3.9 billion by 2035. Sales are projected to rise at a CAGR of 5.5% over the forecast period between 2025 and 2035. While Japan and South Korea markets are estimated to be valued at USD 309.6 million and USD 182.3 million respectively in 2025.
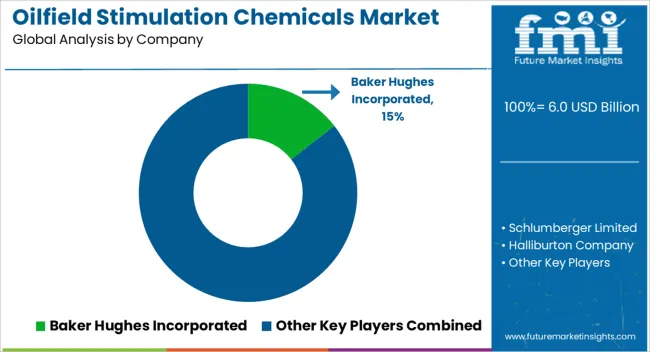
Key Players in the Oilfield Stimulation Chemicals Market

Oilfield Stimulation Chemicals Market Analysis By Company

  • Baker Hughes Incorporated
  • Schlumberger Limited
  • Halliburton Company
  • BASF SE
  • Dow Chemical Company
  • Clariant AG
  • Akzo Nobel N.V.
  • Albemarle Corporation
  • Chevron Phillips Chemical Company
  • Ecolab Inc.
  • Huntsman Corporation
  • Solvay S.A.
  • Ashland Global Holdings Inc.
  • Kemira Oyj
  • Stepan Company
  • Croda International Plc

Scope of the Report

Item Value
Quantitative Units USD 6.0 Billion
Type Acids, Biocides, Corrosion Inhibitors, Friction Reducers, Gelling Agents/ Viscosifiers, Iron Control Agents, Water Control Polymers, Breakers, and Others
Applications Hydraulic Fracturing, Matrix Treatments, Acid Fracking, and Others
Regions Covered North America, Europe, Asia-Pacific, Latin America, Middle East & Africa
Country Covered United States, Canada, Germany, France, United Kingdom, China, Japan, India, Brazil, South Africa
Key Companies Profiled Baker Hughes Incorporated, Schlumberger Limited, Halliburton Company, BASF SE, Dow Chemical Company, Clariant AG, Akzo Nobel N.V., Albemarle Corporation, Chevron Phillips Chemical Company, Ecolab Inc., Huntsman Corporation, Solvay S.A., Ashland Global Holdings Inc., Kemira Oyj, Stepan Company, and Croda International Plc

Oilfield Stimulation Chemicals Market by Segments

Type:

  • Acids
  • Biocides
  • Corrosion Inhibitors
  • Friction Reducers
  • Gelling Agents/ Viscosifiers
  • Iron Control Agents
  • Water Control Polymers
  • Breakers
  • Others

Applications:

  • Hydraulic Fracturing
  • Matrix Treatments
  • Acid Fracking
  • Others

Region:

  • North America
    • USA
    • Canada
    • Mexico
  • Latin America
    • Brazil
    • Chile
    • Rest of Latin America
  • Western Europe
    • Germany
    • UK
    • Italy
    • Spain
    • France
    • Nordic
    • BENELUX
    • Rest of Western Europe
  • Eastern Europe
    • Russia
    • Poland
    • Hungary
    • Balkan & Baltic
    • Rest of Eastern Europe
  • East Asia
    • China
    • Japan
    • South Korea
  • South Asia and Pacific
    • India
    • ASEAN
    • Australia & New Zealand
    • Rest of South Asia and Pacific
  • Middle East & Africa
    • Kingdom of Saudi Arabia
    • Other GCC Countries
    • Turkiye
    • South Africa
    • Other African Union
    • Rest of Middle East & Africa

Frequently Asked Questions

How big is the oilfield stimulation chemicals market in 2025?

The global oilfield stimulation chemicals market is estimated to be valued at USD 6.0 billion in 2025.

What will be the size of oilfield stimulation chemicals market in 2035?

The market size for the oilfield stimulation chemicals market is projected to reach USD 11.3 billion by 2035.

How much will be the oilfield stimulation chemicals market growth between 2025 and 2035?

The oilfield stimulation chemicals market is expected to grow at a 6.5% CAGR between 2025 and 2035.

What are the key product types in the oilfield stimulation chemicals market?

The key product types in oilfield stimulation chemicals market are acids, biocides, corrosion inhibitors, friction reducers, gelling agents/ viscosifiers, iron control agents, water control polymers, breakers and others.

Which applications segment to contribute significant share in the oilfield stimulation chemicals market in 2025?

In terms of applications, hydraulic fracturing segment to command 40.2% share in the oilfield stimulation chemicals market in 2025.

Table of Content

  1. Executive Summary
    • Global Market Outlook
    • Demand-side Trends
    • Supply-side Trends
    • Technology Roadmap Analysis
    • Analysis and Recommendations
  2. Market Overview
    • Market Coverage / Taxonomy
    • Market Definition / Scope / Limitations
  3. Market Background
    • Market Dynamics
      • Drivers
      • Restraints
      • Opportunity
      • Trends
    • Scenario Forecast
      • Demand in Optimistic Scenario
      • Demand in Likely Scenario
      • Demand in Conservative Scenario
    • Opportunity Map Analysis
    • Product Life Cycle Analysis
    • Supply Chain Analysis
    • Investment Feasibility Matrix
    • Value Chain Analysis
    • PESTLE and Porter’s Analysis
    • Regulatory Landscape
    • Regional Parent Market Outlook
    • Production and Consumption Statistics
    • Import and Export Statistics
  4. Global Market Analysis 2020 to 2024 and Forecast, 2025 to 2035
    • Historical Market Size Value (USD Million) Analysis, 2020 to 2024
    • Current and Future Market Size Value (USD Million) Projections, 2025 to 2035
      • Y-o-Y Growth Trend Analysis
      • Absolute $ Opportunity Analysis
  5. Global Market Pricing Analysis 2020 to 2024 and Forecast 2025 to 2035
  6. Global Market Analysis 2020 to 2024 and Forecast 2025 to 2035, By Type
    • Introduction / Key Findings
    • Historical Market Size Value (USD Million) Analysis By Type , 2020 to 2024
    • Current and Future Market Size Value (USD Million) Analysis and Forecast By Type , 2025 to 2035
      • Acids
      • Biocides
      • Corrosion Inhibitors
      • Friction Reducers
      • Gelling Agents/ Viscosifiers
      • Iron Control Agents
      • Water Control Polymers
      • Breakers
      • Others
    • Y-o-Y Growth Trend Analysis By Type , 2020 to 2024
    • Absolute $ Opportunity Analysis By Type , 2025 to 2035
  7. Global Market Analysis 2020 to 2024 and Forecast 2025 to 2035, By Applications
    • Introduction / Key Findings
    • Historical Market Size Value (USD Million) Analysis By Applications, 2020 to 2024
    • Current and Future Market Size Value (USD Million) Analysis and Forecast By Applications, 2025 to 2035
      • Hydraulic Fracturing
      • Matrix Treatments
      • Acid Fracking
      • Others
    • Y-o-Y Growth Trend Analysis By Applications, 2020 to 2024
    • Absolute $ Opportunity Analysis By Applications, 2025 to 2035
  8. Global Market Analysis 2020 to 2024 and Forecast 2025 to 2035, By Region
    • Introduction
    • Historical Market Size Value (USD Million) Analysis By Region, 2020 to 2024
    • Current Market Size Value (USD Million) Analysis and Forecast By Region, 2025 to 2035
      • North America
      • Latin America
      • Western Europe
      • Eastern Europe
      • East Asia
      • South Asia and Pacific
      • Middle East & Africa
    • Market Attractiveness Analysis By Region
  9. North America Market Analysis 2020 to 2024 and Forecast 2025 to 2035, By Country
    • Historical Market Size Value (USD Million) Trend Analysis By Market Taxonomy, 2020 to 2024
    • Market Size Value (USD Million) Forecast By Market Taxonomy, 2025 to 2035
      • By Country
        • USA
        • Canada
        • Mexico
      • By Type
      • By Applications
    • Market Attractiveness Analysis
      • By Country
      • By Type
      • By Applications
    • Key Takeaways
  10. Latin America Market Analysis 2020 to 2024 and Forecast 2025 to 2035, By Country
    • Historical Market Size Value (USD Million) Trend Analysis By Market Taxonomy, 2020 to 2024
    • Market Size Value (USD Million) Forecast By Market Taxonomy, 2025 to 2035
      • By Country
        • Brazil
        • Chile
        • Rest of Latin America
      • By Type
      • By Applications
    • Market Attractiveness Analysis
      • By Country
      • By Type
      • By Applications
    • Key Takeaways
  11. Western Europe Market Analysis 2020 to 2024 and Forecast 2025 to 2035, By Country
    • Historical Market Size Value (USD Million) Trend Analysis By Market Taxonomy, 2020 to 2024
    • Market Size Value (USD Million) Forecast By Market Taxonomy, 2025 to 2035
      • By Country
        • Germany
        • UK
        • Italy
        • Spain
        • France
        • Nordic
        • BENELUX
        • Rest of Western Europe
      • By Type
      • By Applications
    • Market Attractiveness Analysis
      • By Country
      • By Type
      • By Applications
    • Key Takeaways
  12. Eastern Europe Market Analysis 2020 to 2024 and Forecast 2025 to 2035, By Country
    • Historical Market Size Value (USD Million) Trend Analysis By Market Taxonomy, 2020 to 2024
    • Market Size Value (USD Million) Forecast By Market Taxonomy, 2025 to 2035
      • By Country
        • Russia
        • Poland
        • Hungary
        • Balkan & Baltic
        • Rest of Eastern Europe
      • By Type
      • By Applications
    • Market Attractiveness Analysis
      • By Country
      • By Type
      • By Applications
    • Key Takeaways
  13. East Asia Market Analysis 2020 to 2024 and Forecast 2025 to 2035, By Country
    • Historical Market Size Value (USD Million) Trend Analysis By Market Taxonomy, 2020 to 2024
    • Market Size Value (USD Million) Forecast By Market Taxonomy, 2025 to 2035
      • By Country
        • China
        • Japan
        • South Korea
      • By Type
      • By Applications
    • Market Attractiveness Analysis
      • By Country
      • By Type
      • By Applications
    • Key Takeaways
  14. South Asia and Pacific Market Analysis 2020 to 2024 and Forecast 2025 to 2035, By Country
    • Historical Market Size Value (USD Million) Trend Analysis By Market Taxonomy, 2020 to 2024
    • Market Size Value (USD Million) Forecast By Market Taxonomy, 2025 to 2035
      • By Country
        • India
        • ASEAN
        • Australia & New Zealand
        • Rest of South Asia and Pacific
      • By Type
      • By Applications
    • Market Attractiveness Analysis
      • By Country
      • By Type
      • By Applications
    • Key Takeaways
  15. Middle East & Africa Market Analysis 2020 to 2024 and Forecast 2025 to 2035, By Country
    • Historical Market Size Value (USD Million) Trend Analysis By Market Taxonomy, 2020 to 2024
    • Market Size Value (USD Million) Forecast By Market Taxonomy, 2025 to 2035
      • By Country
        • Kingdom of Saudi Arabia
        • Other GCC Countries
        • Turkiye
        • South Africa
        • Other African Union
        • Rest of Middle East & Africa
      • By Type
      • By Applications
    • Market Attractiveness Analysis
      • By Country
      • By Type
      • By Applications
    • Key Takeaways
  16. Key Countries Market Analysis
    • USA
      • Pricing Analysis
      • Market Share Analysis, 2024
        • By Type
        • By Applications
    • Canada
      • Pricing Analysis
      • Market Share Analysis, 2024
        • By Type
        • By Applications
    • Mexico
      • Pricing Analysis
      • Market Share Analysis, 2024
        • By Type
        • By Applications
    • Brazil
      • Pricing Analysis
      • Market Share Analysis, 2024
        • By Type
        • By Applications
    • Chile
      • Pricing Analysis
      • Market Share Analysis, 2024
        • By Type
        • By Applications
    • Germany
      • Pricing Analysis
      • Market Share Analysis, 2024
        • By Type
        • By Applications
    • UK
      • Pricing Analysis
      • Market Share Analysis, 2024
        • By Type
        • By Applications
    • Italy
      • Pricing Analysis
      • Market Share Analysis, 2024
        • By Type
        • By Applications
    • Spain
      • Pricing Analysis
      • Market Share Analysis, 2024
        • By Type
        • By Applications
    • France
      • Pricing Analysis
      • Market Share Analysis, 2024
        • By Type
        • By Applications
    • India
      • Pricing Analysis
      • Market Share Analysis, 2024
        • By Type
        • By Applications
    • ASEAN
      • Pricing Analysis
      • Market Share Analysis, 2024
        • By Type
        • By Applications
    • Australia & New Zealand
      • Pricing Analysis
      • Market Share Analysis, 2024
        • By Type
        • By Applications
    • China
      • Pricing Analysis
      • Market Share Analysis, 2024
        • By Type
        • By Applications
    • Japan
      • Pricing Analysis
      • Market Share Analysis, 2024
        • By Type
        • By Applications
    • South Korea
      • Pricing Analysis
      • Market Share Analysis, 2024
        • By Type
        • By Applications
    • Russia
      • Pricing Analysis
      • Market Share Analysis, 2024
        • By Type
        • By Applications
    • Poland
      • Pricing Analysis
      • Market Share Analysis, 2024
        • By Type
        • By Applications
    • Hungary
      • Pricing Analysis
      • Market Share Analysis, 2024
        • By Type
        • By Applications
    • Kingdom of Saudi Arabia
      • Pricing Analysis
      • Market Share Analysis, 2024
        • By Type
        • By Applications
    • Turkiye
      • Pricing Analysis
      • Market Share Analysis, 2024
        • By Type
        • By Applications
    • South Africa
      • Pricing Analysis
      • Market Share Analysis, 2024
        • By Type
        • By Applications
  17. Market Structure Analysis
    • Competition Dashboard
    • Competition Benchmarking
    • Market Share Analysis of Top Players
      • By Regional
      • By Type
      • By Applications
  18. Competition Analysis
    • Competition Deep Dive
      • Baker Hughes Incorporated
        • Overview
        • Product Portfolio
        • Profitability by Market Segments (Product/Age /Sales Channel/Region)
        • Sales Footprint
        • Strategy Overview
          • Marketing Strategy
          • Product Strategy
          • Channel Strategy
      • Schlumberger Limited
      • Halliburton Company
      • BASF SE
      • Dow Chemical Company
      • Clariant AG
      • Akzo Nobel N.V.
      • Albemarle Corporation
      • Chevron Phillips Chemical Company
      • Ecolab Inc.
      • Huntsman Corporation
      • Solvay S.A.
      • Ashland Global Holdings Inc.
      • Kemira Oyj
      • Stepan Company
      • Croda International Plc
  19. Assumptions & Acronyms Used
  20. Research Methodology

List of Tables

  • Table 1: Global Market Value (USD Million) Forecast by Region, 2020-2035
  • Table 2: Global Market Value (USD Million) Forecast by Type , 2020-2035
  • Table 3: Global Market Value (USD Million) Forecast by Applications, 2020-2035
  • Table 4: North America Market Value (USD Million) Forecast by Country, 2020-2035
  • Table 5: North America Market Value (USD Million) Forecast by Type , 2020-2035
  • Table 6: North America Market Value (USD Million) Forecast by Applications, 2020-2035
  • Table 7: Latin America Market Value (USD Million) Forecast by Country, 2020-2035
  • Table 8: Latin America Market Value (USD Million) Forecast by Type , 2020-2035
  • Table 9: Latin America Market Value (USD Million) Forecast by Applications, 2020-2035
  • Table 10: Western Europe Market Value (USD Million) Forecast by Country, 2020-2035
  • Table 11: Western Europe Market Value (USD Million) Forecast by Type , 2020-2035
  • Table 12: Western Europe Market Value (USD Million) Forecast by Applications, 2020-2035
  • Table 13: Eastern Europe Market Value (USD Million) Forecast by Country, 2020-2035
  • Table 14: Eastern Europe Market Value (USD Million) Forecast by Type , 2020-2035
  • Table 15: Eastern Europe Market Value (USD Million) Forecast by Applications, 2020-2035
  • Table 16: East Asia Market Value (USD Million) Forecast by Country, 2020-2035
  • Table 17: East Asia Market Value (USD Million) Forecast by Type , 2020-2035
  • Table 18: East Asia Market Value (USD Million) Forecast by Applications, 2020-2035
  • Table 19: South Asia and Pacific Market Value (USD Million) Forecast by Country, 2020-2035
  • Table 20: South Asia and Pacific Market Value (USD Million) Forecast by Type , 2020-2035
  • Table 21: South Asia and Pacific Market Value (USD Million) Forecast by Applications, 2020-2035
  • Table 22: Middle East & Africa Market Value (USD Million) Forecast by Country, 2020-2035
  • Table 23: Middle East & Africa Market Value (USD Million) Forecast by Type , 2020-2035
  • Table 24: Middle East & Africa Market Value (USD Million) Forecast by Applications, 2020-2035

List of Figures

  • Figure 1: Global Market Pricing Analysis
  • Figure 2: Global Market Value (USD Million) Forecast 2020-2035
  • Figure 3: Global Market Value Share and BPS Analysis by Type , 2025 and 2035
  • Figure 4: Global Market Y-o-Y Growth Comparison by Type , 2025-2035
  • Figure 5: Global Market Attractiveness Analysis by Type
  • Figure 6: Global Market Value Share and BPS Analysis by Applications, 2025 and 2035
  • Figure 7: Global Market Y-o-Y Growth Comparison by Applications, 2025-2035
  • Figure 8: Global Market Attractiveness Analysis by Applications
  • Figure 9: Global Market Value (USD Million) Share and BPS Analysis by Region, 2025 and 2035
  • Figure 10: Global Market Y-o-Y Growth Comparison by Region, 2025-2035
  • Figure 11: Global Market Attractiveness Analysis by Region
  • Figure 12: North America Market Incremental Dollar Opportunity, 2025-2035
  • Figure 13: Latin America Market Incremental Dollar Opportunity, 2025-2035
  • Figure 14: Western Europe Market Incremental Dollar Opportunity, 2025-2035
  • Figure 15: Eastern Europe Market Incremental Dollar Opportunity, 2025-2035
  • Figure 16: East Asia Market Incremental Dollar Opportunity, 2025-2035
  • Figure 17: South Asia and Pacific Market Incremental Dollar Opportunity, 2025-2035
  • Figure 18: Middle East & Africa Market Incremental Dollar Opportunity, 2025-2035
  • Figure 19: North America Market Value Share and BPS Analysis by Country, 2025 and 2035
  • Figure 20: North America Market Value Share and BPS Analysis by Type , 2025 and 2035
  • Figure 21: North America Market Y-o-Y Growth Comparison by Type , 2025-2035
  • Figure 22: North America Market Attractiveness Analysis by Type
  • Figure 23: North America Market Value Share and BPS Analysis by Applications, 2025 and 2035
  • Figure 24: North America Market Y-o-Y Growth Comparison by Applications, 2025-2035
  • Figure 25: North America Market Attractiveness Analysis by Applications
  • Figure 26: Latin America Market Value Share and BPS Analysis by Country, 2025 and 2035
  • Figure 27: Latin America Market Value Share and BPS Analysis by Type , 2025 and 2035
  • Figure 28: Latin America Market Y-o-Y Growth Comparison by Type , 2025-2035
  • Figure 29: Latin America Market Attractiveness Analysis by Type
  • Figure 30: Latin America Market Value Share and BPS Analysis by Applications, 2025 and 2035
  • Figure 31: Latin America Market Y-o-Y Growth Comparison by Applications, 2025-2035
  • Figure 32: Latin America Market Attractiveness Analysis by Applications
  • Figure 33: Western Europe Market Value Share and BPS Analysis by Country, 2025 and 2035
  • Figure 34: Western Europe Market Value Share and BPS Analysis by Type , 2025 and 2035
  • Figure 35: Western Europe Market Y-o-Y Growth Comparison by Type , 2025-2035
  • Figure 36: Western Europe Market Attractiveness Analysis by Type
  • Figure 37: Western Europe Market Value Share and BPS Analysis by Applications, 2025 and 2035
  • Figure 38: Western Europe Market Y-o-Y Growth Comparison by Applications, 2025-2035
  • Figure 39: Western Europe Market Attractiveness Analysis by Applications
  • Figure 40: Eastern Europe Market Value Share and BPS Analysis by Country, 2025 and 2035
  • Figure 41: Eastern Europe Market Value Share and BPS Analysis by Type , 2025 and 2035
  • Figure 42: Eastern Europe Market Y-o-Y Growth Comparison by Type , 2025-2035
  • Figure 43: Eastern Europe Market Attractiveness Analysis by Type
  • Figure 44: Eastern Europe Market Value Share and BPS Analysis by Applications, 2025 and 2035
  • Figure 45: Eastern Europe Market Y-o-Y Growth Comparison by Applications, 2025-2035
  • Figure 46: Eastern Europe Market Attractiveness Analysis by Applications
  • Figure 47: East Asia Market Value Share and BPS Analysis by Country, 2025 and 2035
  • Figure 48: East Asia Market Value Share and BPS Analysis by Type , 2025 and 2035
  • Figure 49: East Asia Market Y-o-Y Growth Comparison by Type , 2025-2035
  • Figure 50: East Asia Market Attractiveness Analysis by Type
  • Figure 51: East Asia Market Value Share and BPS Analysis by Applications, 2025 and 2035
  • Figure 52: East Asia Market Y-o-Y Growth Comparison by Applications, 2025-2035
  • Figure 53: East Asia Market Attractiveness Analysis by Applications
  • Figure 54: South Asia and Pacific Market Value Share and BPS Analysis by Country, 2025 and 2035
  • Figure 55: South Asia and Pacific Market Value Share and BPS Analysis by Type , 2025 and 2035
  • Figure 56: South Asia and Pacific Market Y-o-Y Growth Comparison by Type , 2025-2035
  • Figure 57: South Asia and Pacific Market Attractiveness Analysis by Type
  • Figure 58: South Asia and Pacific Market Value Share and BPS Analysis by Applications, 2025 and 2035
  • Figure 59: South Asia and Pacific Market Y-o-Y Growth Comparison by Applications, 2025-2035
  • Figure 60: South Asia and Pacific Market Attractiveness Analysis by Applications
  • Figure 61: Middle East & Africa Market Value Share and BPS Analysis by Country, 2025 and 2035
  • Figure 62: Middle East & Africa Market Value Share and BPS Analysis by Type , 2025 and 2035
  • Figure 63: Middle East & Africa Market Y-o-Y Growth Comparison by Type , 2025-2035
  • Figure 64: Middle East & Africa Market Attractiveness Analysis by Type
  • Figure 65: Middle East & Africa Market Value Share and BPS Analysis by Applications, 2025 and 2035
  • Figure 66: Middle East & Africa Market Y-o-Y Growth Comparison by Applications, 2025-2035
  • Figure 67: Middle East & Africa Market Attractiveness Analysis by Applications
  • Figure 68: Global Market - Tier Structure Analysis
  • Figure 69: Global Market - Company Share Analysis
Dashboard
Dashboard
Dashboard
Dashboard
Dashboard
Dashboard

Our Research Products

Full Research Suite

The "Full Research Suite" delivers actionable market intel, deep dives on markets or technologies, so clients act faster, cut risk, and unlock growth.

Competitor Leaderboard Report

The Leaderboard benchmarks and ranks top vendors, classifying them as Established Leaders, Leading Challengers, or Disruptors & Challengers.

Future Leaders Index

Locates where complements amplify value and substitutes erode it, forecasting net impact by horizon

Market Data & Forecasts

We deliver granular, decision-grade intel: market sizing, 5-year forecasts, pricing, adoption, usage, revenue, and operational KPIs—plus competitor tracking, regulation, and value chains—across 60 countries broadly.

Market Focus Report

Spot the shifts before they hit your P&L. We track inflection points, adoption curves, pricing moves, and ecosystem plays to show where demand is heading, why it is changing, and what to do next across high-growth markets and disruptive tech

Survey Report

Real-time reads of user behavior. We track shifting priorities, perceptions of today’s and next-gen services, and provider experience, then pace how fast tech moves from trial to adoption, blending buyer, consumer, and channel inputs with social signals (#WhySwitch, #UX).

Bespoke Reports

Partner with our analyst team to build a custom report designed around your business priorities. From analysing market trends to assessing competitors or crafting bespoke datasets, we tailor insights to your needs.

Supplier Intelligence

Discovery & Profiling

Capacity & Footprint

Performance & Risk

Compliance & Governance

Commercial Readiness

Who Supplies Whom

Scorecards & Shortlists

Playbooks & Docs

Category Intelligence

Definition & Scope

Demand & Use Cases

Cost Drivers

Market Structure

Supply Chain Map

Trade & Policy

Operating Norms

Deliverables

Buyer Intelligence

Account Basics

Spend & Scope

Procurement Model

Vendor Requirements

Terms & Policies

Entry Strategy

Pain Points & Triggers

Outputs

Pricing Analysis

Benchmarks

Trends

Should-Cost

Indexation

Landed Cost

Commercial Terms

Deliverables

Brand Analysis

Positioning & Value Prop

Share & Presence

Customer Evidence

Go-to-Market

Digital & Reputation

Compliance & Trust

KPIs & Gaps

Outputs

Full Research Suite comprises of:

Market outlook & trends analysis

Market outlook & trends analysis

Interviews & case studies

Interviews & case studies

Strategic recommendations

Strategic recommendations

Vendor profiles & capabilities analysis

Vendor profiles & capabilities analysis

5-year forecasts

5-year forecasts

8 regions and 60+ country-level data splits

8 regions and 60+ country-level data splits

Market segment data splits

Market segment data splits

12 months of continuous data updates

12 months of continuous data updates

DELIVERED AS:

PDF EXCEL ONLINE

Full Research Suite


$5000

$7500

$10000

Buy Report Now
Similar Industry Reports

Similar Industry Reports

Oilfield Scale Inhibitor Market

Oilfield Scale Inhibitor Market Size and Share Forecast Outlook 2025 to 2035

Oilfield Communications Market

Oilfield Communications Market Size and Share Forecast Outlook 2025 to 2035

Oilfield Surfactants Market

Oilfield Surfactants Market Size and Share Forecast Outlook 2025 to 2035

Oilfield Roller Chain Market

Oilfield Roller Chain Market

Oilfield Chemicals Market

Oilfield Chemicals Market Report - Growth, Demand & Forecast 2025 to 2035

Oilfield Production Chemicals Market

Oilfield Production Chemicals Market – Trends & Forecast 2025 to 2035

Rig and Oilfield Mat Market

Rig and Oilfield Mat Market Size and Share Forecast Outlook 2025 to 2035

Digital Oilfield Solutions Market

Digital Oilfield Solutions Market Growth - Trends & Forecast 2025 to 2035

Digital Oilfield Market

Digital Oilfield Market Growth – Trends & Forecast 2024-2034

Operational Digital Oilfield Solution Market

Operational Digital Oilfield Solution Market Size and Share Forecast Outlook 2025 to 2035

Well Stimulation Materials Market

Well Stimulation Materials Market Size and Share Forecast Outlook 2025 to 2035

Neurostimulation Market

Neurostimulation Market Growth - Size, Trends & Forecast 2025 to 2035

Photostimulation Lasers Market

Photostimulation Lasers Market

Wound Stimulation Therapy Market

Wound Stimulation Therapy Market Insights – Demand and Growth Forecast 2025 to 2035

Muscle Stimulation Devices Market

The Muscle Stimulation Devices Market is segmented by Product, Application and End User from 2025 to 2035

Motion Stimulation Therapy Market

Motion Stimulation Therapy Market Trends – Growth & Forecast 2024-2034

MRI-Safe Neurostimulation Systems Market

MRI-Safe Neurostimulation Systems Market Growth - Trends & Forecast 2025 to 2035

Non-invasive Brain Stimulation System Market

Non-invasive Brain Stimulation System Market Size and Share Forecast Outlook 2025 to 2035

Functional Electrical Stimulation (FES) Market

Functional Electrical Stimulation (FES) Market Trends - Growth & Forecast 2025 to 2035

Repetitive Transcranial Magnetic Stimulation Market

Repetitive Transcranial Magnetic Stimulation Market Size and Share Forecast Outlook 2025 to 2035

Future Market Insights

Oilfield Stimulation Chemicals Market

Chat With MaRIA

Chat With

MaRIA

Hi There, I am MaRIA, Your Market Research Intelligence Assistant. How may I help you?