Non-invasive Brain Stimulation System Market Outlook (2022 to 2032)

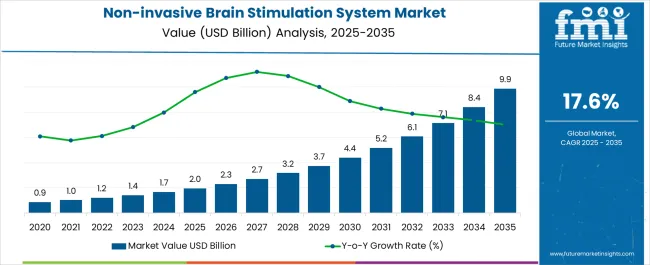
According to Future Market Insights' estimation, the non-invasive brain stimulation systems market will be worth USD1,200.5 million by 2022. To reach USD 2,429.3 million by 2032, the market is anticipated to grow at a CAGR of 6.6% over the forecast period (2022 to 2032).

Numerous neurological conditions, such as Parkinson's disease and tremors, have become more prevalent in recent years. This has resulted in an increase in the demand for non-invasive brain stimulation systems, which is creating the potential for businesses to generate revenue.

Given a number of benefits, such as quicker recovery time, non-invasive stimulation is favored by individuals all over the world. In light of this, non-invasive brain stimulation systems market participants see attractive opportunities in many developed and developing countries.

Report Attribute Details
Non-invasive Brain Stimulation System Market Historical Growth Rate (2017 to 2021) 17.6%
Non-invasive Brain Stimulation System Market Value (2022) USD 1,200.5 million
Non-invasive Brain Stimulation System Market Anticipated Forecast Value (2032) USD 2,429.3 million
Non-invasive Brain Stimulation System Market Projected Growth Rate (2022 to 2032) 6.6%

The most important aspects projected to drive the non-invasive brain stimulation system market during the forecast period are the growing occurrence of neurological disorders, the upsurge of non-invasive and minimally invasive measures, the practice of casualty techniques, rushing geriatric population leading to growing brain disorders associated with age, mounting uses of the transcranial magnetic stimulation method in diagnosis, treatment of neurological disorders, satisfactory reimbursements, and innovative and scientifically advanced products presented by companies such as neuro-navigating stimulators in the global market.

Additionally, young people, these days use mobile devices extensively. As a result, people's nervous systems are affected by persistent exposure to radiation from technology, which can lead to a variety of neurological illnesses.

The Food and Drug Administration (FDA) has authorized a non-invasive brain stimulation device for the treatment of depressive disorders. Transcranial stimulation (TCS) has not been well studied, although transcranial magnetic stimulation (TMS) has been licensed for the treatment of depressive disorders.

According to the World Health Organization, the elderly population is predicted to expand more quickly in affluent countries, notably the United States of America, Japan, and numerous European nations. Treatments for depression, tinnitus, stroke, and other neurological illnesses using TMS and TCS have shown promising results. This procedure does not call for an overnight stay and is administered at specialist clinics, outpatient clinics, hospitals, and other settings. As soon as the therapy is through, patients are free to return home.

Due to increased awareness of the adverse effects of drug treatment, healthcare professionals and patient groups worldwide are increasingly choosing non-invasive brain stimulation systems over it. This element is opening up enormous commercial opportunities in the market for non-invasive brain stimulation systems.

Owing to a focus on organic growth of the non-invasive brain stimulation system market by many businesses, there are likely to be breakthroughs in non-invasive brain stimulation systems in the upcoming years. These developments will help physicians with a variety of outpatient devices and give patients new therapies in cases where conventional therapies fail.

Players in the global non-invasive brain stimulation system market are investing more in Research and Development to enhance their products' overall performance, particularly battery life. Additionally, producers of non-invasive brain stimulation systems are working to improve a number of patient-related aspects, such as reliability in IPG recharging and consistency in nocturnal device endpoint.

Many manufacturers of non-invasive brain stimulation systems are focusing on adding device-specific features such as lead configuration, parameter delivery, and implantation site. In a similar vein, they carefully choose electrode materials to minimize impedance mismatch. During the forecast period, these elements are anticipated to encourage the expansion of the non-invasive brain stimulation system market worldwide.

Growing Prevalence of Neurological Disorders and Diseases is Driving Demand for Non-Invasive Brain Stimulation Systems

The market for non-invasive brain stimulation systems is predicted to see growth due to an increase in the number of persons suffering from neurological illnesses in key regions of the world. Neurological problems are becoming more common as the geriatric population worldwide goes up. This is driving up demand for non-invasive brain stimulation systems, which is, in turn, driving up market expansion.

Governments of many developed and developing countries provide enticing reimbursement plans for healthcare institutions. The non-invasive brain stimulation system market is growing in terms of sales based on this ground as well.

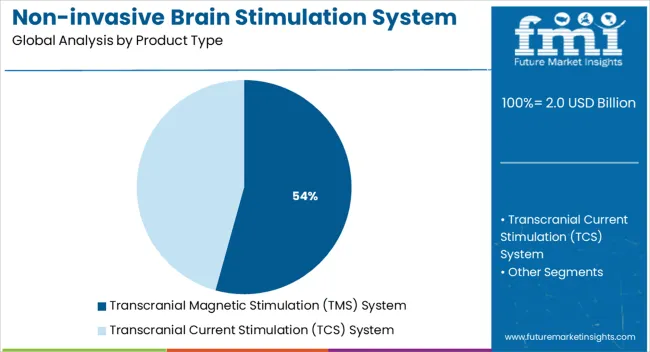
The function of the brain is investigated using functional MRI (magnetic resonance imaging) and EEG (electroencephalogram) methods. The process of stimulating the brain is also used to promote mental activity. The two techniques for brain stimulation are repeated transcranial magnetic stimulation (TMS) and transcranial current stimulation (TCS).

These two procedures, which are collectively referred to as non-invasive brain stimulation, are used to both enhance brain function and disrupt brain activity. Over the forecast period, the increasing relevance of these techniques is anticipated to encourage the growth of the worldwide non-invasive brain stimulation system market.

The industry's leading companies are concentrating on getting new non-invasive brain stimulation systems approved and put on the market in order to increase the variety of products they provide.

In addition, major industry competitors are concentrating on releasing improved versions of their non-invasive brain stimulation systems in the market. The industry is anticipated to increase as new technologies are increasingly used by hospitals.

Alternative Treatment Methods' Accessibility Probably Limit the Non-invasive Brain Stimulation Systems Market Growth

The hazards associated with deep brain stimulation treatments, such as lead misplacement and brain haemorrhage, are one of the main reasons impeding the growth of the global non-invasive brain stimulation system market. The risk of infections brought on by IPG is expected to limit the adoption of a Non-invasive Brain Stimulation System for Parkinson's disease.

On the other hand, another major restraint concerning the non-invasive brain stimulation systems market during the forecast period is likely to be electroconvulsive therapy. It has clinically demonstrated high efficacy in treating psychotic depression, and the number of patients utilizing the therapy is extremely high.

Presence of Cutting-edge Healthcare Infrastructure Fueling North American Market Enlargement

North America is predicted to dominate the global non-invasive brain stimulation systems market during the forecast period holding nearly 34.6% market share in 2022. a sizable population with depression and other neurological and psychological disorders, the presence of cutting-edge healthcare infrastructure and technologies, the availability of integrated healthcare IT products to maintain electronic health records, investments by governments in the creation of revolutionary medical devices, the availability of skilled and trained professionals, favorable reimbursement policies, and an increase in the adoption of advanced products are all contributing to the market growth in the region.

Statistics from the Centers for Disease Control and Prevention (CDC) show that between 3.5 million and 4 million persons in the United States of America alone have depression that is resistant to therapy.

In order to enhance equipment and technology and broaden the range of uses for non-invasive brain stimulation systems, there has been an increase in partnerships and cooperation between businesses and research universities on the international market. The market participants operating in the region have several prospects as a result of this and the rising number of approvals.
Rising Prevalence of Psychological Disorders is Pushing European Market Expansion

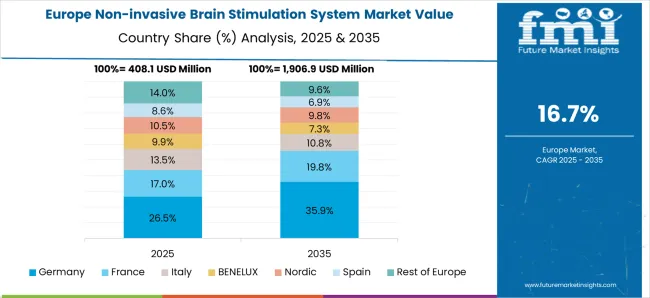
The second-largest market after the United States of America, Europe has had tremendous economic growth and increased healthcare access which resulted in the region holding almost 31.7% market share.

This has created a market opportunity for producers of innovative and non-invasive devices. During the forecast period, factors such as rising psychological disorder occurrence, rising health care spending, rising government initiatives, rising Research and Development activities, rising medical tourism, and rising demand for new treatments for these disorders are anticipated to support the growth of the non-invasive brain stimulation system market in Europe.

Start-ups are Stressing on Research and Development for Enhanced Inventions

The therapeutic potential of brain stimulation in the treatment of brain-related illnesses is currently being researched by new entrants.

For instance, LivaNova and MicroPort Scientific got FDA clearance for RegaTM pacemakers in September 2019. On the other hand, OrbiMed Advisors and KCK Groups launched an investment round of USD 74 million that NeuroPace, Inc. concluded last October.

With the help of this finance, the business will be able to quickly develop and market its FDA-approved DBS product, the NeuroPace RNS system.

Large Market Players are Concentrating to Produce Comprehensible Products in the Market

Numerous companies in the non-invasive brain stimulation system market are introducing novel, transportable, user-friendly, affordable, and highly effective products. Furthermore, a lot of businesses are concentrating on commercializing their offerings.

Example:

  • In November 2021, for Horizon 3.0, Magstim, a company that offers neuroscience-based mental health treatment and research, gained 510K approval. Since Horizon 3.0 was designed primarily for the clinical context, it offers enhanced workflows with guided TMS and analytics. Magstim Connect is a fresh and powerful patient data management system for TMS, delivering linked treatment at networking sites.
  • In January 2021, Gaelan Medical Trade LLC, a healthcare provider with several distribution channels in the United Arab Emirates, and BrainsWay Ltd., a global leader in non-invasive advanced therapy for brain illnesses, announced an exclusive distribution deal. The agreement establishes a multiyear framework for the marketing and sale of BrainsWay's patented, ground-breaking Deep Transcranial Magnetic Stimulation (Deep TMS) system throughout the United Arab Emirates. Deep TMS is currently marketed in various markets for treating brain disorders like major depressive disorder (MDD) and obsessive-compulsive disorder (OCD), among others.
  • In August 2020, the FDA approved MagVenture TMS Therapy as adjunctive therapy for obsessive-compulsive disorder (OCD). The Danish medical device firm MagVenture has received a second indication in the USA with this product.

Key Players

  • NeoSync, Inc.
  • Highland Instruments
  • MagVenture
  • BrainsWay
  • Magstim

Report Scope

Report Attribute Details
Growth Rate CAGR of 6.6% from 2022 to 2032
Base Year for Estimation 2021
Historical Data 2017 to 2021
Forecast Period 2022 to 2032
Quantitative Units Revenue in USD Billion, Volume in Kilotons, and CAGR from 2022 to 2032
Report Coverage Revenue Forecast, Volume Forecast, Company Ranking, Competitive Landscape, Growth Factors, Trends, and Pricing Analysis
Segments Covered

Product Type, Application, End-user, Region

Regions Covered

North America; Latin America; The Asia Pacific; Middle East and Africa; Europe

Key Countries Profiled

USA, Canada, Brazil, Argentina, Germany, United Kingdom, France, Spain, Italy, Nordics, BENELUX, Australia & New Zealand, China, India, ASEAN, GCC Countries, South Africa

Key Companies Profiled

NeoSync, Inc.; Highland Instruments; MagVenture; BrainsWay; Magstim

Customization Available Upon Request

Key Segments Profiled in the Non-invasive Brain Stimulation System Market

By Product Type:

  • Transcranial Magnetic Stimulation (TMS) System
  • Transcranial Current Stimulation (TCS) System

By Application:

  • Chronic Pain
  • Tremor
  • Depression
  • Epilepsy
  • Parkinson Disease
  • Others

By End-User:

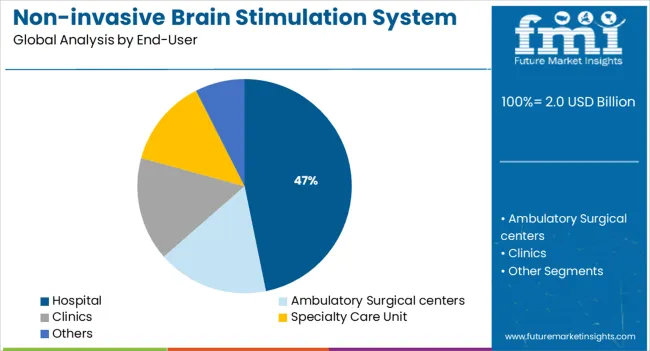
  • Hospital
  • Ambulatory Surgical centers
  • Clinics
  • Specialty Care Unit
  • Others

By Region:

  • North America
  • Latin America
  • Western Europe
  • Eastern Europe
  • Asia-Pacific
  • Japan
  • Middle East and Africa

Table of Content

  • 1. Executive Summary | Non-invasive Brain Stimulation System Market
  • 2. Market Overview
  • 3. Market Background
  • 4. Global Market Analysis 2017 to 2021 and Forecast, 2022 to 2032
  • 5. Global Market Analysis 2017 to 2021 and Forecast 2022 to 2032, By Product Type
    • 5.1. Transcranial Magnetic Stimulation (TMS) System
    • 5.2. Transcranial Current Stimulation (tCS) System
  • 6. Global Market Analysis 2017 to 2021 and Forecast 2022 to 2032, By Application
    • 6.1. Chronic Pain
    • 6.2. Tremor
    • 6.3. Depression
    • 6.4. Epilepsy
    • 6.5. Parkinson's Disease
    • 6.6. Others
  • 7. Global Market Analysis 2017 to 2021 and Forecast 2022 to 2032, By End User
    • 7.1. Hospital
    • 7.2. Ambulatory Surgical Centers
    • 7.3. Clinics
    • 7.4. Specialty Care Value (US$ Million)
    • 7.5. Others
  • 8. Global Market Analysis 2017 to 2021 and Forecast 2022 to 2032, By Region
    • 8.1. North America
    • 8.2. Latin America
    • 8.3. Western Europe
    • 8.4. Asia Pacific
    • 8.5. Japan
    • 8.6. Middle East and Africa
  • 9. North America Market Analysis 2017 to 2021 and Forecast 2022 to 2032, By Country
  • 10. Latin America Market Analysis 2017 to 2021 and Forecast 2022 to 2032, By Country
  • 11. Western Europe Market Analysis 2017 to 2021 and Forecast 2022 to 2032, By Country
  • 12. Asia Pacific Market Analysis 2017 to 2021 and Forecast 2022 to 2032, By Country
  • 13. Japan Market Analysis 2017 to 2021 and Forecast 2022 to 2032, By Country
  • 14. Middle East and Africa Market Analysis 2017 to 2021 and Forecast 2022 to 2032, By Country
  • 15. Key Countries Market Analysis
  • 16. Market Structure Analysis
  • 17. Competition Analysis
    • 17.1. NeoSync, Inc.
    • 17.2. Highland Instruments
    • 17.3. Mayfield Brain and Spine
    • 17.4. Boston Scientific Corporation
    • 17.5. Abbott Laboratories
    • 17.6. Medtronic plc
  • 18. Assumptions & Acronyms Used
  • 19. Research Methodology

List of Tables

Table 1: Global Market Value (US$ Million) Forecast by Region, 2017 to 2032

Table 2: Global Market Value (US$ Million) Forecast by Product Type, 2017 to 2032

Table 3: Global Market Value (US$ Million) Forecast by Application, 2017 to 2032

Table 4: Global Market Value (US$ Million) Forecast by End User, 2017 to 2032

Table 5: North America Market Value (US$ Million) Forecast by Country, 2017 to 2032

Table 6: North America Market Value (US$ Million) Forecast by Product Type, 2017 to 2032

Table 7: North America Market Value (US$ Million) Forecast by Application, 2017 to 2032

Table 8: North America Market Value (US$ Million) Forecast by End User, 2017 to 2032

Table 9: Latin America Market Value (US$ Million) Forecast by Country, 2017 to 2032

Table 10: Latin America Market Value (US$ Million) Forecast by Product Type, 2017 to 2032

Table 11: Latin America Market Value (US$ Million) Forecast by Application, 2017 to 2032

Table 12: Latin America Market Value (US$ Million) Forecast by End User, 2017 to 2032

Table 13: Western Europe Market Value (US$ Million) Forecast by Country, 2017 to 2032

Table 14: Western Europe Market Value (US$ Million) Forecast by Product Type, 2017 to 2032

Table 15: Western Europe Market Value (US$ Million) Forecast by Application, 2017 to 2032

Table 16: Western Europe Market Value (US$ Million) Forecast by End User, 2017 to 2032

Table 17: Asia Pacific Market Value (US$ Million) Forecast by Country, 2017 to 2032

Table 18: Asia Pacific Market Value (US$ Million) Forecast by Product Type, 2017 to 2032

Table 19: Asia Pacific Market Value (US$ Million) Forecast by Application, 2017 to 2032

Table 20: Asia Pacific Market Value (US$ Million) Forecast by End User, 2017 to 2032

Table 21: Japan Market Value (US$ Million) Forecast by Country, 2017 to 2032

Table 22: Japan Market Value (US$ Million) Forecast by Product Type, 2017 to 2032

Table 23: Japan Market Value (US$ Million) Forecast by Application, 2017 to 2032

Table 24: Japan Market Value (US$ Million) Forecast by End User, 2017 to 2032

Table 25: Middle East and Africa Market Value (US$ Million) Forecast by Country, 2017 to 2032

Table 26: Middle East and Africa Market Value (US$ Million) Forecast by Product Type, 2017 to 2032

Table 27: Middle East and Africa Market Value (US$ Million) Forecast by Application, 2017 to 2032

Table 28: Middle East and Africa Market Value (US$ Million) Forecast by End User, 2017 to 2032

List of Figures

Figure 1: Global Market Value (US$ Million) by Product Type, 2022 to 2032

Figure 2: Global Market Value (US$ Million) by Application, 2022 to 2032

Figure 3: Global Market Value (US$ Million) by End User, 2022 to 2032

Figure 4: Global Market Value (US$ Million) by Region, 2022 to 2032

Figure 5: Global Market Value (US$ Million) Analysis by Region, 2017 to 2032

Figure 6: Global Market Value Share (%) and BPS Analysis by Region, 2022 to 2032

Figure 7: Global Market Y-o-Y Growth (%) Projections by Region, 2022 to 2032

Figure 8: Global Market Value (US$ Million) Analysis by Product Type, 2017 to 2032

Figure 9: Global Market Value Share (%) and BPS Analysis by Product Type, 2022 to 2032

Figure 10: Global Market Y-o-Y Growth (%) Projections by Product Type, 2022 to 2032

Figure 11: Global Market Value (US$ Million) Analysis by Application, 2017 to 2032

Figure 12: Global Market Value Share (%) and BPS Analysis by Application, 2022 to 2032

Figure 13: Global Market Y-o-Y Growth (%) Projections by Application, 2022 to 2032

Figure 14: Global Market Value (US$ Million) Analysis by End User, 2017 to 2032

Figure 15: Global Market Value Share (%) and BPS Analysis by End User, 2022 to 2032

Figure 16: Global Market Y-o-Y Growth (%) Projections by End User, 2022 to 2032

Figure 17: Global Market Attractiveness by Product Type, 2022 to 2032

Figure 18: Global Market Attractiveness by Application, 2022 to 2032

Figure 19: Global Market Attractiveness by End User, 2022 to 2032

Figure 20: Global Market Attractiveness by Region, 2022 to 2032

Figure 21: North America Market Value (US$ Million) by Product Type, 2022 to 2032

Figure 22: North America Market Value (US$ Million) by Application, 2022 to 2032

Figure 23: North America Market Value (US$ Million) by End User, 2022 to 2032

Figure 24: North America Market Value (US$ Million) by Country, 2022 to 2032

Figure 25: North America Market Value (US$ Million) Analysis by Country, 2017 to 2032

Figure 26: North America Market Value Share (%) and BPS Analysis by Country, 2022 to 2032

Figure 27: North America Market Y-o-Y Growth (%) Projections by Country, 2022 to 2032

Figure 28: North America Market Value (US$ Million) Analysis by Product Type, 2017 to 2032

Figure 29: North America Market Value Share (%) and BPS Analysis by Product Type, 2022 to 2032

Figure 30: North America Market Y-o-Y Growth (%) Projections by Product Type, 2022 to 2032

Figure 31: North America Market Value (US$ Million) Analysis by Application, 2017 to 2032

Figure 32: North America Market Value Share (%) and BPS Analysis by Application, 2022 to 2032

Figure 33: North America Market Y-o-Y Growth (%) Projections by Application, 2022 to 2032

Figure 34: North America Market Value (US$ Million) Analysis by End User, 2017 to 2032

Figure 35: North America Market Value Share (%) and BPS Analysis by End User, 2022 to 2032

Figure 36: North America Market Y-o-Y Growth (%) Projections by End User, 2022 to 2032

Figure 37: North America Market Attractiveness by Product Type, 2022 to 2032

Figure 38: North America Market Attractiveness by Application, 2022 to 2032

Figure 39: North America Market Attractiveness by End User, 2022 to 2032

Figure 40: North America Market Attractiveness by Country, 2022 to 2032

Figure 41: Latin America Market Value (US$ Million) by Product Type, 2022 to 2032

Figure 42: Latin America Market Value (US$ Million) by Application, 2022 to 2032

Figure 43: Latin America Market Value (US$ Million) by End User, 2022 to 2032

Figure 44: Latin America Market Value (US$ Million) by Country, 2022 to 2032

Figure 45: Latin America Market Value (US$ Million) Analysis by Country, 2017 to 2032

Figure 46: Latin America Market Value Share (%) and BPS Analysis by Country, 2022 to 2032

Figure 47: Latin America Market Y-o-Y Growth (%) Projections by Country, 2022 to 2032

Figure 48: Latin America Market Value (US$ Million) Analysis by Product Type, 2017 to 2032

Figure 49: Latin America Market Value Share (%) and BPS Analysis by Product Type, 2022 to 2032

Figure 50: Latin America Market Y-o-Y Growth (%) Projections by Product Type, 2022 to 2032

Figure 51: Latin America Market Value (US$ Million) Analysis by Application, 2017 to 2032

Figure 52: Latin America Market Value Share (%) and BPS Analysis by Application, 2022 to 2032

Figure 53: Latin America Market Y-o-Y Growth (%) Projections by Application, 2022 to 2032

Figure 54: Latin America Market Value (US$ Million) Analysis by End User, 2017 to 2032

Figure 55: Latin America Market Value Share (%) and BPS Analysis by End User, 2022 to 2032

Figure 56: Latin America Market Y-o-Y Growth (%) Projections by End User, 2022 to 2032

Figure 57: Latin America Market Attractiveness by Product Type, 2022 to 2032

Figure 58: Latin America Market Attractiveness by Application, 2022 to 2032

Figure 59: Latin America Market Attractiveness by End User, 2022 to 2032

Figure 60: Latin America Market Attractiveness by Country, 2022 to 2032

Figure 61: Western Europe Market Value (US$ Million) by Product Type, 2022 to 2032

Figure 62: Western Europe Market Value (US$ Million) by Application, 2022 to 2032

Figure 63: Western Europe Market Value (US$ Million) by End User, 2022 to 2032

Figure 64: Western Europe Market Value (US$ Million) by Country, 2022 to 2032

Figure 65: Western Europe Market Value (US$ Million) Analysis by Country, 2017 to 2032

Figure 66: Western Europe Market Value Share (%) and BPS Analysis by Country, 2022 to 2032

Figure 67: Western Europe Market Y-o-Y Growth (%) Projections by Country, 2022 to 2032

Figure 68: Western Europe Market Value (US$ Million) Analysis by Product Type, 2017 to 2032

Figure 69: Western Europe Market Value Share (%) and BPS Analysis by Product Type, 2022 to 2032

Figure 70: Western Europe Market Y-o-Y Growth (%) Projections by Product Type, 2022 to 2032

Figure 71: Western Europe Market Value (US$ Million) Analysis by Application, 2017 to 2032

Figure 72: Western Europe Market Value Share (%) and BPS Analysis by Application, 2022 to 2032

Figure 73: Western Europe Market Y-o-Y Growth (%) Projections by Application, 2022 to 2032

Figure 74: Western Europe Market Value (US$ Million) Analysis by End User, 2017 to 2032

Figure 75: Western Europe Market Value Share (%) and BPS Analysis by End User, 2022 to 2032

Figure 76: Western Europe Market Y-o-Y Growth (%) Projections by End User, 2022 to 2032

Figure 77: Western Europe Market Attractiveness by Product Type, 2022 to 2032

Figure 78: Western Europe Market Attractiveness by Application, 2022 to 2032

Figure 79: Western Europe Market Attractiveness by End User, 2022 to 2032

Figure 80: Western Europe Market Attractiveness by Country, 2022 to 2032

Figure 81: Asia Pacific Market Value (US$ Million) by Product Type, 2022 to 2032

Figure 82: Asia Pacific Market Value (US$ Million) by Application, 2022 to 2032

Figure 83: Asia Pacific Market Value (US$ Million) by End User, 2022 to 2032

Figure 84: Asia Pacific Market Value (US$ Million) by Country, 2022 to 2032

Figure 85: Asia Pacific Market Value (US$ Million) Analysis by Country, 2017 to 2032

Figure 86: Asia Pacific Market Value Share (%) and BPS Analysis by Country, 2022 to 2032

Figure 87: Asia Pacific Market Y-o-Y Growth (%) Projections by Country, 2022 to 2032

Figure 88: Asia Pacific Market Value (US$ Million) Analysis by Product Type, 2017 to 2032

Figure 89: Asia Pacific Market Value Share (%) and BPS Analysis by Product Type, 2022 to 2032

Figure 90: Asia Pacific Market Y-o-Y Growth (%) Projections by Product Type, 2022 to 2032

Figure 91: Asia Pacific Market Value (US$ Million) Analysis by Application, 2017 to 2032

Figure 92: Asia Pacific Market Value Share (%) and BPS Analysis by Application, 2022 to 2032

Figure 93: Asia Pacific Market Y-o-Y Growth (%) Projections by Application, 2022 to 2032

Figure 94: Asia Pacific Market Value (US$ Million) Analysis by End User, 2017 to 2032

Figure 95: Asia Pacific Market Value Share (%) and BPS Analysis by End User, 2022 to 2032

Figure 96: Asia Pacific Market Y-o-Y Growth (%) Projections by End User, 2022 to 2032

Figure 97: Asia Pacific Market Attractiveness by Product Type, 2022 to 2032

Figure 98: Asia Pacific Market Attractiveness by Application, 2022 to 2032

Figure 99: Asia Pacific Market Attractiveness by End User, 2022 to 2032

Figure 100: Asia Pacific Market Attractiveness by Country, 2022 to 2032

Figure 101: Japan Market Value (US$ Million) by Product Type, 2022 to 2032

Figure 102: Japan Market Value (US$ Million) by Application, 2022 to 2032

Figure 103: Japan Market Value (US$ Million) by End User, 2022 to 2032

Figure 104: Japan Market Value (US$ Million) by Country, 2022 to 2032

Figure 105: Japan Market Value (US$ Million) Analysis by Country, 2017 to 2032

Figure 106: Japan Market Value Share (%) and BPS Analysis by Country, 2022 to 2032

Figure 107: Japan Market Y-o-Y Growth (%) Projections by Country, 2022 to 2032

Figure 108: Japan Market Value (US$ Million) Analysis by Product Type, 2017 to 2032

Figure 109: Japan Market Value Share (%) and BPS Analysis by Product Type, 2022 to 2032

Figure 110: Japan Market Y-o-Y Growth (%) Projections by Product Type, 2022 to 2032

Figure 111: Japan Market Value (US$ Million) Analysis by Application, 2017 to 2032

Figure 112: Japan Market Value Share (%) and BPS Analysis by Application, 2022 to 2032

Figure 113: Japan Market Y-o-Y Growth (%) Projections by Application, 2022 to 2032

Figure 114: Japan Market Value (US$ Million) Analysis by End User, 2017 to 2032

Figure 115: Japan Market Value Share (%) and BPS Analysis by End User, 2022 to 2032

Figure 116: Japan Market Y-o-Y Growth (%) Projections by End User, 2022 to 2032

Figure 117: Japan Market Attractiveness by Product Type, 2022 to 2032

Figure 118: Japan Market Attractiveness by Application, 2022 to 2032

Figure 119: Japan Market Attractiveness by End User, 2022 to 2032

Figure 120: Japan Market Attractiveness by Country, 2022 to 2032

Figure 121: Middle East and Africa Market Value (US$ Million) by Product Type, 2022 to 2032

Figure 122: Middle East and Africa Market Value (US$ Million) by Application, 2022 to 2032

Figure 123: Middle East and Africa Market Value (US$ Million) by End User, 2022 to 2032

Figure 124: Middle East and Africa Market Value (US$ Million) by Country, 2022 to 2032

Figure 125: Middle East and Africa Market Value (US$ Million) Analysis by Country, 2017 to 2032

Figure 126: Middle East and Africa Market Value Share (%) and BPS Analysis by Country, 2022 to 2032

Figure 127: Middle East and Africa Market Y-o-Y Growth (%) Projections by Country, 2022 to 2032

Figure 128: Middle East and Africa Market Value (US$ Million) Analysis by Product Type, 2017 to 2032

Figure 129: Middle East and Africa Market Value Share (%) and BPS Analysis by Product Type, 2022 to 2032

Figure 130: Middle East and Africa Market Y-o-Y Growth (%) Projections by Product Type, 2022 to 2032

Figure 131: Middle East and Africa Market Value (US$ Million) Analysis by Application, 2017 to 2032

Figure 132: Middle East and Africa Market Value Share (%) and BPS Analysis by Application, 2022 to 2032

Figure 133: Middle East and Africa Market Y-o-Y Growth (%) Projections by Application, 2022 to 2032

Figure 134: Middle East and Africa Market Value (US$ Million) Analysis by End User, 2017 to 2032

Figure 135: Middle East and Africa Market Value Share (%) and BPS Analysis by End User, 2022 to 2032

Figure 136: Middle East and Africa Market Y-o-Y Growth (%) Projections by End User, 2022 to 2032

Figure 137: Middle East and Africa Market Attractiveness by Product Type, 2022 to 2032

Figure 138: Middle East and Africa Market Attractiveness by Application, 2022 to 2032

Figure 139: Middle East and Africa Market Attractiveness by End User, 2022 to 2032

Figure 140: Middle East and Africa Market Attractiveness by Country, 2022 to 2032

Frequently Asked Questions

What is the Growth Outlook for the Non-invasive Brain Stimulation System Market?

The global non-invasive brain stimulation systems market is expected to progress at a CAGR of 6.6% (2022 to 2032).

Which Region is Anticipated to Embrace the Maximum Share in the Global Non-invasive Brain Stimulation System Market?

North America is expected to hold the highest share (34.6%) in the global non-invasive brain stimulation systems market.

What is the Future of the Non-invasive Brain Stimulation System Market?

The global non-invasive brain stimulation systems market is predicted to account for USD 2,429.3 million by 2032.

Explore Similar Insights

Future Market Insights

Non-invasive Brain Stimulation System Market