Brain Monitoring Market Size and Share Forecast Outlook From 2024 to 2034

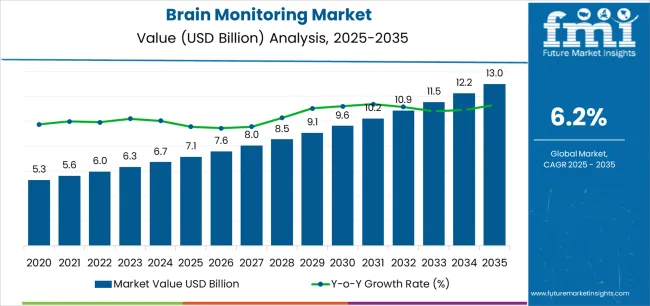
The global Brain Monitoring Market is anticipated to be worth USD 12.5 billion by 2034. According to the estimates, the demand for brain monitoring systems is projected to clock a 6.5% CAGR until 2034. In 2024, the market size for brain monitoring is valued at USD 6.7 billion.

Attributes Details
Brain Monitoring Market Size, 2023 USD 6.2 billion
Market Size, 2024 USD 6.7 billion
Market Value, 2034 USD 12.5 billion
Value CAGR (2024 to 2034) 6.5%

Top Market Dynamics and Industry Highlights in Brain Monitoring

Miniaturization Technology Advancements Reshape the Market's Landscape

The market for brain monitoring is evolving because of technological advancements in miniaturization; businesses are using small, lightweight devices to satisfy consumer demands for portability and convenience.

This development puts businesses in an advantageous position in industries like home healthcare and ambulatory settings, where mobility is essential. In the rapidly changing field of portable neuro-monitoring systems, miniaturization tactics promote product differentiation, collaborate with mobile technology suppliers, and increase overall competitiveness.

Leveraging Brain-computer Interfaces Presents Opportunities in the Market

Enhancing accessibility through the use of brain-computer interfaces (BCIs) is a cutting-edge business prospect with significant societal implications. Businesses that specialize in creating BCIs for people with disabilities can help people with motor impairments live better lives and have more options.

This opportunity complies with inclusive design principles and opens up new market leadership and differentiation possibilities by fostering prospective partnerships with assistive technology businesses, rehabilitation facilities, and accessibility and inclusion-focused groups.

Integration with Digital Therapeutics Can Broaden the Scope of Offerings in the Market

The incorporation of brain activity monitoring data into digital prescriptions and treatments is a progressive business approach that converts brain monitoring systems into all-encompassing treatment approaches. Businesses that follow this trend provide comprehensive strategies integrating digital treatments based on evidence with real-time monitoring.

This creates a distinct market position at the nexus of therapeutic solutions and diagnostics, opening doors for partnerships with pharmaceutical firms, healthcare providers, and digital health platforms. It's a calculated move that enhances the range of services offered and advances the idea of more efficient and well-rounded patient care.

Sales Trend Analysis from 2019 to 2023 Compared to Market Outlook for 2024 to 2034

Attributes Details
Market CAGR (2019 to 2023) 8.1%

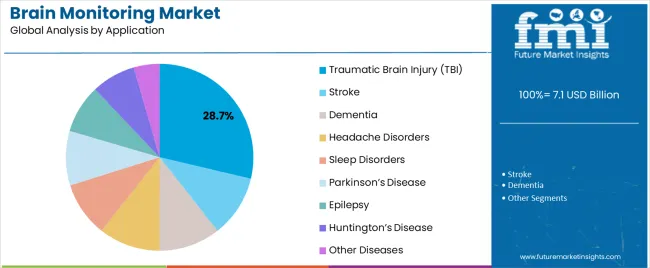
The brain monitoring market size expanded at an 8.1% CAGR from 2019 to 2023. The demand for efficient brain monitoring tools is growing due to the rising prevalence of neurological conditions such as epilepsy, Parkinson's disease, Alzheimer's disease, and stroke.

These illnesses are becoming more common as the world's population ages, which is driving up demand for brain monitoring and diagnosis tools.

Preventive healthcare practices are growing more popular as people become more aware of how important it is to keep the brain healthy. The need for tools and technology that provide ongoing monitoring of brain activity is driving growth in the market for brain monitoring equipment, both medical and consumer-oriented.

Beyond conventional healthcare, brain monitoring technology is being used in gaming, education, and wellness. By creating novel use cases and reaching new customer groups, cross-industry cooperation with tech firms, game developers, and educational institutions continues to boost market growth.

In the coming years, the demand for consumer-grade brain monitoring devices is predicted to be driven by the growing consumer interest in self-care and health monitoring. The market for technologies that assess and optimize individual brain health is expected to grow as people become more conscientious about their health and well-being.

Brain monitoring technology adoption is expected to be impacted by global healthcare trends such as customized treatment, value-based care, and a move toward preventative healthcare. These trends are supported by incorporating brain data into holistic healthcare strategies, propelling market expansion.

Emerging Trends and Growth Analysis in the Brain Monitoring Industry

Trends
  • The burgeoning desire for continuous, real-time health data has led to the widespread adoption of wearable brain monitoring devices, a highly lucrative trend.
  • Brain-monitoring systems that strategically integrate AI and machine learning are disrupting the market dynamics by improving data processing capabilities.
  • A significant trend in the brain monitoring market is the increasing use of telehealth services and remote patient monitoring, which is bringing in a new age of easily accessible and patient-centered treatment.
  • The market for brain monitoring is changing as a result of the industry's growing emphasis on the early diagnosis and prevention of neurological illnesses.
  • The inclination towards amalgamating several modalities for brain monitoring, such as merging EEG with fMRI or NIRS, denotes a tactical transition towards all-encompassing data gathering.
Opportunities
  • There are prospects for the development and growth of consumer-grade brain monitoring devices, aiming at a wider market sector driven by the growing trend of consumers proactively tracking their health.
  • Blockchain technology integration offers opportunities for transparent and safe data sharing.
  • Working together on smart city projects offers the potential to include brain monitoring in urban health ecosystems.
  • There are prospects to combine brain monitoring with cutting-edge technologies like artificial intelligence (AI), virtual reality (VR), and augmented reality (AR), opening up new applications and sources of income.
  • Incorporating data from brain monitoring systems into digital treatments has prospects for tailored and focused interventions, hence fostering the expansion of digital health solutions.
Challenges
  • Market participants encounter risks from changing rules and ethical issues related to using brain data.
  • New technology or diagnostic procedures in neurology can threaten conventional brain monitoring techniques.

Brain Monitoring Industry Analysis by Top Investment Segments

Devices Continue to be Leading Products in the Market

Segment Devices (Products)
Value CAGR (2024 to 2034) 6.3%

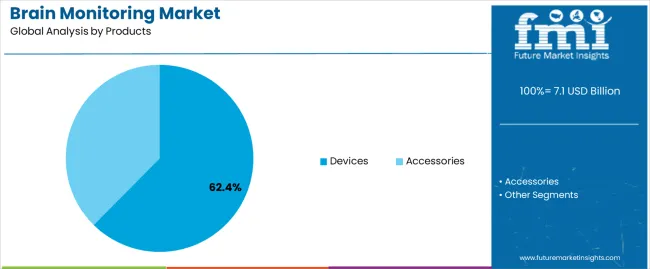
Based on products, the devices segment is projected to expand at a 6.3% CAGR through 2034.

  • Innovation and product development have been boosted by the financing and investment opportunities in the neurotechnology industry. The market demand has been further stimulated by companies' ability to provide cutting-edge brain monitoring technologies due to increased financial assistance from investors, governments, and venture capital firms.
  • Age-related neurological diseases and cognitive health are becoming increasingly important as the world's population ages. The demands of the aging population are met by brain monitoring devices, which offer instruments for ongoing observation, early cognitive decline detection, and therapies to maintain brain health as people age.

Demand for Invasive Procedures Remains Prominent in the Market

Segment Invasive (Procedure)
Value CAGR (2024 to 2034) 6.1%

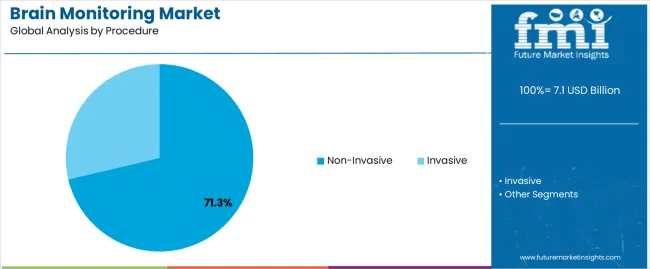
Based on the procedure, the invasive segment is predicted to surge at a 6.1% CAGR through 2034.

  • There are therapeutic uses for invasive brain monitoring techniques. Neurostimulation devices, for instance, can transmit electrical impulses to certain brain parts, therefore modifying neural activity and offering therapeutic advantages. This multifunctional strategy adds to the market's need for intrusive operations.
  • The rising demand for invasive brain monitoring can be attributed to enhanced safety profiles and greater acceptability among patients and medical professionals. Improvements in safety protocols, minimal invasiveness, and surgical technique advancements can significantly impact the perspective of these treatments.

Analysis of Top Countries Developing, Certifying, and Deploying Brain Monitoring Technologies

Countries Value CAGR (2024 to 2034)
United States 6.8%
United Kingdom 5.1%
China 7.3%
Japan 7.6%
South Korea 8.3%

Alignment with Precision Medicine Initiatives Nurtures Market Growth in the United States

The demand for brain monitoring in the United States is projected to rise at a 6.8% CAGR through 2034.

  • Brain monitoring technologies benefit from the growing focus on customized healthcare and precision medicine in the United States. Brain monitoring systems are being positioned as essential elements of individualized treatment strategies, in line with larger precision medicine ambitions, by enabling the customization of diagnostic and therapeutic actions based on specific patient profiles.
  • The value proposition of brain monitoring technology is improved by the application of artificial intelligence (AI) and big data analytics in the American healthcare system. Aligning with the larger trend of data-driven healthcare transition, integration with advanced analytics enables complex data interpretation, predictive insights, and the creation of AI-driven diagnostic and therapeutic offerings.

Digital Health Initiatives and Adoption Foster Growth in the United Kingdom

The sales of brain monitoring in the United Kingdom are expected to increase at a 5.1% CAGR through 2034.

  • The United Kingdom's focus on digital health initiatives and the use of health technology encourages a competitive marketplace for brain monitoring products. Market adoption is facilitated by integrating digital health platforms, telemedicine services, and electronic health records, all of which align with the healthcare system's larger digital transformation objectives.
  • The United Kingdom's demographic transition towards an aging population has resulted in a demand for brain monitoring systems to treat neurological diseases associated with aging. Businesses that tailor their offerings to the unique requirements of the elderly population follow consumer trends and foster long-term success.

Government Investments in Healthcare Infrastructure Boost Sales in China

The brain monitoring market growth in China is estimated to have a 7.3% CAGR through 2034.

  • Significant government investments are part of China's commitment to improving its healthcare infrastructure, as seen by programs like the Healthy China 2030 plan. In line with the larger goal of developing a more sophisticated healthcare system, this funding fosters the adoption of cutting-edge medical technology, such as brain monitoring techniques.
  • Brain monitoring technologies linked to virtual healthcare platforms are in high demand due to China's fast growth of telemedicine services, particularly in distant and remote areas. The expansion of telemedicine supports larger objectives for healthcare accessibility and opens doors for creative remote brain monitoring approaches.

Aging Population and Neurological Disorder Prevalence Surges Demand in Japan

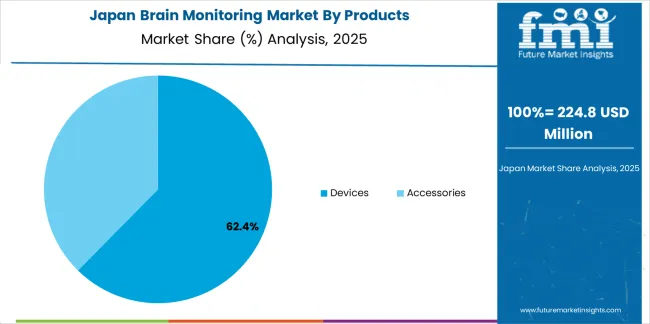
The demand for brain monitoring technologies in Japan is anticipated to rise at a 7.6% CAGR through 2034.

  • Brain monitoring technologies are in high demand in Japan due to the country's rapidly aging population and the rise in age-related neurological illnesses that accompany it. Because dementia and Parkinson's disease are so common in the senior population, there is an increasing demand for precise diagnostic instruments and ongoing monitoring systems designed to address the unique healthcare needs of the aged.
  • The adoption of sophisticated medical technology is facilitated by Japan's strong legacy of precision engineering and cultural acceptance of technical innovation. Because of its reputation for technological strength, the Japanese market is keen on novel brain monitoring solutions that make use of cutting-edge technology like artificial intelligence, robotics, and wearable gadgets.

High Prevalence of Stress-related Disorders Fuels Market Growth in South Korea

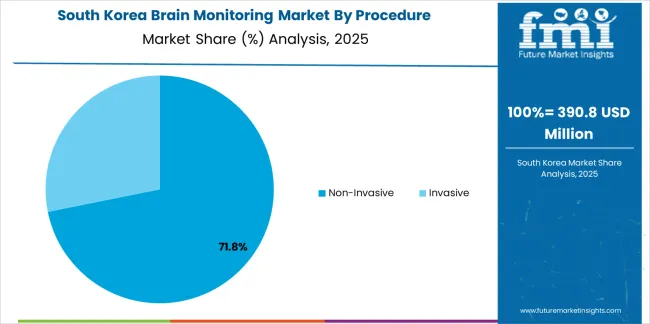
The sales of brain monitoring solutions in South Korea are expected to surge at an 8.3% CAGR through 2034.

  • Stress-related ailments are becoming more common in South Korea due to the country's high-stress work environment. The population's requirements for healthcare are met by brain monitoring technology that handles mental health issues and stress management. Businesses that provide stress management and monitoring tools stand to gain a large portion of the market.
  • Brain monitoring devices intended for home usage have prospects because of South Korea's cultural preference for home-based healthcare solutions. Convenience and self-care preferences are culturally aligned with solutions that allow people to monitor their cognitive health from the comforts of their homes. Businesses that focus on brain monitoring systems that are easy to use at home can serve this market niche.

Leading Suppliers in the Brain Monitoring Sector

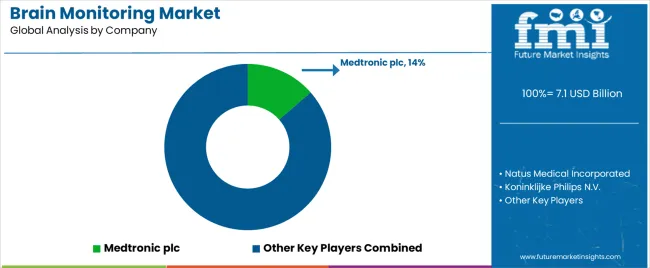
The brain monitoring market is driven by well-known industry giants with a global presence and set industry standards, such as Koninklijke Philips and Medtronic. Creative startups that challenge conventional methods, such as BrainScope and Advanced Brain Monitoring, add to the market's vibrancy.

It is customary to collaborate with research institutes, which promotes quick invention. Regional approaches differ, with North America emphasizing conformity and Asia Pacific aligning with local goals.

Recent Developments

  • In January 2024, researchers at the University of California, San Diego (UCSD) created a brain implant that overcomes the limits of existing technology, providing high-resolution insights into deep cerebral activity without the need for intrusive operations. The discovery, published in Nature Nanotechnology, represents a big step forward in developing a minimally invasive brain-computer interface (BCI) that can provide fresh insights into the brain's workings.
  • In October 2023, Ceribell, Inc. launched ClarityPro, a novel AI algorithm with possible reimbursement for qualifying Medicare patients. ClarityPro is an AI-powered software algorithm included in the Ceribell EEG equipment that analyzes EEG waveforms to determine electrographic status epilepticus.

Notable Players in the Business Landscape

  • Natus Medical Incorporated
  • Medtronic plc
  • Koninklijke Philips N.V.
  • GE Healthcare
  • Siemens Healthineers
  • Compumedics Limited
  • BrainScope Company, Inc.
  • NeuroWave Systems Inc.
  • Nihon Kohden Corporation
  • Cadwell Industries, Inc.
  • Elekta AB
  • Advanced Brain Monitoring
  • CAS Medical Systems, Inc.
  • NCC Medical Co., Ltd.
  • Neurosoft

Top Segments Studied in the Brain Monitoring Market

By Products:

  • Devices
    • Melectroencephalography (EEG) Devices
    • Magnetoencephalography (MEG) Devices
    • Transcranial Doppler (TCD) Devices
    • Intracranial Pressure (ICP) Monitors
    • Cerebral Oximeters
    • Magnetic Resonance Imaging (MRI) Devices
    • Computerized Tomography (C.T.) Devices
    • Positron Emission Tomography (PET) Devices
    • Sleep Monitoring Devices
    • Electromyography (EMG) Devices
  • Accessories
    • Electrodes
    • Sensors
    • Pastes & gels
    • Caps
    • Cables
    • Batteries
    • Others

By Procedure:

  • Invasive
  • Non-invasive

By Application:

  • Traumatic brain injury (TBI)
  • Stroke
  • Dementia
  • Headache disorders
  • Sleep disorders
  • Parkinson's disease
  • Epilepsy
  • Huntington's disease
  • Other diseases

By End User:

  • Hospitals
  • Neurology Centres
  • Clinics & ASC

By Region:

  • North America
  • Latin America
  • Europe
  • Asia Pacific
  • The Middle East and Africa

Table of Content

  • 1. Executive Summary
  • 2. Market Overview
  • 3. Market Background
  • 4. Global Market Analysis 2019 to 2023 and Forecast, 2024 to 2034
  • 5. Global Market Analysis 2019 to 2023 and Forecast 2024 to 2034, By Product
    • 5.1. Device
      • 5.1.1. Melectroencephalography (EEG) devices
      • 5.1.2. Magnetoencephalography (MEG) devices
      • 5.1.3. Transcranial Doppler (TCD) devices
      • 5.1.4. Intracranial pressure (ICP) monitors
      • 5.1.5. Cerebral oximeters
      • 5.1.6. Magnetic resonance imaging (MRI) devices
      • 5.1.7. Computerized tomography (CT) devices
      • 5.1.8. Positron emission tomography (PET) devices
      • 5.1.9. Sleep monitoring devices
      • 5.1.10. Electromyography (EMG) devices
    • 5.2. Accessories
      • 5.2.1. Electrodes
      • 5.2.2. Sensors
      • 5.2.3. Pastes & gels
      • 5.2.4. Caps
      • 5.2.5. Cables
      • 5.2.6. Batteries
      • 5.2.7. Others
  • 6. Global Market Analysis 2019 to 2023 and Forecast 2024 to 2034, By Procedure
    • 6.1. Invasive
    • 6.2. Non-invasive
  • 7. Global Market Analysis 2019 to 2023 and Forecast 2024 to 2034, By Application
    • 7.1. Traumatic brain injury (TBI)
    • 7.2. Stroke
    • 7.3. Dementia
    • 7.4. Headache disorders
    • 7.5. Sleep disorders
    • 7.6. Parkinson's disease
    • 7.7. Epilepsy
    • 7.8. Huntington's disease
    • 7.9. Other diseases
  • 8. Global Market Analysis 2019 to 2023 and Forecast 2024 to 2034, By End-User
    • 8.1. Hospitals
    • 8.2. Neurology Centres
    • 8.3. Clinics & ASC
  • 9. Global Market Analysis 2019 to 2023 and Forecast 2024 to 2034, By Region
    • 9.1. North America
    • 9.2. Latin America
    • 9.3. Western Europe
    • 9.4. Eastern Europe
    • 9.5. South Asia and Pacific
    • 9.6. East Asia
    • 9.7. Middle East and Africa
  • 10. North America Market Analysis 2019 to 2023 and Forecast 2024 to 2034, By Country
  • 11. Latin America Market Analysis 2019 to 2023 and Forecast 2024 to 2034, By Country
  • 12. Western Europe Market Analysis 2019 to 2023 and Forecast 2024 to 2034, By Country
  • 13. Eastern Europe Market Analysis 2019 to 2023 and Forecast 2024 to 2034, By Country
  • 14. South Asia and Pacific Market Analysis 2019 to 2023 and Forecast 2024 to 2034, By Country
  • 15. East Asia Market Analysis 2019 to 2023 and Forecast 2024 to 2034, By Country
  • 16. Middle East and Africa Market Analysis 2019 to 2023 and Forecast 2024 to 2034, By Country
  • 17. Key Countries Market Analysis
  • 18. Market Structure Analysis
  • 19. Competition Analysis
    • 19.1. Advanced Brain Monitoring, Inc.
    • 19.2. Drägerwerk AG & Co. KGaA
    • 19.3. Masimo Corporation
    • 19.4. Cadwell Industries, Inc.
    • 19.5. Neurowave Systems, Inc.
    • 19.6. Neurosoft
    • 19.7. CGX (A Cognionics Company)
    • 19.8. Natus Medical, Inc.
    • 19.9. Nihon Kohden Corporation
    • 19.10. Philips Healthcare
    • 19.11. GE Healthcare
    • 19.12. Siemens Healthineers
  • 20. Assumptions & Acronyms Used
  • 21. Research Methodology

List of Tables

Table 1: Global Market Value (US$ Million) Forecast by Region, 2019 to 2034

Table 2: Global Market Volume (Units) Forecast by Region, 2019 to 2034

Table 3: Global Market Value (US$ Million) Forecast by Product, 2019 to 2034

Table 4: Global Market Volume (Units) Forecast by Product, 2019 to 2034

Table 5: Global Market Value (US$ Million) Forecast by Procedure, 2019 to 2034

Table 6: Global Market Volume (Units) Forecast by Procedure, 2019 to 2034

Table 7: Global Market Value (US$ Million) Forecast by Application, 2019 to 2034

Table 8: Global Market Volume (Units) Forecast by Application, 2019 to 2034

Table 9: Global Market Value (US$ Million) Forecast by End-User, 2019 to 2034

Table 10: Global Market Volume (Units) Forecast by End-User, 2019 to 2034

Table 11: North America Market Value (US$ Million) Forecast by Country, 2019 to 2034

Table 12: North America Market Volume (Units) Forecast by Country, 2019 to 2034

Table 13: North America Market Value (US$ Million) Forecast by Product, 2019 to 2034

Table 14: North America Market Volume (Units) Forecast by Product, 2019 to 2034

Table 15: North America Market Value (US$ Million) Forecast by Procedure, 2019 to 2034

Table 16: North America Market Volume (Units) Forecast by Procedure, 2019 to 2034

Table 17: North America Market Value (US$ Million) Forecast by Application, 2019 to 2034

Table 18: North America Market Volume (Units) Forecast by Application, 2019 to 2034

Table 19: North America Market Value (US$ Million) Forecast by End-User, 2019 to 2034

Table 20: North America Market Volume (Units) Forecast by End-User, 2019 to 2034

Table 21: Latin America Market Value (US$ Million) Forecast by Country, 2019 to 2034

Table 22: Latin America Market Volume (Units) Forecast by Country, 2019 to 2034

Table 23: Latin America Market Value (US$ Million) Forecast by Product, 2019 to 2034

Table 24: Latin America Market Volume (Units) Forecast by Product, 2019 to 2034

Table 25: Latin America Market Value (US$ Million) Forecast by Procedure, 2019 to 2034

Table 26: Latin America Market Volume (Units) Forecast by Procedure, 2019 to 2034

Table 27: Latin America Market Value (US$ Million) Forecast by Application, 2019 to 2034

Table 28: Latin America Market Volume (Units) Forecast by Application, 2019 to 2034

Table 29: Latin America Market Value (US$ Million) Forecast by End-User, 2019 to 2034

Table 30: Latin America Market Volume (Units) Forecast by End-User, 2019 to 2034

Table 31: Western Europe Market Value (US$ Million) Forecast by Country, 2019 to 2034

Table 32: Western Europe Market Volume (Units) Forecast by Country, 2019 to 2034

Table 33: Western Europe Market Value (US$ Million) Forecast by Product, 2019 to 2034

Table 34: Western Europe Market Volume (Units) Forecast by Product, 2019 to 2034

Table 35: Western Europe Market Value (US$ Million) Forecast by Procedure, 2019 to 2034

Table 36: Western Europe Market Volume (Units) Forecast by Procedure, 2019 to 2034

Table 37: Western Europe Market Value (US$ Million) Forecast by Application, 2019 to 2034

Table 38: Western Europe Market Volume (Units) Forecast by Application, 2019 to 2034

Table 39: Western Europe Market Value (US$ Million) Forecast by End-User, 2019 to 2034

Table 40: Western Europe Market Volume (Units) Forecast by End-User, 2019 to 2034

Table 41: Eastern Europe Market Value (US$ Million) Forecast by Country, 2019 to 2034

Table 42: Eastern Europe Market Volume (Units) Forecast by Country, 2019 to 2034

Table 43: Eastern Europe Market Value (US$ Million) Forecast by Product, 2019 to 2034

Table 44: Eastern Europe Market Volume (Units) Forecast by Product, 2019 to 2034

Table 45: Eastern Europe Market Value (US$ Million) Forecast by Procedure, 2019 to 2034

Table 46: Eastern Europe Market Volume (Units) Forecast by Procedure, 2019 to 2034

Table 47: Eastern Europe Market Value (US$ Million) Forecast by Application, 2019 to 2034

Table 48: Eastern Europe Market Volume (Units) Forecast by Application, 2019 to 2034

Table 49: Eastern Europe Market Value (US$ Million) Forecast by End-User, 2019 to 2034

Table 50: Eastern Europe Market Volume (Units) Forecast by End-User, 2019 to 2034

Table 51: South Asia and Pacific Market Value (US$ Million) Forecast by Country, 2019 to 2034

Table 52: South Asia and Pacific Market Volume (Units) Forecast by Country, 2019 to 2034

Table 53: South Asia and Pacific Market Value (US$ Million) Forecast by Product, 2019 to 2034

Table 54: South Asia and Pacific Market Volume (Units) Forecast by Product, 2019 to 2034

Table 55: South Asia and Pacific Market Value (US$ Million) Forecast by Procedure, 2019 to 2034

Table 56: South Asia and Pacific Market Volume (Units) Forecast by Procedure, 2019 to 2034

Table 57: South Asia and Pacific Market Value (US$ Million) Forecast by Application, 2019 to 2034

Table 58: South Asia and Pacific Market Volume (Units) Forecast by Application, 2019 to 2034

Table 59: South Asia and Pacific Market Value (US$ Million) Forecast by End-User, 2019 to 2034

Table 60: South Asia and Pacific Market Volume (Units) Forecast by End-User, 2019 to 2034

Table 61: East Asia Market Value (US$ Million) Forecast by Country, 2019 to 2034

Table 62: East Asia Market Volume (Units) Forecast by Country, 2019 to 2034

Table 63: East Asia Market Value (US$ Million) Forecast by Product, 2019 to 2034

Table 64: East Asia Market Volume (Units) Forecast by Product, 2019 to 2034

Table 65: East Asia Market Value (US$ Million) Forecast by Procedure, 2019 to 2034

Table 66: East Asia Market Volume (Units) Forecast by Procedure, 2019 to 2034

Table 67: East Asia Market Value (US$ Million) Forecast by Application, 2019 to 2034

Table 68: East Asia Market Volume (Units) Forecast by Application, 2019 to 2034

Table 69: East Asia Market Value (US$ Million) Forecast by End-User, 2019 to 2034

Table 70: East Asia Market Volume (Units) Forecast by End-User, 2019 to 2034

Table 71: Middle East and Africa Market Value (US$ Million) Forecast by Country, 2019 to 2034

Table 72: Middle East and Africa Market Volume (Units) Forecast by Country, 2019 to 2034

Table 73: Middle East and Africa Market Value (US$ Million) Forecast by Product, 2019 to 2034

Table 74: Middle East and Africa Market Volume (Units) Forecast by Product, 2019 to 2034

Table 75: Middle East and Africa Market Value (US$ Million) Forecast by Procedure, 2019 to 2034

Table 76: Middle East and Africa Market Volume (Units) Forecast by Procedure, 2019 to 2034

Table 77: Middle East and Africa Market Value (US$ Million) Forecast by Application, 2019 to 2034

Table 78: Middle East and Africa Market Volume (Units) Forecast by Application, 2019 to 2034

Table 79: Middle East and Africa Market Value (US$ Million) Forecast by End-User, 2019 to 2034

Table 80: Middle East and Africa Market Volume (Units) Forecast by End-User, 2019 to 2034

List of Figures

Figure 1: Global Market Value (US$ Million) by Product, 2024 to 2034

Figure 2: Global Market Value (US$ Million) by Procedure, 2024 to 2034

Figure 3: Global Market Value (US$ Million) by Application, 2024 to 2034

Figure 4: Global Market Value (US$ Million) by End-User, 2024 to 2034

Figure 5: Global Market Value (US$ Million) by Region, 2024 to 2034

Figure 6: Global Market Value (US$ Million) Analysis by Region, 2019 to 2034

Figure 7: Global Market Volume (Units) Analysis by Region, 2019 to 2034

Figure 8: Global Market Value Share (%) and BPS Analysis by Region, 2024 to 2034

Figure 9: Global Market Y-o-Y Growth (%) Projections by Region, 2024 to 2034

Figure 10: Global Market Value (US$ Million) Analysis by Product, 2019 to 2034

Figure 11: Global Market Volume (Units) Analysis by Product, 2019 to 2034

Figure 12: Global Market Value Share (%) and BPS Analysis by Product, 2024 to 2034

Figure 13: Global Market Y-o-Y Growth (%) Projections by Product, 2024 to 2034

Figure 14: Global Market Value (US$ Million) Analysis by Procedure, 2019 to 2034

Figure 15: Global Market Volume (Units) Analysis by Procedure, 2019 to 2034

Figure 16: Global Market Value Share (%) and BPS Analysis by Procedure, 2024 to 2034

Figure 17: Global Market Y-o-Y Growth (%) Projections by Procedure, 2024 to 2034

Figure 18: Global Market Value (US$ Million) Analysis by Application, 2019 to 2034

Figure 19: Global Market Volume (Units) Analysis by Application, 2019 to 2034

Figure 20: Global Market Value Share (%) and BPS Analysis by Application, 2024 to 2034

Figure 21: Global Market Y-o-Y Growth (%) Projections by Application, 2024 to 2034

Figure 22: Global Market Value (US$ Million) Analysis by End-User, 2019 to 2034

Figure 23: Global Market Volume (Units) Analysis by End-User, 2019 to 2034

Figure 24: Global Market Value Share (%) and BPS Analysis by End-User, 2024 to 2034

Figure 25: Global Market Y-o-Y Growth (%) Projections by End-User, 2024 to 2034

Figure 26: Global Market Attractiveness by Product, 2024 to 2034

Figure 27: Global Market Attractiveness by Procedure, 2024 to 2034

Figure 28: Global Market Attractiveness by Application, 2024 to 2034

Figure 29: Global Market Attractiveness by End-User, 2024 to 2034

Figure 30: Global Market Attractiveness by Region, 2024 to 2034

Figure 31: North America Market Value (US$ Million) by Product, 2024 to 2034

Figure 32: North America Market Value (US$ Million) by Procedure, 2024 to 2034

Figure 33: North America Market Value (US$ Million) by Application, 2024 to 2034

Figure 34: North America Market Value (US$ Million) by End-User, 2024 to 2034

Figure 35: North America Market Value (US$ Million) by Country, 2024 to 2034

Figure 36: North America Market Value (US$ Million) Analysis by Country, 2019 to 2034

Figure 37: North America Market Volume (Units) Analysis by Country, 2019 to 2034

Figure 38: North America Market Value Share (%) and BPS Analysis by Country, 2024 to 2034

Figure 39: North America Market Y-o-Y Growth (%) Projections by Country, 2024 to 2034

Figure 40: North America Market Value (US$ Million) Analysis by Product, 2019 to 2034

Figure 41: North America Market Volume (Units) Analysis by Product, 2019 to 2034

Figure 42: North America Market Value Share (%) and BPS Analysis by Product, 2024 to 2034

Figure 43: North America Market Y-o-Y Growth (%) Projections by Product, 2024 to 2034

Figure 44: North America Market Value (US$ Million) Analysis by Procedure, 2019 to 2034

Figure 45: North America Market Volume (Units) Analysis by Procedure, 2019 to 2034

Figure 46: North America Market Value Share (%) and BPS Analysis by Procedure, 2024 to 2034

Figure 47: North America Market Y-o-Y Growth (%) Projections by Procedure, 2024 to 2034

Figure 48: North America Market Value (US$ Million) Analysis by Application, 2019 to 2034

Figure 49: North America Market Volume (Units) Analysis by Application, 2019 to 2034

Figure 50: North America Market Value Share (%) and BPS Analysis by Application, 2024 to 2034

Figure 51: North America Market Y-o-Y Growth (%) Projections by Application, 2024 to 2034

Figure 52: North America Market Value (US$ Million) Analysis by End-User, 2019 to 2034

Figure 53: North America Market Volume (Units) Analysis by End-User, 2019 to 2034

Figure 54: North America Market Value Share (%) and BPS Analysis by End-User, 2024 to 2034

Figure 55: North America Market Y-o-Y Growth (%) Projections by End-User, 2024 to 2034

Figure 56: North America Market Attractiveness by Product, 2024 to 2034

Figure 57: North America Market Attractiveness by Procedure, 2024 to 2034

Figure 58: North America Market Attractiveness by Application, 2024 to 2034

Figure 59: North America Market Attractiveness by End-User, 2024 to 2034

Figure 60: North America Market Attractiveness by Country, 2024 to 2034

Figure 61: Latin America Market Value (US$ Million) by Product, 2024 to 2034

Figure 62: Latin America Market Value (US$ Million) by Procedure, 2024 to 2034

Figure 63: Latin America Market Value (US$ Million) by Application, 2024 to 2034

Figure 64: Latin America Market Value (US$ Million) by End-User, 2024 to 2034

Figure 65: Latin America Market Value (US$ Million) by Country, 2024 to 2034

Figure 66: Latin America Market Value (US$ Million) Analysis by Country, 2019 to 2034

Figure 67: Latin America Market Volume (Units) Analysis by Country, 2019 to 2034

Figure 68: Latin America Market Value Share (%) and BPS Analysis by Country, 2024 to 2034

Figure 69: Latin America Market Y-o-Y Growth (%) Projections by Country, 2024 to 2034

Figure 70: Latin America Market Value (US$ Million) Analysis by Product, 2019 to 2034

Figure 71: Latin America Market Volume (Units) Analysis by Product, 2019 to 2034

Figure 72: Latin America Market Value Share (%) and BPS Analysis by Product, 2024 to 2034

Figure 73: Latin America Market Y-o-Y Growth (%) Projections by Product, 2024 to 2034

Figure 74: Latin America Market Value (US$ Million) Analysis by Procedure, 2019 to 2034

Figure 75: Latin America Market Volume (Units) Analysis by Procedure, 2019 to 2034

Figure 76: Latin America Market Value Share (%) and BPS Analysis by Procedure, 2024 to 2034

Figure 77: Latin America Market Y-o-Y Growth (%) Projections by Procedure, 2024 to 2034

Figure 78: Latin America Market Value (US$ Million) Analysis by Application, 2019 to 2034

Figure 79: Latin America Market Volume (Units) Analysis by Application, 2019 to 2034

Figure 80: Latin America Market Value Share (%) and BPS Analysis by Application, 2024 to 2034

Figure 81: Latin America Market Y-o-Y Growth (%) Projections by Application, 2024 to 2034

Figure 82: Latin America Market Value (US$ Million) Analysis by End-User, 2019 to 2034

Figure 83: Latin America Market Volume (Units) Analysis by End-User, 2019 to 2034

Figure 84: Latin America Market Value Share (%) and BPS Analysis by End-User, 2024 to 2034

Figure 85: Latin America Market Y-o-Y Growth (%) Projections by End-User, 2024 to 2034

Figure 86: Latin America Market Attractiveness by Product, 2024 to 2034

Figure 87: Latin America Market Attractiveness by Procedure, 2024 to 2034

Figure 88: Latin America Market Attractiveness by Application, 2024 to 2034

Figure 89: Latin America Market Attractiveness by End-User, 2024 to 2034

Figure 90: Latin America Market Attractiveness by Country, 2024 to 2034

Figure 91: Western Europe Market Value (US$ Million) by Product, 2024 to 2034

Figure 92: Western Europe Market Value (US$ Million) by Procedure, 2024 to 2034

Figure 93: Western Europe Market Value (US$ Million) by Application, 2024 to 2034

Figure 94: Western Europe Market Value (US$ Million) by End-User, 2024 to 2034

Figure 95: Western Europe Market Value (US$ Million) by Country, 2024 to 2034

Figure 96: Western Europe Market Value (US$ Million) Analysis by Country, 2019 to 2034

Figure 97: Western Europe Market Volume (Units) Analysis by Country, 2019 to 2034

Figure 98: Western Europe Market Value Share (%) and BPS Analysis by Country, 2024 to 2034

Figure 99: Western Europe Market Y-o-Y Growth (%) Projections by Country, 2024 to 2034

Figure 100: Western Europe Market Value (US$ Million) Analysis by Product, 2019 to 2034

Figure 101: Western Europe Market Volume (Units) Analysis by Product, 2019 to 2034

Figure 102: Western Europe Market Value Share (%) and BPS Analysis by Product, 2024 to 2034

Figure 103: Western Europe Market Y-o-Y Growth (%) Projections by Product, 2024 to 2034

Figure 104: Western Europe Market Value (US$ Million) Analysis by Procedure, 2019 to 2034

Figure 105: Western Europe Market Volume (Units) Analysis by Procedure, 2019 to 2034

Figure 106: Western Europe Market Value Share (%) and BPS Analysis by Procedure, 2024 to 2034

Figure 107: Western Europe Market Y-o-Y Growth (%) Projections by Procedure, 2024 to 2034

Figure 108: Western Europe Market Value (US$ Million) Analysis by Application, 2019 to 2034

Figure 109: Western Europe Market Volume (Units) Analysis by Application, 2019 to 2034

Figure 110: Western Europe Market Value Share (%) and BPS Analysis by Application, 2024 to 2034

Figure 111: Western Europe Market Y-o-Y Growth (%) Projections by Application, 2024 to 2034

Figure 112: Western Europe Market Value (US$ Million) Analysis by End-User, 2019 to 2034

Figure 113: Western Europe Market Volume (Units) Analysis by End-User, 2019 to 2034

Figure 114: Western Europe Market Value Share (%) and BPS Analysis by End-User, 2024 to 2034

Figure 115: Western Europe Market Y-o-Y Growth (%) Projections by End-User, 2024 to 2034

Figure 116: Western Europe Market Attractiveness by Product, 2024 to 2034

Figure 117: Western Europe Market Attractiveness by Procedure, 2024 to 2034

Figure 118: Western Europe Market Attractiveness by Application, 2024 to 2034

Figure 119: Western Europe Market Attractiveness by End-User, 2024 to 2034

Figure 120: Western Europe Market Attractiveness by Country, 2024 to 2034

Figure 121: Eastern Europe Market Value (US$ Million) by Product, 2024 to 2034

Figure 122: Eastern Europe Market Value (US$ Million) by Procedure, 2024 to 2034

Figure 123: Eastern Europe Market Value (US$ Million) by Application, 2024 to 2034

Figure 124: Eastern Europe Market Value (US$ Million) by End-User, 2024 to 2034

Figure 125: Eastern Europe Market Value (US$ Million) by Country, 2024 to 2034

Figure 126: Eastern Europe Market Value (US$ Million) Analysis by Country, 2019 to 2034

Figure 127: Eastern Europe Market Volume (Units) Analysis by Country, 2019 to 2034

Figure 128: Eastern Europe Market Value Share (%) and BPS Analysis by Country, 2024 to 2034

Figure 129: Eastern Europe Market Y-o-Y Growth (%) Projections by Country, 2024 to 2034

Figure 130: Eastern Europe Market Value (US$ Million) Analysis by Product, 2019 to 2034

Figure 131: Eastern Europe Market Volume (Units) Analysis by Product, 2019 to 2034

Figure 132: Eastern Europe Market Value Share (%) and BPS Analysis by Product, 2024 to 2034

Figure 133: Eastern Europe Market Y-o-Y Growth (%) Projections by Product, 2024 to 2034

Figure 134: Eastern Europe Market Value (US$ Million) Analysis by Procedure, 2019 to 2034

Figure 135: Eastern Europe Market Volume (Units) Analysis by Procedure, 2019 to 2034

Figure 136: Eastern Europe Market Value Share (%) and BPS Analysis by Procedure, 2024 to 2034

Figure 137: Eastern Europe Market Y-o-Y Growth (%) Projections by Procedure, 2024 to 2034

Figure 138: Eastern Europe Market Value (US$ Million) Analysis by Application, 2019 to 2034

Figure 139: Eastern Europe Market Volume (Units) Analysis by Application, 2019 to 2034

Figure 140: Eastern Europe Market Value Share (%) and BPS Analysis by Application, 2024 to 2034

Figure 141: Eastern Europe Market Y-o-Y Growth (%) Projections by Application, 2024 to 2034

Figure 142: Eastern Europe Market Value (US$ Million) Analysis by End-User, 2019 to 2034

Figure 143: Eastern Europe Market Volume (Units) Analysis by End-User, 2019 to 2034

Figure 144: Eastern Europe Market Value Share (%) and BPS Analysis by End-User, 2024 to 2034

Figure 145: Eastern Europe Market Y-o-Y Growth (%) Projections by End-User, 2024 to 2034

Figure 146: Eastern Europe Market Attractiveness by Product, 2024 to 2034

Figure 147: Eastern Europe Market Attractiveness by Procedure, 2024 to 2034

Figure 148: Eastern Europe Market Attractiveness by Application, 2024 to 2034

Figure 149: Eastern Europe Market Attractiveness by End-User, 2024 to 2034

Figure 150: Eastern Europe Market Attractiveness by Country, 2024 to 2034

Figure 151: South Asia and Pacific Market Value (US$ Million) by Product, 2024 to 2034

Figure 152: South Asia and Pacific Market Value (US$ Million) by Procedure, 2024 to 2034

Figure 153: South Asia and Pacific Market Value (US$ Million) by Application, 2024 to 2034

Figure 154: South Asia and Pacific Market Value (US$ Million) by End-User, 2024 to 2034

Figure 155: South Asia and Pacific Market Value (US$ Million) by Country, 2024 to 2034

Figure 156: South Asia and Pacific Market Value (US$ Million) Analysis by Country, 2019 to 2034

Figure 157: South Asia and Pacific Market Volume (Units) Analysis by Country, 2019 to 2034

Figure 158: South Asia and Pacific Market Value Share (%) and BPS Analysis by Country, 2024 to 2034

Figure 159: South Asia and Pacific Market Y-o-Y Growth (%) Projections by Country, 2024 to 2034

Figure 160: South Asia and Pacific Market Value (US$ Million) Analysis by Product, 2019 to 2034

Figure 161: South Asia and Pacific Market Volume (Units) Analysis by Product, 2019 to 2034

Figure 162: South Asia and Pacific Market Value Share (%) and BPS Analysis by Product, 2024 to 2034

Figure 163: South Asia and Pacific Market Y-o-Y Growth (%) Projections by Product, 2024 to 2034

Figure 164: South Asia and Pacific Market Value (US$ Million) Analysis by Procedure, 2019 to 2034

Figure 165: South Asia and Pacific Market Volume (Units) Analysis by Procedure, 2019 to 2034

Figure 166: South Asia and Pacific Market Value Share (%) and BPS Analysis by Procedure, 2024 to 2034

Figure 167: South Asia and Pacific Market Y-o-Y Growth (%) Projections by Procedure, 2024 to 2034

Figure 168: South Asia and Pacific Market Value (US$ Million) Analysis by Application, 2019 to 2034

Figure 169: South Asia and Pacific Market Volume (Units) Analysis by Application, 2019 to 2034

Figure 170: South Asia and Pacific Market Value Share (%) and BPS Analysis by Application, 2024 to 2034

Figure 171: South Asia and Pacific Market Y-o-Y Growth (%) Projections by Application, 2024 to 2034

Figure 172: South Asia and Pacific Market Value (US$ Million) Analysis by End-User, 2019 to 2034

Figure 173: South Asia and Pacific Market Volume (Units) Analysis by End-User, 2019 to 2034

Figure 174: South Asia and Pacific Market Value Share (%) and BPS Analysis by End-User, 2024 to 2034

Figure 175: South Asia and Pacific Market Y-o-Y Growth (%) Projections by End-User, 2024 to 2034

Figure 176: South Asia and Pacific Market Attractiveness by Product, 2024 to 2034

Figure 177: South Asia and Pacific Market Attractiveness by Procedure, 2024 to 2034

Figure 178: South Asia and Pacific Market Attractiveness by Application, 2024 to 2034

Figure 179: South Asia and Pacific Market Attractiveness by End-User, 2024 to 2034

Figure 180: South Asia and Pacific Market Attractiveness by Country, 2024 to 2034

Figure 181: East Asia Market Value (US$ Million) by Product, 2024 to 2034

Figure 182: East Asia Market Value (US$ Million) by Procedure, 2024 to 2034

Figure 183: East Asia Market Value (US$ Million) by Application, 2024 to 2034

Figure 184: East Asia Market Value (US$ Million) by End-User, 2024 to 2034

Figure 185: East Asia Market Value (US$ Million) by Country, 2024 to 2034

Figure 186: East Asia Market Value (US$ Million) Analysis by Country, 2019 to 2034

Figure 187: East Asia Market Volume (Units) Analysis by Country, 2019 to 2034

Figure 188: East Asia Market Value Share (%) and BPS Analysis by Country, 2024 to 2034

Figure 189: East Asia Market Y-o-Y Growth (%) Projections by Country, 2024 to 2034

Figure 190: East Asia Market Value (US$ Million) Analysis by Product, 2019 to 2034

Figure 191: East Asia Market Volume (Units) Analysis by Product, 2019 to 2034

Figure 192: East Asia Market Value Share (%) and BPS Analysis by Product, 2024 to 2034

Figure 193: East Asia Market Y-o-Y Growth (%) Projections by Product, 2024 to 2034

Figure 194: East Asia Market Value (US$ Million) Analysis by Procedure, 2019 to 2034

Figure 195: East Asia Market Volume (Units) Analysis by Procedure, 2019 to 2034

Figure 196: East Asia Market Value Share (%) and BPS Analysis by Procedure, 2024 to 2034

Figure 197: East Asia Market Y-o-Y Growth (%) Projections by Procedure, 2024 to 2034

Figure 198: East Asia Market Value (US$ Million) Analysis by Application, 2019 to 2034

Figure 199: East Asia Market Volume (Units) Analysis by Application, 2019 to 2034

Figure 200: East Asia Market Value Share (%) and BPS Analysis by Application, 2024 to 2034

Figure 201: East Asia Market Y-o-Y Growth (%) Projections by Application, 2024 to 2034

Figure 202: East Asia Market Value (US$ Million) Analysis by End-User, 2019 to 2034

Figure 203: East Asia Market Volume (Units) Analysis by End-User, 2019 to 2034

Figure 204: East Asia Market Value Share (%) and BPS Analysis by End-User, 2024 to 2034

Figure 205: East Asia Market Y-o-Y Growth (%) Projections by End-User, 2024 to 2034

Figure 206: East Asia Market Attractiveness by Product, 2024 to 2034

Figure 207: East Asia Market Attractiveness by Procedure, 2024 to 2034

Figure 208: East Asia Market Attractiveness by Application, 2024 to 2034

Figure 209: East Asia Market Attractiveness by End-User, 2024 to 2034

Figure 210: East Asia Market Attractiveness by Country, 2024 to 2034

Figure 211: Middle East and Africa Market Value (US$ Million) by Product, 2024 to 2034

Figure 212: Middle East and Africa Market Value (US$ Million) by Procedure, 2024 to 2034

Figure 213: Middle East and Africa Market Value (US$ Million) by Application, 2024 to 2034

Figure 214: Middle East and Africa Market Value (US$ Million) by End-User, 2024 to 2034

Figure 215: Middle East and Africa Market Value (US$ Million) by Country, 2024 to 2034

Figure 216: Middle East and Africa Market Value (US$ Million) Analysis by Country, 2019 to 2034

Figure 217: Middle East and Africa Market Volume (Units) Analysis by Country, 2019 to 2034

Figure 218: Middle East and Africa Market Value Share (%) and BPS Analysis by Country, 2024 to 2034

Figure 219: Middle East and Africa Market Y-o-Y Growth (%) Projections by Country, 2024 to 2034

Figure 220: Middle East and Africa Market Value (US$ Million) Analysis by Product, 2019 to 2034

Figure 221: Middle East and Africa Market Volume (Units) Analysis by Product, 2019 to 2034

Figure 222: Middle East and Africa Market Value Share (%) and BPS Analysis by Product, 2024 to 2034

Figure 223: Middle East and Africa Market Y-o-Y Growth (%) Projections by Product, 2024 to 2034

Figure 224: Middle East and Africa Market Value (US$ Million) Analysis by Procedure, 2019 to 2034

Figure 225: Middle East and Africa Market Volume (Units) Analysis by Procedure, 2019 to 2034

Figure 226: Middle East and Africa Market Value Share (%) and BPS Analysis by Procedure, 2024 to 2034

Figure 227: Middle East and Africa Market Y-o-Y Growth (%) Projections by Procedure, 2024 to 2034

Figure 228: Middle East and Africa Market Value (US$ Million) Analysis by Application, 2019 to 2034

Figure 229: Middle East and Africa Market Volume (Units) Analysis by Application, 2019 to 2034

Figure 230: Middle East and Africa Market Value Share (%) and BPS Analysis by Application, 2024 to 2034

Figure 231: Middle East and Africa Market Y-o-Y Growth (%) Projections by Application, 2024 to 2034

Figure 232: Middle East and Africa Market Value (US$ Million) Analysis by End-User, 2019 to 2034

Figure 233: Middle East and Africa Market Volume (Units) Analysis by End-User, 2019 to 2034

Figure 234: Middle East and Africa Market Value Share (%) and BPS Analysis by End-User, 2024 to 2034

Figure 235: Middle East and Africa Market Y-o-Y Growth (%) Projections by End-User, 2024 to 2034

Figure 236: Middle East and Africa Market Attractiveness by Product, 2024 to 2034

Figure 237: Middle East and Africa Market Attractiveness by Procedure, 2024 to 2034

Figure 238: Middle East and Africa Market Attractiveness by Application, 2024 to 2034

Figure 239: Middle East and Africa Market Attractiveness by End-User, 2024 to 2034

Figure 240: Middle East and Africa Market Attractiveness by Country, 2024 to 2034

Frequently Asked Questions

How Big is the Brain Monitoring Market?

The brain monitoring market is valued at USD 6.7 billion in 2024.

What is the Projected CAGR of the Brain Monitoring Market?

The brain monitoring market size is estimated to increase at a 6.5% CAGR through 2034.

What is the Future Outlook for the Brain Monitoring Market?

The brain monitoring market is anticipated to be worth USD 12.5 billion by 2034.

Which is the Leading Product in the Brain Monitoring Market?

Brain monitoring devices witness high demand in the industry.

Which Country is Rising at a Higher CAGR in the Brain Monitoring Market?

The brain monitoring market in South Korea is predicted to rise at an 8.3% CAGR through 2034.

Explore Similar Insights

Future Market Insights

Brain Monitoring Market