Bovine Brain Extract Size and Share Forecast Outlook 2025 to 2035

The bovine brain extract market is projected to attain a valuation of USD 555.6 million in 2025, expanding to approximately USD 1,003.4 million by 2035. This increase of USD 447.8 million over the decade translates to a growth of over 80.6%, effectively reflecting a 2X expansion in market size. The compound annual growth rate (CAGR) during this period has been estimated at 6.1%, underscoring a steady, demand-driven expansion supported by rising applications in cognitive support, neurological recovery, and advanced nutritional supplementation.
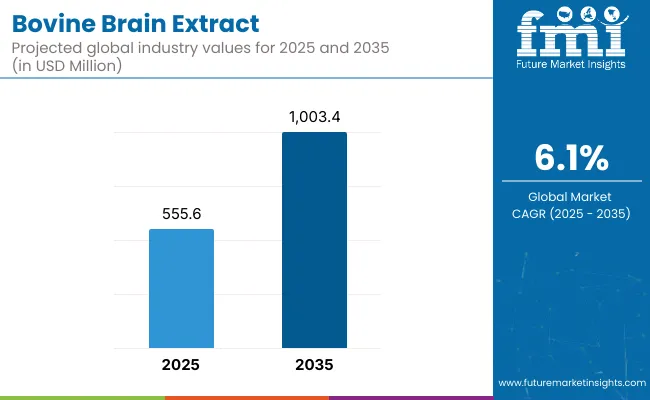
Quick Stats for Bovine Brain Extract

  • Bovine Brain Extract Value (2025): USD 555.6 million
  • Bovine Brain Extract Forecast Value (2035): USD 1,003.4 million
  • Bovine Brain Extract Forecast CAGR: 6.1%
  • Leading Segment in Bovine Brain Extract in 2025: Encapsulated Supplements (25%)
  • Key Growth Regions in the Bovine Brain Extract: North America, Asia-Pacific, Europe
  • Top Key Players in Bovine Brain Extract: Sigma Aldrich (Merck KGaA), Lonza Group, ATCC, MP Biomedicals, Cell Applications Inc., Thomas Scientific, Viscoll (Livecell™), Beijing Hongrun Baoshun Technology Co., Ltd., Hangzhou Panta Trading Co., Ltd., and MorNatural Health Solutions

Bovine Brain Extract

Bovine Brain Extract Key Takeaways

Metric Value
Estimated Value in (2025E) USD 555.6 million
Extract Forecast Value in (2035F) USD 1,003.4 million
Forecast CAGR (2025 to 2035) 6.1%

During the first half of the forecast period (2025-2030), the market is expected to rise from USD 555.6 million to nearly USD 745.0 million, adding USD 189.4 million, which accounts for approximately 42.3% of the total decade’s growth. This growth phase is likely to be influenced by increasing adoption in encapsulated supplement formulations and early clinical exploration into neuro-regenerative ingredients. Significant gains are anticipated in cognitive health support, particularly within North American and European markets, where regulatory familiarity and consumer awareness are more mature.

In the second phase (2030-2035), the market is projected to increase by USD 258.4 million, contributing the remaining 57.7% of the total growth, and reaching the USD 1 billion milestone. This acceleration is expected to be driven by wider integration of bovine brain-derived peptides into medical nutrition, functional food products, and cosmeceutical formulations. Supplementation formats with enhanced bioavailability, supported by clinical validation and digitized personalization, are expected to reshape consumer engagement and value delivery across the market.

From 2020 to 2024, the bovine brain extract market grew from an estimated USD ~410 million to USD 555.6 million, driven primarily by demand for pharmaceutical-grade and encapsulated cognitive support solutions. During this period, the competitive landscape was led by biological material suppliers, who held a dominant share by offering standardized, research-ready formulations across regulated industries.

Growth was driven by academic research, early cosmeceutical exploration, and clinical interest in neuro-supportive bioactives. Service-based models including custom formulation, GMP certification support, and regulatory documentation contributed under 15% of market value but showed rising potential.

By 2025, demand is expected to surpass USD 555.6 million, with revenue share gradually shifting toward functional and cosmetic-grade innovations. Traditional bulk extract suppliers are now facing competition from digitally integrated nutraceutical brands and therapeutic peptide formulators, offering enhanced traceability, application-specific peptides, and regionally customized delivery systems. Competitive advantage is moving beyond raw extract volume to ecosystem integration, bioavailability optimization, and B2B customization at scale.

Why the Bovine Brain Extract is growing?

The growth of the bovine brain extract market is being propelled by rising interest in neurotrophic and bioactive compounds derived from animal organ sources. A resurgence in demand for cognitive enhancement supplements and neurological support formulations has been observed, particularly among aging populations and individuals with neurodegenerative conditions. Bovine brain extract has been positioned as a promising ingredient due to its richness in phospholipids, peptides, and other neuro-supportive constituents.

Greater scientific validation and improved extraction technologies have allowed for more efficient isolation of targeted compounds, enhancing product standardization and safety. Additionally, the shift toward natural and organ-specific nootropics is expected to support sustained consumer adoption.

Application expansion into cosmeceuticals and functional nutrition is also underway, driven by interest in regenerative skincare and medical nutrition. Regulatory adaptability and rising R&D investments by supplement manufacturers have further contributed to market momentum. Going forward, greater personalization and formulation innovation are anticipated to unlock untapped potential across global markets.

Segmental Analysis

The bovine brain extract market has been segmented across product type, application, purity grade, source, sales channel, and end user to offer a comprehensive view of demand drivers and consumption behavior. Product segmentation ranges from raw extracts and injectable formulations to encapsulated supplements and functional ingredients.

Application-wise, utilization spans cognitive support, neurological regeneration, and dermatological or pharmaceutical end-uses. Purity grades such as pharmaceutical, food, and cosmetic categories have been adopted to suit regulatory and therapeutic requirements. The market has also been bifurcated by source, with both organic and conventional extraction pathways being pursued.

On the distribution front, sales channels include pharmacies, supplement manufacturers, online platforms, and institutional buyers. Finally, a diverse end-user base encompassing clinics, nutraceutical firms, cosmetic brands, and research institutions has been targeted, each with unique specification standards and purchasing behavior.
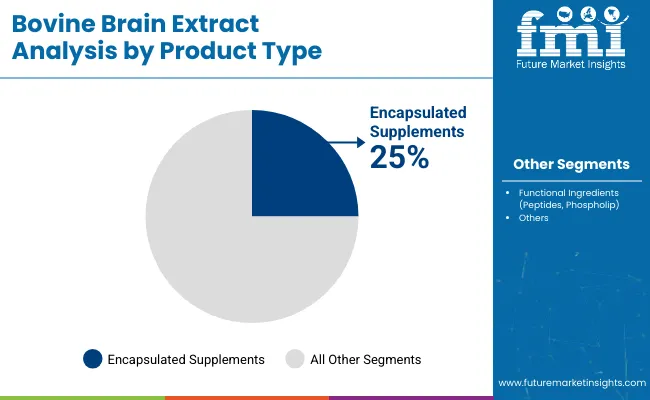
Insights into the Product Type Segment with Encapsulated Supplements Leading in Market Share

Bovine Brain Extract By Product

Product Type Segment Market Value Share, 2025
Encapsulated Supplements (Capsules, Tablets) 25%
Functional Ingredients (Peptides, Phospholipids) 22%

The encapsulated supplements segment is projected to capture 25% of total revenue in 2025, driven by growing consumer acceptance of easy-to-consume, over-the-counter neuro-nutritional products. These formulations have been preferred due to their portability, shelf stability, and ability to deliver standardized dosages of bioactive compounds.

Manufacturers are prioritizing capsule and tablet formats to support scalability and consumer familiarity. Functional ingredients have followed closely, contributing 22%, as demand for phospholipid- and peptide-enriched solutions grows across clinical and wellness applications. Meanwhile, injectable formulations and cosmetic extracts are expected to grow faster over the decade due to expanding niche applications and higher-value positioning.
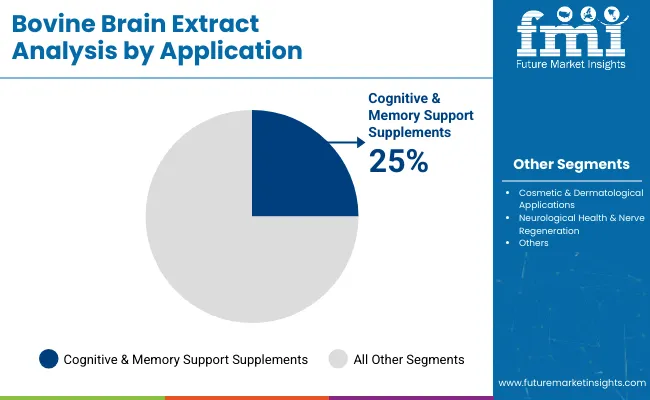
Insights into the Application Segment with Cognitive & Memory Support Supplements Dominating the Demand

Bovine Brain Extract By Application

Application Segment Market Value Share, 2025
Cognitive & Memory Support Supplements 25%
Cosmetic & Dermatological Applications 22%
Neurological Health & Nerve Regeneration 20%

Cognitive & memory support applications are forecasted to lead with a 25% share in 2025, underpinned by rising demand for neuroprotective supplementation in aging populations and performance-focused consumers. Products in this category are being positioned as daily-use cognitive enhancers, with bovine brain extract marketed for its naturally occurring phosphatidylserine, sphingolipids, and other neuro-nutrients.

Cosmetic and dermatological uses, with a 22% share, are rapidly expanding due to the inclusion of bioactive peptides in anti-aging creams and skin renewal solutions. Neurological regeneration and medical nutrition are also expected to attract greater clinical investment due to their high relevance in managing neurodegenerative conditions.
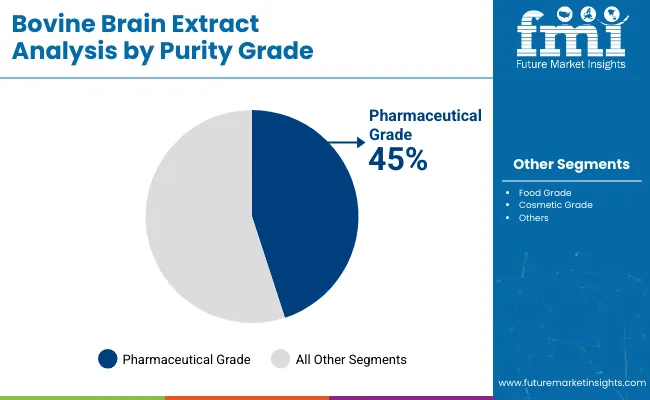
Insights into the Purity GradeSegment with Focus on Pharmaceutical Grade

Bovine Brain Extract By Purity

Purity Grade Market Value Share, 2025
Pharmaceutical Grade 45%
Food Grade 35%
Cosmetic Grade 20%

Pharmaceutical-grade bovine brain extract is set to dominate with a 45% market share in 2025, reflecting its widespread use in clinical and therapeutic formulations, especially injectables and medical nutrition solutions. Regulatory demands for traceability, sterility, and therapeutic consistency have made this grade the preferred choice among clinical buyers and R&D institutions. This segment has benefited from advanced purification processes and strict compliance with pharmacopeial standards.

Food-grade products, comprising 35%, continue to serve the functional food and dietary supplement sectors. Cosmetic-grade extracts account for 20%, with increased use in skin-enhancing topical formulations. Going forward, advancements in purification and traceability are expected to further enhance demand for pharmaceutical-grade materials, especially in regulated markets.

What are the Drivers, Restraints, and Key Trends of the Bovine Brain Extract?

Regulatory sensitivity and source authenticity concerns continue to challenge wider adoption of bovine brain extract, even as demand accelerates across cognitive health, neurological therapy, and cosmetic formulations. Technological refinement and bioactivity validation remain central to unlocking mainstream integration across global supplement and medical markets.

Rising Demand for Neuroprotective and Nootropic Ingredients in Preventive Healthcare

Growing awareness of neurodegenerative disorders and mental performance optimization has fueled demand for naturally sourced nootropic compounds. Bovine brain extract has been increasingly positioned as a valuable source of phosphatidylserine, sphingolipids, and neuroactive peptides compounds known to support cognitive resilience, memory retention, and synaptic repair.

The ingredient’s origin in organ-specific bioactivity has aligned with evolving consumer preferences for targeted, nature-derived solutions in brain health. Supplement manufacturers have responded by launching standardized formulations for daily cognitive support, particularly in aging populations and knowledge-driven workforce segments. As preventive neurology continues to be prioritized in both clinical and wellness sectors, demand for such specialized ingredients is expected to remain resilient.

Ethical, Religious, and Regulatory Scrutiny Over Animal-Derived Neuroextracts

Despite functional efficacy, adoption has been hindered by regulatory ambiguity and consumer hesitancy surrounding animal organ extracts, particularly those sourced from bovine neurological tissue. Concerns related to disease transmission (e.g., prion risks), ethical considerations, and religious dietary laws have led to cautious policy environments in several markets.

Product approvals often require exhaustive traceability, purification, and GMP certification, increasing entry barriers for new players. In religiously sensitive regions, demand remains restricted, and plant-based cognitive alternatives are being preferred. As clean-label and ethical sourcing pressures intensify, only rigorously controlled, transparently labeled bovine extracts are expected to gain regulatory and consumer acceptance.
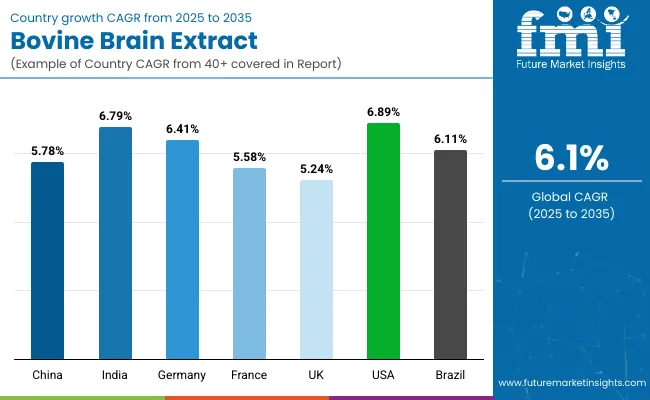
Analysis of Bovine Brain Extractby Key Countries

Bovine Brain Extract By Country

Countries CAGR
China 5.78%
India 6.79%
Germany 6.41%
France 5.58%
UK 5.24%
USA 6.89%
Brazil 6.11%

The global bovine brain extract market is expected to display considerable variability in growth rates across key countries, shaped by diverse factors such as regulatory stringency, healthcare infrastructure, consumer receptivity to organ-derived nutraceuticals, and manufacturing capabilities.

North America, particularly the United States, is forecasted to lead with a CAGR of 6.89%, supported by strong nutraceutical innovation pipelines, favorable clinical trial infrastructure, and established consumer awareness regarding cognitive health supplements. Advanced regulatory mechanisms and rising demand for precision neuro-nutrition have further reinforced USA market maturity.

In India, growth is projected at 6.79%, driven by expanding preventive healthcare trends, increased acceptance of organ-based wellness solutions in traditional and integrative medicine, and a rapidly formalizing supplement distribution ecosystem. Cost-effective production environments and a growing domestic demand for brain health supplements are expected to sustain upward momentum.

Germany is poised to expand at a 6.41% CAGR, propelled by stringent pharmaceutical-grade standards and a strong consumer base for clinically validated functional ingredients. Meanwhile, China is anticipated to grow at 5.78%, reflecting a cautious yet steady integration of bovine-sourced extracts within cosmeceutical and neurological applications, amid evolving regulatory clarity.

Slower growth in France (5.58%) and the UK (5.24%) reflects regional ethical sensitivities and a growing shift toward plant-based nootropics. Brazil, at 6.11%, is projected to benefit from rising nutraceutical penetration and localized sourcing initiatives within Latin America.

Sales Outlook for Bovine Brain Extract in the United States

Year USA Bovine Brain Extract
2025 133.3
2026 140.1
2027 147.9
2028 155.7
2029 165.6
2030 176.8
2031 186.5
2032 198.6
2033 212.4
2034 225.5
2035 240.1

The bovine brain extract market in the United States is projected to grow at a CAGR of 6.89% between 2025 and 2035, reflecting strong alignment with the country’s expanding nutraceutical, clinical nutrition, and anti-aging wellness sectors.

This growth has been underpinned by increasing investment in functional supplements targeting cognitive decline and memory enhancement among aging populations. Advanced clinical validation and stringent product quality standards have helped position USA-manufactured bovine brain extract as a trusted source for pharmaceutical-grade and food-grade formulations.

Demand has been notably high from neurological research centers and nutraceutical firms, especially those focusing on therapeutic interventions for age-related cognitive disorders. Use in formulated capsules and cognitive support blends has seen sustained year-on-year adoption, supported by e-commerce distribution and practitioner-led product endorsements. Furthermore, the cosmetic industry has been integrating bovine-derived peptides in regenerative dermatology applications, contributing to segmental expansion.

  • Nutraceutical manufacturers are increasingly leveraging bovine brain extract for senior-focused cognitive blends.
  • Medical nutrition brands have integrated the ingredient into personalized therapeutic diets.
  • Cosmeceutical companies are formulating anti-aging skin repair solutions using peptide-rich extracts.

As regulatory frameworks continue to favor organ-based bioactives with traceable sourcing, the USA market is expected to retain its leadership in product innovation and premium-grade production.

Growth and Expansion Outlook for Bovine Brain Extract in the United Kingdom

The bovine brain extract market in the United Kingdom is projected to expand steadily at a CAGR of 5.24%, supported by niche demand in cognitive health and dermatological innovation. Adoption has remained restrained by ethical concerns and religious preferences, yet significant traction has been observed in premium wellness channels.

Pharmaceutical-grade formats have gained favor in clinical and institutional settings, particularly among senior health and memory-care formulations. Cosmetic brands are exploring bioactive peptides for skin rejuvenation, where efficacy and origin traceability are prioritized.

  • Ethical and clean-label sourcing has been prioritized for consumer confidence.
  • Memory enhancement formulations are being tailored for aging demographics.
  • Clinics and luxury cosmetic brands are exploring neuropeptides in skincare.
  • Online and specialty retail platforms are expanding category visibility.

Growth and Expansion Outlook for Bovine Brain Extract in India

India’s bovine brain extract market is forecasted to grow at a robust CAGR of 6.79%, supported by increasing demand for traditional and functional wellness solutions. A strong inclination toward natural healing and ayurvedic integration has enabled early acceptance of bovine-derived ingredients in cognitive support and neurological recovery.

B2B nutraceutical manufacturers are actively adopting pharmaceutical- and food-grade extracts, with affordability and localized sourcing emerging as key value drivers. Improved regulatory support and evolving clinical validation frameworks are expected to reinforce trust among consumers.

  • Ayurveda and integrative health systems are fostering early adoption.
  • Cognitive supplements are being positioned in affordable wellness formats.
  • Domestic manufacturing is supporting cost-effective B2B supply.
  • Research centers are validating brain-specific peptide functionality.

Sales Outlook for Bovine Brain Extractin China

In China, the bovine brain extract market is anticipated to grow at a CAGR of 5.78%, shaped by cautious regulatory progression and rising interest in organ-derived skincare and neuro-wellness. Although stringent animal-based product scrutiny has limited mass-market access, premium cosmetic and nutraceutical brands have begun formulating peptide-rich products with verified sourcing.

Urban populations are increasingly seeking high-function wellness ingredients, especially those associated with brain performance and skin renewal. Tier-1 markets have been the first movers in embracing therapeutic extracts via direct-to-consumer and premium channels.

  • High-end skincare products are incorporating bovine peptides for dermal repair.
  • Cognitive performance products are being piloted in urban wellness chains.
  • Regulatory focus is centered on traceability and safety verification.
  • Growth is led by Tier-1 cities and luxury e-commerce platforms.

In-depth Analysis of Bovine Brain Extractin Europe

Countries 2025
UK 20.1%
Germany 21.3%
Italy 9.1%
France 14.3%
Spain 9.7%
BENELUX 6.5%
Nordic 5.8%
Rest of Europe 13.2%
Countries 2035
UK 18.0%
Germany 21.9%
Italy 11.7%
France 12.8%
Spain 9.6%
BENELUX 5.7%
Nordic 6.0%
Rest of Europe 14.3%

Germany’s bovine brain extract market is projected to expand at a CAGR of 6.41%, backed by a structured nutraceutical ecosystem and strong consumer demand for scientifically validated ingredients. Pharmaceutical-grade extracts are favored in clinical nutrition and cognitive therapy markets, where formulation consistency and safety credentials are non-negotiable.

Dermatological clinics are increasingly adopting peptide-based actives in anti-aging and skin-repair regimens. The country’s regulatory alignment with EU food and supplement policies has enabled smoother market entry, particularly for GMP-compliant suppliers offering therapeutic-grade ingredients.

  • Medical buyers prefer pharmaceutical-grade extracts for therapeutic nutrition.
  • Cosmeceutical firms are using neuropeptides in anti-aging skincare.
  • Scientific substantiation is central to consumer trust and adoption.
  • Compliance with EU regulations accelerates category penetration.

Growth Outlook for Bovine Brain Extract in Japan

Product Type Segment Market Value Share, 2025
Raw Bovine Brain Extract (Concentrates, Powders) 18.0%
Encapsulated Supplements (Capsules, Tablets) 28.0%
Injectable Formulations (for Medical Use) 16.0%
Functional Ingredients (Peptides, Phospholipids) 23.0%
Cosmetic Ingredients (Anti aging, Skin Repair) 15.0%

The bovine brain extract market in Japan is projected to reach a value of USD 23.4 million in 2025, with encapsulated supplements contributing 28% andfunctional ingredients accounting for 23% of total market value. This product-level split reflects Japan’s prioritization of convenience, safety, and clinical substantiation in both consumer wellness and therapeutic formulations.

Encapsulated formats have gained traction due to their pharmaceutical-like delivery and compliance with dosage precision standards. Functional ingredients particularly neuroactive peptides and phospholipids are being explored in clinical nutrition and premium food categories.

This product trend has been shaped by Japan’s aging population and a cultural inclination toward preventive care, where brain health and longevity are focal priorities. Moreover, cosmetic applications are rising in relevance, with bovine-derived peptides being formulated into anti-aging skincare under strict quality controls. Injectable formulations remain more niche, used primarily in research-based and controlled clinical environments.

  • Japan contributes 10.2% to the global bovine brain extract market in 2025.
  • Encapsulated supplements lead at 28%, followed by functional ingredients at 23%.
  • Market growth is supported by healthy aging trends and therapeutic-grade formulations
  • Pharmaceutical-grade compliance and bioactive innovation shape competitive advantage

Opportunity Analysis of South Korea Bovine Brain Extract

Application Segment Market Value Share, 2025
Cognitive & Memory Support Supplements 27.0%
Neurological Health & Nerve Regeneration 19.0%
Medical Nutrition (Neurodegenerative Disease Support) 17.0%
Cosmetic & Dermatological Applications 22.0%
Research & Pharmaceutical Use 15.0%

The bovine brain extract market in South Korea is projected to reach USD 16.7 million in 2025, with Cognitive & Memory Support Supplements leading at 27%, followed closely by Cosmetic & Dermatological Applications at 22%. This distribution reflects the country’s advanced functional food culture and high consumer engagement with bio-enhanced wellness products. Cognitive support supplements are being widely adopted by both aging adults and high-performance professionals, where demand for neuroactive peptides and brain-boosting nutrients continues to rise.

The cosmeceutical industry in South Korea globally recognized for innovation and skin science leadership has also begun integrating bovine-derived peptides into anti-aging and cell-regeneration skincare lines. Clinical trials and dermatological endorsements are expected to further accelerate this segment.

Neurological regeneration and medical nutrition are being explored through research alliances between biotech firms and hospitals, highlighting South Korea’s role in therapeutic innovation. R&D institutions are showing increasing interest in bovine brain extract as a potential candidate in neurodegenerative disease models and advanced brain health research.

  • Cognitive support and cosmeceutical applications lead at 27% and 22% respectively
  • Consumer focus on brain health and skin aging drives dual-segment growth
  • Academic and biotech collaboration fuels early-stage therapeutic exploration

Competitive Landscape of Bovine Brain Extract

Players Global Value Share 2025
Sigma-Aldrich 9%
Others 91%

The bovine brain extract market is moderately fragmented, with global biopharmaceutical leaders, mid-sized nutraceutical innovators, and specialized extract formulators competing across cognitive, medical, and cosmeceutical applications.

Global players such as Sigma Aldrich (Merck KGaA), Lonza Group, andATCC have been positioned at the forefront, owing to their deep-rooted capabilities in tissue-derived bioactives, pharmaceutical-grade processing, and stringent regulatory compliance. Their strategies have increasingly prioritized GMP-certified extraction, neuroactive compound standardization, and clinical-grade supply for research and therapeutic use.

Established mid-tier companies such as MP Biomedicals, Cell Applications, Inc., andThomas Scientific have been addressing demand for laboratory-scale and functional ingredient solutions, particularly in academic and biotech research. These players have remained competitive by offering ready-to-use extracts, high-purity formats, and application-tailored solutions for neurological assays, memory support formulations, and skin regeneration research.

Niche-focused suppliers including Viscoll (Livecell™), Hangzhou Panta Trading Co., Ltd., Beijing Hongrun Baoshun Technology Co., Ltd., andMorNatural Health Solutions have catered to regional markets and B2B supplement firms, emphasizing traceable sourcing and cost-efficient production.

Competitive differentiation is now transitioning from ingredient purity alone to ecosystem-based offerings—combining extract standardization, regulatory documentation, clinical validation, and personalized formulation support. Market leadership is expected to depend on scalability, transparency, and the ability to align with evolving neuro-nutrition and cosmeceutical trends.

Key Developments in Bovine Brain Extract

  • In February 2025, India’s CDSCO released updated draft guidelines permitting waivers of certain animal‑testing requirements for biologics based on strong in vitro analytical data. These reforms signal smoother approval pathways for bovine‑derived extracts used in therapeutics and cognitive supplements, accelerating market entry and research uptake.
  • In January 2025, Japan’s PMDA and other leading global regulators issued strengthened guidance encouraging the replacement of animal‑derived materials in biologics, including bovine brain extracts, with chemically defined or recombinant alternatives. This shift has intensified demand for traceable, high‑purity sourcing and may reshape regional extraction standards.

Scope of the Report

Item Value
Quantitative Units USD 555.6 Million
Product Type Raw Extracts (Powders, Concentrates), Encapsulated Supplements (Capsules, Tablets), Injectable Formulations, Functional Ingredients, Cosmetic Ingredients
Application Cognitive & Memory Support Supplements, Neurological Health & Nerve Regeneration, Medical Nutrition, Cosmetic & Dermatological Applications, Pharmaceutical R&D
Purity Grade Pharmaceutical Grade, Food Grade, Cosmetic Grade
Source Organic Bovine Brain Extract, Conventional Bovine Brain Extract
Sales Channel Pharmacies & Drugstores, Nutraceutical & Supplement Manufacturers (B2B), Research Institutions & Laboratories, Cosmetic Ingredient Suppliers, Online Retail
End User Medical Professionals & Clinics, Nutraceutical Companies, Cosmetic Companies, Researchers & Academics
Regions Covered North America, Europe, Asia-Pacific, Latin America, Middle East & Africa
Country Covered United States, Canada, Germany, France, United Kingdom, China, Japan, India, Brazil, South Africa
Key Companies Profiled Sigma Aldrich (Merck KGaA), Lonza Group, ATCC, MP Biomedicals, Cell Applications, Inc., Thomas Scientific, Viscoll (Livecell™), Beijing Hongrun, Panta Trading, and MorNatural Health .
Additional Attributes CAGR by product type and application, growth in cognitive & cosmeceutical applications, therapeutic adoption in neurological nutrition, ethical sourcing trends, regulatory alignment (FDA, PMDA, CDSCO), GMP-grade certification impact, organic vs. conventional sourcing shifts, demand forecasting by purity grade, use in clinical R&D and anti-aging solutions, regional dynamics shaped by population aging, and market entry pathways for B2B supplement formulators.

Key Segments

By Product Type:

  • Raw (Concentrates, Powders)
  • Encapsulated Supplements (Capsules, Tablets)
  • Injectable Formulations (for Medical Use)
  • Functional Ingredients (Peptides, Phospholipids)
  • Cosmetic Ingredients (Anti-aging, Skin Repair)

By Application:

  • Cognitive & Memory Support Supplements
  • Neurological Health & Nerve Regeneration
  • Medical Nutrition (Neurodegenerative Disease Support)
  • Cosmetic & Dermatological Applications
  • Research & Pharmaceutical Use

By Purity Grade:

  • Pharmaceutical Grade
  • Food Grade
  • Cosmetic Grade

By Source:

  • Organic
  • Conventional

By End User:

  • Medical Professionals & Clinics
  • Nutraceutical Companies
  • Cosmetic Companies
  • Researchers & Academics

By Sales Channel:

  • Pharmacies & Drugstores
  • Nutraceutical & Supplement Manufacturers (B2B)
  • Research Institutions & Laboratories
  • Cosmetic Ingredient Suppliers
  • Online Retail

By Region:

  • North America
  • Latin America
  • Europe
  • East Asia
  • South Asia & Pacific
  • MEA

Table of Content

  1. Executive Summary
    • Global Market Outlook
    • Demand-side Trends
    • Supply-side Trends
    • Technology Roadmap Analysis
    • Analysis and Recommendations
  2. Market Overview
    • Market Coverage / Taxonomy
    • Market Definition / Scope / Limitations
  3. Market Background
    • Market Dynamics
      • Drivers
      • Restraints
      • Opportunity
      • Trends
    • Scenario Forecast
      • Demand in Optimistic Scenario
      • Demand in Likely Scenario
      • Demand in Conservative Scenario
    • Opportunity Map Analysis
    • Product Life Cycle Analysis
    • Supply Chain Analysis
      • Supply Side Participants and their Roles
        • Producers
        • Mid-Level Participants (Traders/ Agents/ Brokers)
        • Wholesalers and Distributors
      • Value Added and Value Created at Node in the Supply Chain
      • List of Raw Material Suppliers
      • List of Existing and Potential Buyer’s
    • Investment Feasibility Matrix
    • Value Chain Analysis
      • Profit Margin Analysis
      • Wholesalers and Distributors
      • Retailers
    • PESTLE and Porter’s Analysis
    • Regulatory Landscape
      • By Key Regions
      • By Key Countries
    • Regional Parent Market Outlook
    • Production and Consumption Statistics
    • Import and Export Statistics
  4. Global Market Analysis 2020 to 2024 and Forecast, 2025 to 2035
    • Historical Market Size Value (USD Million) & Volume (MT) Analysis, 2020 to 2024
    • Current and Future Market Size Value (USD Million) & Volume (MT) Projections, 2025 to 2035
      • Y-o-Y Growth Trend Analysis
      • Absolute $ Opportunity Analysis
  5. Global Market Analysis 2020 to 2024 and Forecast 2025 to 2035, By Product Type
    • Introduction / Key Findings
    • Historical Market Size Value (USD Million) & Volume (MT) Analysis By Product Type, 2020 to 2024
    • Current and Future Market Size Value (USD Million) & Volume (MT) Analysis and Forecast By Product Type, 2025 to 2035
      • Raw (Concentrates, Powders)
      • Encapsulated Supplements (Capsules, Tablets)
      • Injectable Formulations (for Medical Use)
      • Functional Ingredients (Peptides, Phospholipids)
      • Cosmetic Ingredients (Anti-aging, Skin Repair)
    • Y-o-Y Growth Trend Analysis By Product Type, 2020 to 2024
    • Absolute $ Opportunity Analysis By Product Type, 2025 to 2035
  6. Global Market Analysis 2020 to 2024 and Forecast 2025 to 2035, By Application
    • Introduction / Key Findings
    • Historical Market Size Value (USD Million) & Volume (MT) Analysis By Application, 2020 to 2024
    • Current and Future Market Size Value (USD Million) & Volume (MT) Analysis and Forecast By Application, 2025 to 2035
      • Cognitive & Memory Support Supplements
      • Neurological Health & Nerve Regeneration
      • Medical Nutrition (Neurodegenerative Disease Support)
      • Cosmetic & Dermatological Applications
      • Research & Pharmaceutical Use
    • Y-o-Y Growth Trend Analysis By Application, 2020 to 2024
    • Absolute $ Opportunity Analysis By Application, 2025 to 2035
  7. Global Market Analysis 2020 to 2024 and Forecast 2025 to 2035, By Purity Grade
    • Introduction / Key Findings
    • Historical Market Size Value (USD Million) & Volume (MT) Analysis By Purity Grade, 2020 to 2024
    • Current and Future Market Size Value (USD Million) & Volume (MT) Analysis and Forecast By Purity Grade, 2025 to 2035
      • Pharmaceutical Grade
      • Food Grade
      • Cosmetic Grade
    • Y-o-Y Growth Trend Analysis By Purity Grade, 2020 to 2024
    • Absolute $ Opportunity Analysis By Purity Grade, 2025 to 2035
  8. Global Market Analysis 2020 to 2024 and Forecast 2025 to 2035, By Source
    • Introduction / Key Findings
    • Historical Market Size Value (USD Million) & Volume (MT) Analysis By Source, 2020 to 2024
    • Current and Future Market Size Value (USD Million) & Volume (MT) Analysis and Forecast By Source, 2025 to 2035
      • Organic
      • Conventional
    • Y-o-Y Growth Trend Analysis By Source, 2020 to 2024
    • Absolute $ Opportunity Analysis By Source, 2025 to 2035
  9. Global Market Analysis 2020 to 2024 and Forecast 2025 to 2035, By End User
    • Introduction / Key Findings
    • Historical Market Size Value (USD Million) & Volume (MT) Analysis By End User, 2020 to 2024
    • Current and Future Market Size Value (USD Million) & Volume (MT) Analysis and Forecast By End User, 2025 to 2035
      • Medical Professionals & Clinics
      • Nutraceutical Companies
      • Cosmetic Companies
      • Researchers & Academics
    • Y-o-Y Growth Trend Analysis By End User, 2020 to 2024
    • Absolute $ Opportunity Analysis By End User, 2025 to 2035
  10. Global Market Analysis 2020 to 2024 and Forecast 2025 to 2035, By Sales Channel
    • Introduction / Key Findings
    • Historical Market Size Value (USD Million) & Volume (MT) Analysis By Sales Channel, 2020 to 2024
    • Current and Future Market Size Value (USD Million) & Volume (MT) Analysis and Forecast By Sales Channel, 2025 to 2035
      • Pharmacies & Drugstores
      • Nutraceutical & Supplement Manufacturers (B2B)
      • Research Institutions & Laboratories
      • Cosmetic Ingredient Suppliers
      • Online Retail
    • Y-o-Y Growth Trend Analysis By Sales Channel, 2020 to 2024
    • Absolute $ Opportunity Analysis By Sales Channel, 2025 to 2035
  11. Global Market Analysis 2020 to 2024 and Forecast 2025 to 2035, By Region
    • Introduction
    • Historical Market Size Value (USD Million) & Volume (MT) Analysis By Region, 2020 to 2024
    • Current Market Size Value (USD Million) & Volume (MT) Analysis and Forecast By Region, 2025 to 2035
      • North America
      • Latin America
      • Europe
      • East Asia
      • South Asia & Pacific
      • MEA
    • Market Attractiveness Analysis By Region
  12. North America Market Analysis 2020 to 2024 and Forecast 2025 to 2035, By Country
    • Historical Market Size Value (USD Million) & Volume (MT) Trend Analysis By Market Taxonomy, 2020 to 2024
    • Market Size Value (USD Million) & Volume (MT) Forecast By Market Taxonomy, 2025 to 2035
      • By Country
        • USA
        • Canada
      • By Product Type
      • By Application
      • By Purity Grade
      • By Source
      • By End User
      • By Sales Channel
    • Market Attractiveness Analysis
      • By Country
      • By Product Type
      • By Application
      • By Purity Grade
      • By Source
      • By End User
      • By Sales Channel
    • Key Takeaways
  13. Latin America Market Analysis 2020 to 2024 and Forecast 2025 to 2035, By Country
    • Historical Market Size Value (USD Million) & Volume (MT) Trend Analysis By Market Taxonomy, 2020 to 2024
    • Market Size Value (USD Million) & Volume (MT) Forecast By Market Taxonomy, 2025 to 2035
      • By Country
        • Brazil
        • Mexico
        • Colombia
        • Rest of Latin America
      • By Product Type
      • By Application
      • By Purity Grade
      • By Source
      • By End User
      • By Sales Channel
    • Market Attractiveness Analysis
      • By Country
      • By Product Type
      • By Application
      • By Purity Grade
      • By Source
      • By End User
      • By Sales Channel
    • Key Takeaways
  14. Europe Market Analysis 2020 to 2024 and Forecast 2025 to 2035, By Country
    • Historical Market Size Value (USD Million) & Volume (MT) Trend Analysis By Market Taxonomy, 2020 to 2024
    • Market Size Value (USD Million) & Volume (MT) Forecast By Market Taxonomy, 2025 to 2035
      • By Country
        • Germany
        • UK
        • France
        • Italy
        • Spain
        • Belgium
        • Netherlands
        • Nordic
        • Switzerland
        • Russia
        • Poland
        • Rest of Europe
      • By Product Type
      • By Application
      • By Purity Grade
      • By Source
      • By End User
      • By Sales Channel
    • Market Attractiveness Analysis
      • By Country
      • By Product Type
      • By Application
      • By Purity Grade
      • By Source
      • By End User
      • By Sales Channel
    • Key Takeaways
  15. East Asia Market Analysis 2020 to 2024 and Forecast 2025 to 2035, By Country
    • Historical Market Size Value (USD Million) & Volume (MT) Trend Analysis By Market Taxonomy, 2020 to 2024
    • Market Size Value (USD Million) & Volume (MT) Forecast By Market Taxonomy, 2025 to 2035
      • By Country
        • China
        • Japan
        • South Korea
      • By Product Type
      • By Application
      • By Purity Grade
      • By Source
      • By End User
      • By Sales Channel
    • Market Attractiveness Analysis
      • By Country
      • By Product Type
      • By Application
      • By Purity Grade
      • By Source
      • By End User
      • By Sales Channel
    • Key Takeaways
  16. South Asia & Pacific Market Analysis 2020 to 2024 and Forecast 2025 to 2035, By Country
    • Historical Market Size Value (USD Million) & Volume (MT) Trend Analysis By Market Taxonomy, 2020 to 2024
    • Market Size Value (USD Million) & Volume (MT) Forecast By Market Taxonomy, 2025 to 2035
      • By Country
        • India
        • Thailand
        • Malaysia
        • Indonesia
        • Singapore
        • Vietnam
        • Australia
        • New Zealand
        • Rest of South Asia
      • By Product Type
      • By Application
      • By Purity Grade
      • By Source
      • By End User
      • By Sales Channel
    • Market Attractiveness Analysis
      • By Country
      • By Product Type
      • By Application
      • By Purity Grade
      • By Source
      • By End User
      • By Sales Channel
    • Key Takeaways
  17. MEA Market Analysis 2020 to 2024 and Forecast 2025 to 2035, By Country
    • Historical Market Size Value (USD Million) & Volume (MT) Trend Analysis By Market Taxonomy, 2020 to 2024
    • Market Size Value (USD Million) & Volume (MT) Forecast By Market Taxonomy, 2025 to 2035
      • By Country
        • Turkey
        • UAE
        • Saudi Arabia
        • Israel
        • Other GCC Countries
        • North Africa
        • South Africa
        • Central Africa
        • Rest of MEA
      • By Product Type
      • By Application
      • By Purity Grade
      • By Source
      • By End User
      • By Sales Channel
    • Market Attractiveness Analysis
      • By Country
      • By Product Type
      • By Application
      • By Purity Grade
      • By Source
      • By End User
      • By Sales Channel
    • Key Takeaways
  18. Key Countries Market Analysis
    • USA
      • Pricing Analysis
      • Market Share Analysis, 2024
        • By Product Type
        • By Application
        • By Purity Grade
        • By Source
        • By End User
        • By Sales Channel
    • Canada
      • Pricing Analysis
      • Market Share Analysis, 2024
        • By Product Type
        • By Application
        • By Purity Grade
        • By Source
        • By End User
        • By Sales Channel
    • Brazil
      • Pricing Analysis
      • Market Share Analysis, 2024
        • By Product Type
        • By Application
        • By Purity Grade
        • By Source
        • By End User
        • By Sales Channel
    • Mexico
      • Pricing Analysis
      • Market Share Analysis, 2024
        • By Product Type
        • By Application
        • By Purity Grade
        • By Source
        • By End User
        • By Sales Channel
    • Colombia
      • Pricing Analysis
      • Market Share Analysis, 2024
        • By Product Type
        • By Application
        • By Purity Grade
        • By Source
        • By End User
        • By Sales Channel
    • Germany
      • Pricing Analysis
      • Market Share Analysis, 2024
        • By Product Type
        • By Application
        • By Purity Grade
        • By Source
        • By End User
        • By Sales Channel
    • UK
      • Pricing Analysis
      • Market Share Analysis, 2024
        • By Product Type
        • By Application
        • By Purity Grade
        • By Source
        • By End User
        • By Sales Channel
    • France
      • Pricing Analysis
      • Market Share Analysis, 2024
        • By Product Type
        • By Application
        • By Purity Grade
        • By Source
        • By End User
        • By Sales Channel
    • Italy
      • Pricing Analysis
      • Market Share Analysis, 2024
        • By Product Type
        • By Application
        • By Purity Grade
        • By Source
        • By End User
        • By Sales Channel
    • Spain
      • Pricing Analysis
      • Market Share Analysis, 2024
        • By Product Type
        • By Application
        • By Purity Grade
        • By Source
        • By End User
        • By Sales Channel
    • Belgium
      • Pricing Analysis
      • Market Share Analysis, 2024
        • By Product Type
        • By Application
        • By Purity Grade
        • By Source
        • By End User
        • By Sales Channel
    • Netherlands
      • Pricing Analysis
      • Market Share Analysis, 2024
        • By Product Type
        • By Application
        • By Purity Grade
        • By Source
        • By End User
        • By Sales Channel
    • Nordic
      • Pricing Analysis
      • Market Share Analysis, 2024
        • By Product Type
        • By Application
        • By Purity Grade
        • By Source
        • By End User
        • By Sales Channel
    • Switzerland
      • Pricing Analysis
      • Market Share Analysis, 2024
        • By Product Type
        • By Application
        • By Purity Grade
        • By Source
        • By End User
        • By Sales Channel
    • Russia
      • Pricing Analysis
      • Market Share Analysis, 2024
        • By Product Type
        • By Application
        • By Purity Grade
        • By Source
        • By End User
        • By Sales Channel
    • Poland
      • Pricing Analysis
      • Market Share Analysis, 2024
        • By Product Type
        • By Application
        • By Purity Grade
        • By Source
        • By End User
        • By Sales Channel
    • China
      • Pricing Analysis
      • Market Share Analysis, 2024
        • By Product Type
        • By Application
        • By Purity Grade
        • By Source
        • By End User
        • By Sales Channel
    • Japan
      • Pricing Analysis
      • Market Share Analysis, 2024
        • By Product Type
        • By Application
        • By Purity Grade
        • By Source
        • By End User
        • By Sales Channel
    • South Korea
      • Pricing Analysis
      • Market Share Analysis, 2024
        • By Product Type
        • By Application
        • By Purity Grade
        • By Source
        • By End User
        • By Sales Channel
    • India
      • Pricing Analysis
      • Market Share Analysis, 2024
        • By Product Type
        • By Application
        • By Purity Grade
        • By Source
        • By End User
        • By Sales Channel
    • Thailand
      • Pricing Analysis
      • Market Share Analysis, 2024
        • By Product Type
        • By Application
        • By Purity Grade
        • By Source
        • By End User
        • By Sales Channel
    • Indonesia
      • Pricing Analysis
      • Market Share Analysis, 2024
        • By Product Type
        • By Application
        • By Purity Grade
        • By Source
        • By End User
        • By Sales Channel
    • Australia
      • Pricing Analysis
      • Market Share Analysis, 2024
        • By Product Type
        • By Application
        • By Purity Grade
        • By Source
        • By End User
        • By Sales Channel
    • New Zealand
      • Pricing Analysis
      • Market Share Analysis, 2024
        • By Product Type
        • By Application
        • By Purity Grade
        • By Source
        • By End User
        • By Sales Channel
    • Turkey
      • Pricing Analysis
      • Market Share Analysis, 2024
        • By Product Type
        • By Application
        • By Purity Grade
        • By Source
        • By End User
        • By Sales Channel
    • UAE
      • Pricing Analysis
      • Market Share Analysis, 2024
        • By Product Type
        • By Application
        • By Purity Grade
        • By Source
        • By End User
        • By Sales Channel
    • Saudi Arabia
      • Pricing Analysis
      • Market Share Analysis, 2024
        • By Product Type
        • By Application
        • By Purity Grade
        • By Source
        • By End User
        • By Sales Channel
    • Israel
      • Pricing Analysis
      • Market Share Analysis, 2024
        • By Product Type
        • By Application
        • By Purity Grade
        • By Source
        • By End User
        • By Sales Channel
    • North Africa
      • Pricing Analysis
      • Market Share Analysis, 2024
        • By Product Type
        • By Application
        • By Purity Grade
        • By Source
        • By End User
        • By Sales Channel
    • South Africa
      • Pricing Analysis
      • Market Share Analysis, 2024
        • By Product Type
        • By Application
        • By Purity Grade
        • By Source
        • By End User
        • By Sales Channel
  19. Market Structure Analysis
    • Competition Dashboard
    • Competition Benchmarking
    • Market Share Analysis of Top Players
      • By Regional
      • By Product Type
      • By Application
      • By Purity Grade
      • By Source
      • By End User
      • By Sales Channel
  20. Competition Analysis
    • Competition Deep Dive
      • Lonza Group
        • Overview
        • Product Portfolio
        • Profitability by Market Segments (Product/Age /Sales Channel/Region)
        • Sales Footprint
        • Strategy Overview
          • Marketing Strategy
          • Product Strategy
          • Channel Strategy
      • Cell Applications, Inc.
        • Overview
        • Product Portfolio
        • Profitability by Market Segments (Product/Age /Sales Channel/Region)
        • Sales Footprint
        • Strategy Overview
          • Marketing Strategy
          • Product Strategy
          • Channel Strategy
      • MP Biomedicals
        • Overview
        • Product Portfolio
        • Profitability by Market Segments (Product/Age /Sales Channel/Region)
        • Sales Footprint
        • Strategy Overview
          • Marketing Strategy
          • Product Strategy
          • Channel Strategy
      • Viscoll (Livecell™)
        • Overview
        • Product Portfolio
        • Profitability by Market Segments (Product/Age /Sales Channel/Region)
        • Sales Footprint
        • Strategy Overview
          • Marketing Strategy
          • Product Strategy
          • Channel Strategy
      • Sigma Aldrich (Merck KgaA)
        • Overview
        • Product Portfolio
        • Profitability by Market Segments (Product/Age /Sales Channel/Region)
        • Sales Footprint
        • Strategy Overview
          • Marketing Strategy
          • Product Strategy
          • Channel Strategy
      • ATCC
        • Overview
        • Product Portfolio
        • Profitability by Market Segments (Product/Age /Sales Channel/Region)
        • Sales Footprint
        • Strategy Overview
          • Marketing Strategy
          • Product Strategy
          • Channel Strategy
      • Thomas Scientific
        • Overview
        • Product Portfolio
        • Profitability by Market Segments (Product/Age /Sales Channel/Region)
        • Sales Footprint
        • Strategy Overview
          • Marketing Strategy
          • Product Strategy
          • Channel Strategy
      • HangzhouPantaTradingCo.,Ltd
        • Overview
        • Product Portfolio
        • Profitability by Market Segments (Product/Age /Sales Channel/Region)
        • Sales Footprint
        • Strategy Overview
          • Marketing Strategy
          • Product Strategy
          • Channel Strategy
      • Beijing Hongrun Baoshun Technology, Co. Ltd.
        • Overview
        • Product Portfolio
        • Profitability by Market Segments (Product/Age /Sales Channel/Region)
        • Sales Footprint
        • Strategy Overview
          • Marketing Strategy
          • Product Strategy
          • Channel Strategy
      • MorNatural Health Solutions
        • Overview
        • Product Portfolio
        • Profitability by Market Segments (Product/Age /Sales Channel/Region)
        • Sales Footprint
        • Strategy Overview
          • Marketing Strategy
          • Product Strategy
          • Channel Strategy
      • Others
        • Overview
        • Product Portfolio
        • Profitability by Market Segments (Product/Age /Sales Channel/Region)
        • Sales Footprint
        • Strategy Overview
          • Marketing Strategy
          • Product Strategy
          • Channel Strategy
  21. Assumptions & Acronyms Used
  22. Research Methodology

List of Tables

  • Table 1: Global Market Value (USD Million) Forecast by Region, 2020-2035
  • Table 2: Global Market Volume (MT) Forecast by Region, 2020-2035
  • Table 3: Global Market Value (USD Million) Forecast by Product Type, 2020-2035
  • Table 4: Global Market Volume (MT) Forecast by Product Type, 2020-2035
  • Table 5: Global Market Value (USD Million) Forecast by Application, 2020-2035
  • Table 6: Global Market Volume (MT) Forecast by Application, 2020-2035
  • Table 7: Global Market Value (USD Million) Forecast by Purity Grade, 2020-2035
  • Table 8: Global Market Volume (MT) Forecast by Purity Grade, 2020-2035
  • Table 9: Global Market Value (USD Million) Forecast by Source, 2020-2035
  • Table 10: Global Market Volume (MT) Forecast by Source, 2020-2035
  • Table 11: Global Market Value (USD Million) Forecast by End User, 2020-2035
  • Table 12: Global Market Volume (MT) Forecast by End User, 2020-2035
  • Table 13: Global Market Value (USD Million) Forecast by Sales Channel, 2020-2035
  • Table 14: Global Market Volume (MT) Forecast by Sales Channel, 2020-2035
  • Table 15: North America Market Value (USD Million) Forecast by Country, 2020-2035
  • Table 16: North America Market Volume (MT) Forecast by Country, 2020-2035
  • Table 17: North America Market Value (USD Million) Forecast by Product Type, 2020-2035
  • Table 18: North America Market Volume (MT) Forecast by Product Type, 2020-2035
  • Table 19: North America Market Value (USD Million) Forecast by Application, 2020-2035
  • Table 20: North America Market Volume (MT) Forecast by Application, 2020-2035
  • Table 21: North America Market Value (USD Million) Forecast by Purity Grade, 2020-2035
  • Table 22: North America Market Volume (MT) Forecast by Purity Grade, 2020-2035
  • Table 23: North America Market Value (USD Million) Forecast by Source, 2020-2035
  • Table 24: North America Market Volume (MT) Forecast by Source, 2020-2035
  • Table 25: North America Market Value (USD Million) Forecast by End User, 2020-2035
  • Table 26: North America Market Volume (MT) Forecast by End User, 2020-2035
  • Table 27: North America Market Value (USD Million) Forecast by Sales Channel, 2020-2035
  • Table 28: North America Market Volume (MT) Forecast by Sales Channel, 2020-2035
  • Table 29: Latin America Market Value (USD Million) Forecast by Country, 2020-2035
  • Table 30: Latin America Market Volume (MT) Forecast by Country, 2020-2035
  • Table 31: Latin America Market Value (USD Million) Forecast by Product Type, 2020-2035
  • Table 32: Latin America Market Volume (MT) Forecast by Product Type, 2020-2035
  • Table 33: Latin America Market Value (USD Million) Forecast by Application, 2020-2035
  • Table 34: Latin America Market Volume (MT) Forecast by Application, 2020-2035
  • Table 35: Latin America Market Value (USD Million) Forecast by Purity Grade, 2020-2035
  • Table 36: Latin America Market Volume (MT) Forecast by Purity Grade, 2020-2035
  • Table 37: Latin America Market Value (USD Million) Forecast by Source, 2020-2035
  • Table 38: Latin America Market Volume (MT) Forecast by Source, 2020-2035
  • Table 39: Latin America Market Value (USD Million) Forecast by End User, 2020-2035
  • Table 40: Latin America Market Volume (MT) Forecast by End User, 2020-2035
  • Table 41: Latin America Market Value (USD Million) Forecast by Sales Channel, 2020-2035
  • Table 42: Latin America Market Volume (MT) Forecast by Sales Channel, 2020-2035
  • Table 43: Europe Market Value (USD Million) Forecast by Country, 2020-2035
  • Table 44: Europe Market Volume (MT) Forecast by Country, 2020-2035
  • Table 45: Europe Market Value (USD Million) Forecast by Product Type, 2020-2035
  • Table 46: Europe Market Volume (MT) Forecast by Product Type, 2020-2035
  • Table 47: Europe Market Value (USD Million) Forecast by Application, 2020-2035
  • Table 48: Europe Market Volume (MT) Forecast by Application, 2020-2035
  • Table 49: Europe Market Value (USD Million) Forecast by Purity Grade, 2020-2035
  • Table 50: Europe Market Volume (MT) Forecast by Purity Grade, 2020-2035
  • Table 51: Europe Market Value (USD Million) Forecast by Source, 2020-2035
  • Table 52: Europe Market Volume (MT) Forecast by Source, 2020-2035
  • Table 53: Europe Market Value (USD Million) Forecast by End User, 2020-2035
  • Table 54: Europe Market Volume (MT) Forecast by End User, 2020-2035
  • Table 55: Europe Market Value (USD Million) Forecast by Sales Channel, 2020-2035
  • Table 56: Europe Market Volume (MT) Forecast by Sales Channel, 2020-2035
  • Table 57: East Asia Market Value (USD Million) Forecast by Country, 2020-2035
  • Table 58: East Asia Market Volume (MT) Forecast by Country, 2020-2035
  • Table 59: East Asia Market Value (USD Million) Forecast by Product Type, 2020-2035
  • Table 60: East Asia Market Volume (MT) Forecast by Product Type, 2020-2035
  • Table 61: East Asia Market Value (USD Million) Forecast by Application, 2020-2035
  • Table 62: East Asia Market Volume (MT) Forecast by Application, 2020-2035
  • Table 63: East Asia Market Value (USD Million) Forecast by Purity Grade, 2020-2035
  • Table 64: East Asia Market Volume (MT) Forecast by Purity Grade, 2020-2035
  • Table 65: East Asia Market Value (USD Million) Forecast by Source, 2020-2035
  • Table 66: East Asia Market Volume (MT) Forecast by Source, 2020-2035
  • Table 67: East Asia Market Value (USD Million) Forecast by End User, 2020-2035
  • Table 68: East Asia Market Volume (MT) Forecast by End User, 2020-2035
  • Table 69: East Asia Market Value (USD Million) Forecast by Sales Channel, 2020-2035
  • Table 70: East Asia Market Volume (MT) Forecast by Sales Channel, 2020-2035
  • Table 71: South Asia & Pacific Market Value (USD Million) Forecast by Country, 2020-2035
  • Table 72: South Asia & Pacific Market Volume (MT) Forecast by Country, 2020-2035
  • Table 73: South Asia & Pacific Market Value (USD Million) Forecast by Product Type, 2020-2035
  • Table 74: South Asia & Pacific Market Volume (MT) Forecast by Product Type, 2020-2035
  • Table 75: South Asia & Pacific Market Value (USD Million) Forecast by Application, 2020-2035
  • Table 76: South Asia & Pacific Market Volume (MT) Forecast by Application, 2020-2035
  • Table 77: South Asia & Pacific Market Value (USD Million) Forecast by Purity Grade, 2020-2035
  • Table 78: South Asia & Pacific Market Volume (MT) Forecast by Purity Grade, 2020-2035
  • Table 79: South Asia & Pacific Market Value (USD Million) Forecast by Source, 2020-2035
  • Table 80: South Asia & Pacific Market Volume (MT) Forecast by Source, 2020-2035
  • Table 81: South Asia & Pacific Market Value (USD Million) Forecast by End User, 2020-2035
  • Table 82: South Asia & Pacific Market Volume (MT) Forecast by End User, 2020-2035
  • Table 83: South Asia & Pacific Market Value (USD Million) Forecast by Sales Channel, 2020-2035
  • Table 84: South Asia & Pacific Market Volume (MT) Forecast by Sales Channel, 2020-2035
  • Table 85: MEA Market Value (USD Million) Forecast by Country, 2020-2035
  • Table 86: MEA Market Volume (MT) Forecast by Country, 2020-2035
  • Table 87: MEA Market Value (USD Million) Forecast by Product Type, 2020-2035
  • Table 88: MEA Market Volume (MT) Forecast by Product Type, 2020-2035
  • Table 89: MEA Market Value (USD Million) Forecast by Application, 2020-2035
  • Table 90: MEA Market Volume (MT) Forecast by Application, 2020-2035
  • Table 91: MEA Market Value (USD Million) Forecast by Purity Grade, 2020-2035
  • Table 92: MEA Market Volume (MT) Forecast by Purity Grade, 2020-2035
  • Table 93: MEA Market Value (USD Million) Forecast by Source, 2020-2035
  • Table 94: MEA Market Volume (MT) Forecast by Source, 2020-2035
  • Table 95: MEA Market Value (USD Million) Forecast by End User, 2020-2035
  • Table 96: MEA Market Volume (MT) Forecast by End User, 2020-2035
  • Table 97: MEA Market Value (USD Million) Forecast by Sales Channel, 2020-2035
  • Table 98: MEA Market Volume (MT) Forecast by Sales Channel, 2020-2035

List of Figures

  • Figure 1: Global Market Value (USD Million) by Product Type, 2025-2035
  • Figure 2: Global Market Value (USD Million) by Application, 2025-2035
  • Figure 3: Global Market Value (USD Million) by Purity Grade, 2025-2035
  • Figure 4: Global Market Value (USD Million) by Source, 2025-2035
  • Figure 5: Global Market Value (USD Million) by End User, 2025-2035
  • Figure 6: Global Market Value (USD Million) by Sales Channel, 2025-2035
  • Figure 7: Global Market Value (USD Million) by Region, 2025-2035
  • Figure 8: Global Market Value (USD Million) Analysis by Region, 2020-2035
  • Figure 9: Global Market Volume (MT) Analysis by Region, 2020-2035
  • Figure 10: Global Market Value Share (%) and BPS Analysis by Region, 2025-2035
  • Figure 11: Global Market Y-o-Y Growth (%) Projections by Region, 2025-2035
  • Figure 12: Global Market Value (USD Million) Analysis by Product Type, 2020-2035
  • Figure 13: Global Market Volume (MT) Analysis by Product Type, 2020-2035
  • Figure 14: Global Market Value Share (%) and BPS Analysis by Product Type, 2025-2035
  • Figure 15: Global Market Y-o-Y Growth (%) Projections by Product Type, 2025-2035
  • Figure 16: Global Market Value (USD Million) Analysis by Application, 2020-2035
  • Figure 17: Global Market Volume (MT) Analysis by Application, 2020-2035
  • Figure 18: Global Market Value Share (%) and BPS Analysis by Application, 2025-2035
  • Figure 19: Global Market Y-o-Y Growth (%) Projections by Application, 2025-2035
  • Figure 20: Global Market Value (USD Million) Analysis by Purity Grade, 2020-2035
  • Figure 21: Global Market Volume (MT) Analysis by Purity Grade, 2020-2035
  • Figure 22: Global Market Value Share (%) and BPS Analysis by Purity Grade, 2025-2035
  • Figure 23: Global Market Y-o-Y Growth (%) Projections by Purity Grade, 2025-2035
  • Figure 24: Global Market Value (USD Million) Analysis by Source, 2020-2035
  • Figure 25: Global Market Volume (MT) Analysis by Source, 2020-2035
  • Figure 26: Global Market Value Share (%) and BPS Analysis by Source, 2025-2035
  • Figure 27: Global Market Y-o-Y Growth (%) Projections by Source, 2025-2035
  • Figure 28: Global Market Value (USD Million) Analysis by End User, 2020-2035
  • Figure 29: Global Market Volume (MT) Analysis by End User, 2020-2035
  • Figure 30: Global Market Value Share (%) and BPS Analysis by End User, 2025-2035
  • Figure 31: Global Market Y-o-Y Growth (%) Projections by End User, 2025-2035
  • Figure 32: Global Market Value (USD Million) Analysis by Sales Channel, 2020-2035
  • Figure 33: Global Market Volume (MT) Analysis by Sales Channel, 2020-2035
  • Figure 34: Global Market Value Share (%) and BPS Analysis by Sales Channel, 2025-2035
  • Figure 35: Global Market Y-o-Y Growth (%) Projections by Sales Channel, 2025-2035
  • Figure 36: Global Market Attractiveness by Product Type, 2025-2035
  • Figure 37: Global Market Attractiveness by Application, 2025-2035
  • Figure 38: Global Market Attractiveness by Purity Grade, 2025-2035
  • Figure 39: Global Market Attractiveness by Source, 2025-2035
  • Figure 40: Global Market Attractiveness by End User, 2025-2035
  • Figure 41: Global Market Attractiveness by Sales Channel, 2025-2035
  • Figure 42: Global Market Attractiveness by Region, 2025-2035
  • Figure 43: North America Market Value (USD Million) by Product Type, 2025-2035
  • Figure 44: North America Market Value (USD Million) by Application, 2025-2035
  • Figure 45: North America Market Value (USD Million) by Purity Grade, 2025-2035
  • Figure 46: North America Market Value (USD Million) by Source, 2025-2035
  • Figure 47: North America Market Value (USD Million) by End User, 2025-2035
  • Figure 48: North America Market Value (USD Million) by Sales Channel, 2025-2035
  • Figure 49: North America Market Value (USD Million) by Country, 2025-2035
  • Figure 50: North America Market Value (USD Million) Analysis by Country, 2020-2035
  • Figure 51: North America Market Volume (MT) Analysis by Country, 2020-2035
  • Figure 52: North America Market Value Share (%) and BPS Analysis by Country, 2025-2035
  • Figure 53: North America Market Y-o-Y Growth (%) Projections by Country, 2025-2035
  • Figure 54: North America Market Value (USD Million) Analysis by Product Type, 2020-2035
  • Figure 55: North America Market Volume (MT) Analysis by Product Type, 2020-2035
  • Figure 56: North America Market Value Share (%) and BPS Analysis by Product Type, 2025-2035
  • Figure 57: North America Market Y-o-Y Growth (%) Projections by Product Type, 2025-2035
  • Figure 58: North America Market Value (USD Million) Analysis by Application, 2020-2035
  • Figure 59: North America Market Volume (MT) Analysis by Application, 2020-2035
  • Figure 60: North America Market Value Share (%) and BPS Analysis by Application, 2025-2035
  • Figure 61: North America Market Y-o-Y Growth (%) Projections by Application, 2025-2035
  • Figure 62: North America Market Value (USD Million) Analysis by Purity Grade, 2020-2035
  • Figure 63: North America Market Volume (MT) Analysis by Purity Grade, 2020-2035
  • Figure 64: North America Market Value Share (%) and BPS Analysis by Purity Grade, 2025-2035
  • Figure 65: North America Market Y-o-Y Growth (%) Projections by Purity Grade, 2025-2035
  • Figure 66: North America Market Value (USD Million) Analysis by Source, 2020-2035
  • Figure 67: North America Market Volume (MT) Analysis by Source, 2020-2035
  • Figure 68: North America Market Value Share (%) and BPS Analysis by Source, 2025-2035
  • Figure 69: North America Market Y-o-Y Growth (%) Projections by Source, 2025-2035
  • Figure 70: North America Market Value (USD Million) Analysis by End User, 2020-2035
  • Figure 71: North America Market Volume (MT) Analysis by End User, 2020-2035
  • Figure 72: North America Market Value Share (%) and BPS Analysis by End User, 2025-2035
  • Figure 73: North America Market Y-o-Y Growth (%) Projections by End User, 2025-2035
  • Figure 74: North America Market Value (USD Million) Analysis by Sales Channel, 2020-2035
  • Figure 75: North America Market Volume (MT) Analysis by Sales Channel, 2020-2035
  • Figure 76: North America Market Value Share (%) and BPS Analysis by Sales Channel, 2025-2035
  • Figure 77: North America Market Y-o-Y Growth (%) Projections by Sales Channel, 2025-2035
  • Figure 78: North America Market Attractiveness by Product Type, 2025-2035
  • Figure 79: North America Market Attractiveness by Application, 2025-2035
  • Figure 80: North America Market Attractiveness by Purity Grade, 2025-2035
  • Figure 81: North America Market Attractiveness by Source, 2025-2035
  • Figure 82: North America Market Attractiveness by End User, 2025-2035
  • Figure 83: North America Market Attractiveness by Sales Channel, 2025-2035
  • Figure 84: North America Market Attractiveness by Country, 2025-2035
  • Figure 85: Latin America Market Value (USD Million) by Product Type, 2025-2035
  • Figure 86: Latin America Market Value (USD Million) by Application, 2025-2035
  • Figure 87: Latin America Market Value (USD Million) by Purity Grade, 2025-2035
  • Figure 88: Latin America Market Value (USD Million) by Source, 2025-2035
  • Figure 89: Latin America Market Value (USD Million) by End User, 2025-2035
  • Figure 90: Latin America Market Value (USD Million) by Sales Channel, 2025-2035
  • Figure 91: Latin America Market Value (USD Million) by Country, 2025-2035
  • Figure 92: Latin America Market Value (USD Million) Analysis by Country, 2020-2035
  • Figure 93: Latin America Market Volume (MT) Analysis by Country, 2020-2035
  • Figure 94: Latin America Market Value Share (%) and BPS Analysis by Country, 2025-2035
  • Figure 95: Latin America Market Y-o-Y Growth (%) Projections by Country, 2025-2035
  • Figure 96: Latin America Market Value (USD Million) Analysis by Product Type, 2020-2035
  • Figure 97: Latin America Market Volume (MT) Analysis by Product Type, 2020-2035
  • Figure 98: Latin America Market Value Share (%) and BPS Analysis by Product Type, 2025-2035
  • Figure 99: Latin America Market Y-o-Y Growth (%) Projections by Product Type, 2025-2035
  • Figure 100: Latin America Market Value (USD Million) Analysis by Application, 2020-2035
  • Figure 101: Latin America Market Volume (MT) Analysis by Application, 2020-2035
  • Figure 102: Latin America Market Value Share (%) and BPS Analysis by Application, 2025-2035
  • Figure 103: Latin America Market Y-o-Y Growth (%) Projections by Application, 2025-2035
  • Figure 104: Latin America Market Value (USD Million) Analysis by Purity Grade, 2020-2035
  • Figure 105: Latin America Market Volume (MT) Analysis by Purity Grade, 2020-2035
  • Figure 106: Latin America Market Value Share (%) and BPS Analysis by Purity Grade, 2025-2035
  • Figure 107: Latin America Market Y-o-Y Growth (%) Projections by Purity Grade, 2025-2035
  • Figure 108: Latin America Market Value (USD Million) Analysis by Source, 2020-2035
  • Figure 109: Latin America Market Volume (MT) Analysis by Source, 2020-2035
  • Figure 110: Latin America Market Value Share (%) and BPS Analysis by Source, 2025-2035
  • Figure 111: Latin America Market Y-o-Y Growth (%) Projections by Source, 2025-2035
  • Figure 112: Latin America Market Value (USD Million) Analysis by End User, 2020-2035
  • Figure 113: Latin America Market Volume (MT) Analysis by End User, 2020-2035
  • Figure 114: Latin America Market Value Share (%) and BPS Analysis by End User, 2025-2035
  • Figure 115: Latin America Market Y-o-Y Growth (%) Projections by End User, 2025-2035
  • Figure 116: Latin America Market Value (USD Million) Analysis by Sales Channel, 2020-2035
  • Figure 117: Latin America Market Volume (MT) Analysis by Sales Channel, 2020-2035
  • Figure 118: Latin America Market Value Share (%) and BPS Analysis by Sales Channel, 2025-2035
  • Figure 119: Latin America Market Y-o-Y Growth (%) Projections by Sales Channel, 2025-2035
  • Figure 120: Latin America Market Attractiveness by Product Type, 2025-2035
  • Figure 121: Latin America Market Attractiveness by Application, 2025-2035
  • Figure 122: Latin America Market Attractiveness by Purity Grade, 2025-2035
  • Figure 123: Latin America Market Attractiveness by Source, 2025-2035
  • Figure 124: Latin America Market Attractiveness by End User, 2025-2035
  • Figure 125: Latin America Market Attractiveness by Sales Channel, 2025-2035
  • Figure 126: Latin America Market Attractiveness by Country, 2025-2035
  • Figure 127: Europe Market Value (USD Million) by Product Type, 2025-2035
  • Figure 128: Europe Market Value (USD Million) by Application, 2025-2035
  • Figure 129: Europe Market Value (USD Million) by Purity Grade, 2025-2035
  • Figure 130: Europe Market Value (USD Million) by Source, 2025-2035
  • Figure 131: Europe Market Value (USD Million) by End User, 2025-2035
  • Figure 132: Europe Market Value (USD Million) by Sales Channel, 2025-2035
  • Figure 133: Europe Market Value (USD Million) by Country, 2025-2035
  • Figure 134: Europe Market Value (USD Million) Analysis by Country, 2020-2035
  • Figure 135: Europe Market Volume (MT) Analysis by Country, 2020-2035
  • Figure 136: Europe Market Value Share (%) and BPS Analysis by Country, 2025-2035
  • Figure 137: Europe Market Y-o-Y Growth (%) Projections by Country, 2025-2035
  • Figure 138: Europe Market Value (USD Million) Analysis by Product Type, 2020-2035
  • Figure 139: Europe Market Volume (MT) Analysis by Product Type, 2020-2035
  • Figure 140: Europe Market Value Share (%) and BPS Analysis by Product Type, 2025-2035
  • Figure 141: Europe Market Y-o-Y Growth (%) Projections by Product Type, 2025-2035
  • Figure 142: Europe Market Value (USD Million) Analysis by Application, 2020-2035
  • Figure 143: Europe Market Volume (MT) Analysis by Application, 2020-2035
  • Figure 144: Europe Market Value Share (%) and BPS Analysis by Application, 2025-2035
  • Figure 145: Europe Market Y-o-Y Growth (%) Projections by Application, 2025-2035
  • Figure 146: Europe Market Value (USD Million) Analysis by Purity Grade, 2020-2035
  • Figure 147: Europe Market Volume (MT) Analysis by Purity Grade, 2020-2035
  • Figure 148: Europe Market Value Share (%) and BPS Analysis by Purity Grade, 2025-2035
  • Figure 149: Europe Market Y-o-Y Growth (%) Projections by Purity Grade, 2025-2035
  • Figure 150: Europe Market Value (USD Million) Analysis by Source, 2020-2035
  • Figure 151: Europe Market Volume (MT) Analysis by Source, 2020-2035
  • Figure 152: Europe Market Value Share (%) and BPS Analysis by Source, 2025-2035
  • Figure 153: Europe Market Y-o-Y Growth (%) Projections by Source, 2025-2035
  • Figure 154: Europe Market Value (USD Million) Analysis by End User, 2020-2035
  • Figure 155: Europe Market Volume (MT) Analysis by End User, 2020-2035
  • Figure 156: Europe Market Value Share (%) and BPS Analysis by End User, 2025-2035
  • Figure 157: Europe Market Y-o-Y Growth (%) Projections by End User, 2025-2035
  • Figure 158: Europe Market Value (USD Million) Analysis by Sales Channel, 2020-2035
  • Figure 159: Europe Market Volume (MT) Analysis by Sales Channel, 2020-2035
  • Figure 160: Europe Market Value Share (%) and BPS Analysis by Sales Channel, 2025-2035
  • Figure 161: Europe Market Y-o-Y Growth (%) Projections by Sales Channel, 2025-2035
  • Figure 162: Europe Market Attractiveness by Product Type, 2025-2035
  • Figure 163: Europe Market Attractiveness by Application, 2025-2035
  • Figure 164: Europe Market Attractiveness by Purity Grade, 2025-2035
  • Figure 165: Europe Market Attractiveness by Source, 2025-2035
  • Figure 166: Europe Market Attractiveness by End User, 2025-2035
  • Figure 167: Europe Market Attractiveness by Sales Channel, 2025-2035
  • Figure 168: Europe Market Attractiveness by Country, 2025-2035
  • Figure 169: East Asia Market Value (USD Million) by Product Type, 2025-2035
  • Figure 170: East Asia Market Value (USD Million) by Application, 2025-2035
  • Figure 171: East Asia Market Value (USD Million) by Purity Grade, 2025-2035
  • Figure 172: East Asia Market Value (USD Million) by Source, 2025-2035
  • Figure 173: East Asia Market Value (USD Million) by End User, 2025-2035
  • Figure 174: East Asia Market Value (USD Million) by Sales Channel, 2025-2035
  • Figure 175: East Asia Market Value (USD Million) by Country, 2025-2035
  • Figure 176: East Asia Market Value (USD Million) Analysis by Country, 2020-2035
  • Figure 177: East Asia Market Volume (MT) Analysis by Country, 2020-2035
  • Figure 178: East Asia Market Value Share (%) and BPS Analysis by Country, 2025-2035
  • Figure 179: East Asia Market Y-o-Y Growth (%) Projections by Country, 2025-2035
  • Figure 180: East Asia Market Value (USD Million) Analysis by Product Type, 2020-2035
  • Figure 181: East Asia Market Volume (MT) Analysis by Product Type, 2020-2035
  • Figure 182: East Asia Market Value Share (%) and BPS Analysis by Product Type, 2025-2035
  • Figure 183: East Asia Market Y-o-Y Growth (%) Projections by Product Type, 2025-2035
  • Figure 184: East Asia Market Value (USD Million) Analysis by Application, 2020-2035
  • Figure 185: East Asia Market Volume (MT) Analysis by Application, 2020-2035
  • Figure 186: East Asia Market Value Share (%) and BPS Analysis by Application, 2025-2035
  • Figure 187: East Asia Market Y-o-Y Growth (%) Projections by Application, 2025-2035
  • Figure 188: East Asia Market Value (USD Million) Analysis by Purity Grade, 2020-2035
  • Figure 189: East Asia Market Volume (MT) Analysis by Purity Grade, 2020-2035
  • Figure 190: East Asia Market Value Share (%) and BPS Analysis by Purity Grade, 2025-2035
  • Figure 191: East Asia Market Y-o-Y Growth (%) Projections by Purity Grade, 2025-2035
  • Figure 192: East Asia Market Value (USD Million) Analysis by Source, 2020-2035
  • Figure 193: East Asia Market Volume (MT) Analysis by Source, 2020-2035
  • Figure 194: East Asia Market Value Share (%) and BPS Analysis by Source, 2025-2035
  • Figure 195: East Asia Market Y-o-Y Growth (%) Projections by Source, 2025-2035
  • Figure 196: East Asia Market Value (USD Million) Analysis by End User, 2020-2035
  • Figure 197: East Asia Market Volume (MT) Analysis by End User, 2020-2035
  • Figure 198: East Asia Market Value Share (%) and BPS Analysis by End User, 2025-2035
  • Figure 199: East Asia Market Y-o-Y Growth (%) Projections by End User, 2025-2035
  • Figure 200: East Asia Market Value (USD Million) Analysis by Sales Channel, 2020-2035
  • Figure 201: East Asia Market Volume (MT) Analysis by Sales Channel, 2020-2035
  • Figure 202: East Asia Market Value Share (%) and BPS Analysis by Sales Channel, 2025-2035
  • Figure 203: East Asia Market Y-o-Y Growth (%) Projections by Sales Channel, 2025-2035
  • Figure 204: East Asia Market Attractiveness by Product Type, 2025-2035
  • Figure 205: East Asia Market Attractiveness by Application, 2025-2035
  • Figure 206: East Asia Market Attractiveness by Purity Grade, 2025-2035
  • Figure 207: East Asia Market Attractiveness by Source, 2025-2035
  • Figure 208: East Asia Market Attractiveness by End User, 2025-2035
  • Figure 209: East Asia Market Attractiveness by Sales Channel, 2025-2035
  • Figure 210: East Asia Market Attractiveness by Country, 2025-2035
  • Figure 211: South Asia & Pacific Market Value (USD Million) by Product Type, 2025-2035
  • Figure 212: South Asia & Pacific Market Value (USD Million) by Application, 2025-2035
  • Figure 213: South Asia & Pacific Market Value (USD Million) by Purity Grade, 2025-2035
  • Figure 214: South Asia & Pacific Market Value (USD Million) by Source, 2025-2035
  • Figure 215: South Asia & Pacific Market Value (USD Million) by End User, 2025-2035
  • Figure 216: South Asia & Pacific Market Value (USD Million) by Sales Channel, 2025-2035
  • Figure 217: South Asia & Pacific Market Value (USD Million) by Country, 2025-2035
  • Figure 218: South Asia & Pacific Market Value (USD Million) Analysis by Country, 2020-2035
  • Figure 219: South Asia & Pacific Market Volume (MT) Analysis by Country, 2020-2035
  • Figure 220: South Asia & Pacific Market Value Share (%) and BPS Analysis by Country, 2025-2035
  • Figure 221: South Asia & Pacific Market Y-o-Y Growth (%) Projections by Country, 2025-2035
  • Figure 222: South Asia & Pacific Market Value (USD Million) Analysis by Product Type, 2020-2035
  • Figure 223: South Asia & Pacific Market Volume (MT) Analysis by Product Type, 2020-2035
  • Figure 224: South Asia & Pacific Market Value Share (%) and BPS Analysis by Product Type, 2025-2035
  • Figure 225: South Asia & Pacific Market Y-o-Y Growth (%) Projections by Product Type, 2025-2035
  • Figure 226: South Asia & Pacific Market Value (USD Million) Analysis by Application, 2020-2035
  • Figure 227: South Asia & Pacific Market Volume (MT) Analysis by Application, 2020-2035
  • Figure 228: South Asia & Pacific Market Value Share (%) and BPS Analysis by Application, 2025-2035
  • Figure 229: South Asia & Pacific Market Y-o-Y Growth (%) Projections by Application, 2025-2035
  • Figure 230: South Asia & Pacific Market Value (USD Million) Analysis by Purity Grade, 2020-2035
  • Figure 231: South Asia & Pacific Market Volume (MT) Analysis by Purity Grade, 2020-2035
  • Figure 232: South Asia & Pacific Market Value Share (%) and BPS Analysis by Purity Grade, 2025-2035
  • Figure 233: South Asia & Pacific Market Y-o-Y Growth (%) Projections by Purity Grade, 2025-2035
  • Figure 234: South Asia & Pacific Market Value (USD Million) Analysis by Source, 2020-2035
  • Figure 235: South Asia & Pacific Market Volume (MT) Analysis by Source, 2020-2035
  • Figure 236: South Asia & Pacific Market Value Share (%) and BPS Analysis by Source, 2025-2035
  • Figure 237: South Asia & Pacific Market Y-o-Y Growth (%) Projections by Source, 2025-2035
  • Figure 238: South Asia & Pacific Market Value (USD Million) Analysis by End User, 2020-2035
  • Figure 239: South Asia & Pacific Market Volume (MT) Analysis by End User, 2020-2035
  • Figure 240: South Asia & Pacific Market Value Share (%) and BPS Analysis by End User, 2025-2035
  • Figure 241: South Asia & Pacific Market Y-o-Y Growth (%) Projections by End User, 2025-2035
  • Figure 242: South Asia & Pacific Market Value (USD Million) Analysis by Sales Channel, 2020-2035
  • Figure 243: South Asia & Pacific Market Volume (MT) Analysis by Sales Channel, 2020-2035
  • Figure 244: South Asia & Pacific Market Value Share (%) and BPS Analysis by Sales Channel, 2025-2035
  • Figure 245: South Asia & Pacific Market Y-o-Y Growth (%) Projections by Sales Channel, 2025-2035
  • Figure 246: South Asia & Pacific Market Attractiveness by Product Type, 2025-2035
  • Figure 247: South Asia & Pacific Market Attractiveness by Application, 2025-2035
  • Figure 248: South Asia & Pacific Market Attractiveness by Purity Grade, 2025-2035
  • Figure 249: South Asia & Pacific Market Attractiveness by Source, 2025-2035
  • Figure 250: South Asia & Pacific Market Attractiveness by End User, 2025-2035
  • Figure 251: South Asia & Pacific Market Attractiveness by Sales Channel, 2025-2035
  • Figure 252: South Asia & Pacific Market Attractiveness by Country, 2025-2035
  • Figure 253: MEA Market Value (USD Million) by Product Type, 2025-2035
  • Figure 254: MEA Market Value (USD Million) by Application, 2025-2035
  • Figure 255: MEA Market Value (USD Million) by Purity Grade, 2025-2035
  • Figure 256: MEA Market Value (USD Million) by Source, 2025-2035
  • Figure 257: MEA Market Value (USD Million) by End User, 2025-2035
  • Figure 258: MEA Market Value (USD Million) by Sales Channel, 2025-2035
  • Figure 259: MEA Market Value (USD Million) by Country, 2025-2035
  • Figure 260: MEA Market Value (USD Million) Analysis by Country, 2020-2035
  • Figure 261: MEA Market Volume (MT) Analysis by Country, 2020-2035
  • Figure 262: MEA Market Value Share (%) and BPS Analysis by Country, 2025-2035
  • Figure 263: MEA Market Y-o-Y Growth (%) Projections by Country, 2025-2035
  • Figure 264: MEA Market Value (USD Million) Analysis by Product Type, 2020-2035
  • Figure 265: MEA Market Volume (MT) Analysis by Product Type, 2020-2035
  • Figure 266: MEA Market Value Share (%) and BPS Analysis by Product Type, 2025-2035
  • Figure 267: MEA Market Y-o-Y Growth (%) Projections by Product Type, 2025-2035
  • Figure 268: MEA Market Value (USD Million) Analysis by Application, 2020-2035
  • Figure 269: MEA Market Volume (MT) Analysis by Application, 2020-2035
  • Figure 270: MEA Market Value Share (%) and BPS Analysis by Application, 2025-2035
  • Figure 271: MEA Market Y-o-Y Growth (%) Projections by Application, 2025-2035
  • Figure 272: MEA Market Value (USD Million) Analysis by Purity Grade, 2020-2035
  • Figure 273: MEA Market Volume (MT) Analysis by Purity Grade, 2020-2035
  • Figure 274: MEA Market Value Share (%) and BPS Analysis by Purity Grade, 2025-2035
  • Figure 275: MEA Market Y-o-Y Growth (%) Projections by Purity Grade, 2025-2035
  • Figure 276: MEA Market Value (USD Million) Analysis by Source, 2020-2035
  • Figure 277: MEA Market Volume (MT) Analysis by Source, 2020-2035
  • Figure 278: MEA Market Value Share (%) and BPS Analysis by Source, 2025-2035
  • Figure 279: MEA Market Y-o-Y Growth (%) Projections by Source, 2025-2035
  • Figure 280: MEA Market Value (USD Million) Analysis by End User, 2020-2035
  • Figure 281: MEA Market Volume (MT) Analysis by End User, 2020-2035
  • Figure 282: MEA Market Value Share (%) and BPS Analysis by End User, 2025-2035
  • Figure 283: MEA Market Y-o-Y Growth (%) Projections by End User, 2025-2035
  • Figure 284: MEA Market Value (USD Million) Analysis by Sales Channel, 2020-2035
  • Figure 285: MEA Market Volume (MT) Analysis by Sales Channel, 2020-2035
  • Figure 286: MEA Market Value Share (%) and BPS Analysis by Sales Channel, 2025-2035
  • Figure 287: MEA Market Y-o-Y Growth (%) Projections by Sales Channel, 2025-2035
  • Figure 288: MEA Market Attractiveness by Product Type, 2025-2035
  • Figure 289: MEA Market Attractiveness by Application, 2025-2035
  • Figure 290: MEA Market Attractiveness by Purity Grade, 2025-2035
  • Figure 291: MEA Market Attractiveness by Source, 2025-2035
  • Figure 292: MEA Market Attractiveness by End User, 2025-2035
  • Figure 293: MEA Market Attractiveness by Sales Channel, 2025-2035
  • Figure 294: MEA Market Attractiveness by Country, 2025-2035

Frequently Asked Questions

How big is the Bovine Brain Extract in 2025?

The global Bovine Brain Extract is estimated to be valued at USD 555.6 million in 2025.

What will be the size of Bovine Brain Extract in 2035?

The market size for the Bovine Brain Extract is projected to reach USD 1,003.4 million by 2035.

How much will be the Bovine Brain Extract growth between 2025 and 2035?

The Bovine Brain Extract is expected to grow at a 6.1% CAGR between 2025 and 2035.

What are the key product types in the Bovine Brain Extract?

The key product types in the Bovine Brain Extract Market are raw extracts, encapsulated supplements, injectable formulations, functional ingredients, and cosmetic ingredients.

Which application segment to contribute significant share in the Bovine Brain Extract in 2025?

In terms of application, the Cognitive & Memory Support Supplements segment is projected to command the largest share at 25% in the Bovine Brain Extract Market in 2025.

Explore Similar Insights

Future Market Insights

Bovine Brain Extract Market