Brain-Computer Interface Implant Market Size and Share Forecast Outlook 2025 to 2035

The global Brain-Computer Interface (BCI) Implant Market is projected to reach a valuation of USD 351.3 million by 2025 and expand to USD 1,181.1 million by 2035. This reflects a decade-long absolute growth of USD 830.7 million between 2025 and 2035. The market is expected to grow at a compound annual growth rate of 12.9%, resulting in an overall 3.3X increase during the ten-year forecast period.
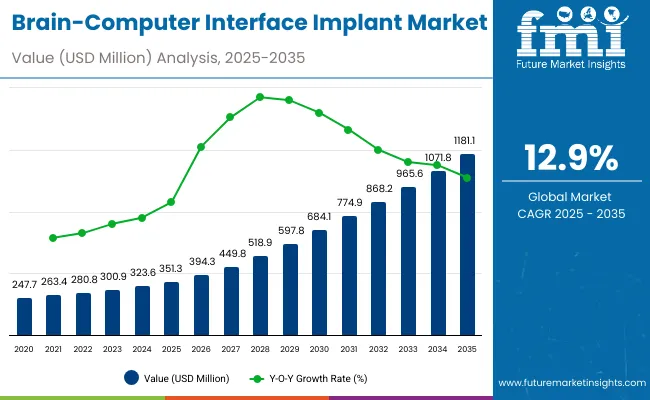
Quick Stats for Brain-Computer Interface (BCI) Implant Market

  • Industry Value (2025): USD 351.3 million
  • Forecast Value (2035): USD 1,181.1 million
  • Forecast CAGR: 12.9%
  • Leading Segment in 2025 (Product Type): Minimally Invasive BCIs (100.0% share)
  • Leading End-User Segment in 2025: Hospitals & Neurology Research Institutes (51.5% share)
  • Key Growth Region: China (13.4% CAGR), Germany (12.2% CAGR), U.S. (10.7% CAGR)
  • Top Key Players: Neuralink, Synchron, Precision Neuroscience, Paradromics, BrainGate / Blackrock Neurotech, CorTec GmbH, Axoft Inc., ONWARD Medical, Science Corporation

Brain Computer Interface Implant Market

Metric Value
Industry Size (2025E) USD 351.3 million
Industry Value (2035F) USD 1,181.1 million
CAGR (2025 to 2035) 12.9%

This robust expansion is primarily driven by continued advancements in neuroprosthetics, brain-signal decoding algorithms, and FDA-backed clinical trials that support commercialization. During the first five-year period from 2025 to 2030, the Brain-Computer Interface (BCI) Implant Market is projected to expand from USD 351.3 million to USD 684.1million, adding approximately USD 332.8million, which accounts for 40.1% of the total decade growth.

The minimally invasive BCI segment will remain the dominant category, holding a substantial share by 2030, driven by its superior neural signal fidelity and use in clinical interventions like paralysis management and neuroprosthetics. Demand remains concentrated across hospital settings, with hospitals contributing over 50% of total adoption, largely due to increased implementation in post-stroke neurorehabilitation and neurosurgery departments.

In the second half from 2030 to 2035, the market will further expand by USD 497.9million, rising from USD 467.9 million to USD 623.2 million, which translates to 59.9% of total growth during the decade. The accelerated growth is expected due to expanded clinical trials, FDA fast-tracking programs, and university-led R&D projects. By 2035, invasive BCIs and minimally invasive BCIs together will capture a combined share of approximately 90.8%, reinforcing their sustained dominance.

In 2025, the BCI Implant Market is expected to reach a value of approximately USD 351.3 million, driven by a shift from research-only applications to clinically embedded neurotechnology systems. Growth will be propelled by hospital investments in neurorehabilitation, regulatory fast-tracking, and demand for implantable systems aiding communication and mobility for individuals with neurodegenerative conditions. Hospitals and academic centers are increasingly adopting invasive and minimally invasive systems embedded with real-time decoding interfaces, cloud-linked data storage, and AI-integrated processing to improve patient outcomes and expand functional applications.

Why Is This Market Growing?

The Brain-Computer Interface (BCI) Implant Market is witnessing strong growth due to increasing clinical demand for neurotechnology solutions that restore communication, mobility, and autonomy in patients with severe neurological impairments. Rising prevalence of conditions such as ALS, spinal cord injuries, and locked-in syndrome is driving hospitals and research institutes to invest in invasive BCI systems that offer high signal fidelity and real-time cognitive decoding.

Regulatory bodies like the FDA and EMA have accelerated innovation through Breakthrough Device Designations, allowing faster clinical integration. Furthermore, AI-driven neural signal processing, miniaturization of implants, and wireless interface advancements are making BCI systems more commercially viable.

Segmental Analysis

The market is segmented by product, technology, end-user, and region. Product categories include Invasive BCIs, Minimally Invasive BCIs, and Non-invasive BCIs, reflecting the varying levels of neural interface integration and clinical complexity. Based on End User, the segmentation includes Hospitals, Neurology Clinics, and Academic & Research Institutes, each playing a distinct role in clinical deployment, neuroprosthetic trials, and brain-machine interface research.

Regionally, the scope spans North America, Latin America, Europe, East Asia, South Asia & Pacific, and the Middle East and Africa, with North America and Europe leading in regulatory approvals, and Asia Pacific showing rising adoption in research-driven neurotechnology deployments.
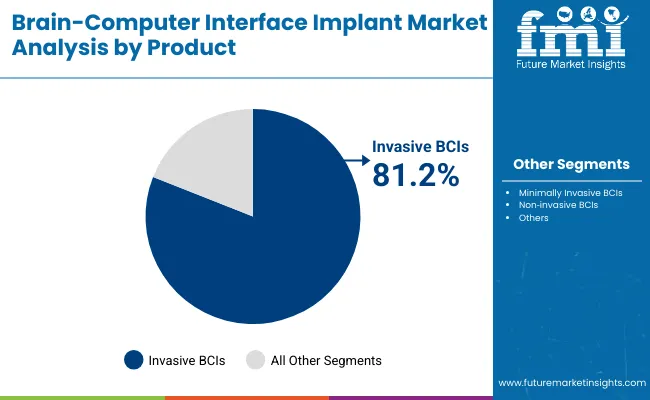
Insights into the Product Segment with Invasive BCIs Leading in Market Share

Brain Computer Interface Implant Market By Product

Product Market Share (%), 2035
Invasive BCIs 79.5%
Minimally Invasive BCIs 11.3%
Non ‑ invasive BCIs 9.2%

Minimally Invasive BCIs are expected to retain a dominant position, contributing 100.0% of the total market in 2025, owing to their superior neural signal accuracy and high clinical utility in treating severe motor and communication impairments. Their adoption has been primarily driven by clinical demand for direct cortical access, enabling real-time control of prosthetic devices and assistive technologies in patients with ALS, spinal cord injuries, and stroke.

Preference has increasingly shifted towards these systems due to their ability to deliver high-resolution brain signal capture, essential for precision-driven neuroprosthetics applications.Invasive BCIs is expected to leap from mid 2030and is predicted to hold a revenue share of 79.5% by 2035. Product development and trials have been incentivized by FDA Breakthrough Device designations, particularly in the USA, supporting the rapid translation of experimental implants into regulated hospital use. These factors have collectively reinforced the demand for invasive BCIs over non-invasive alternatives in high-acuity hospital and specialized neurorehabilitation settings.
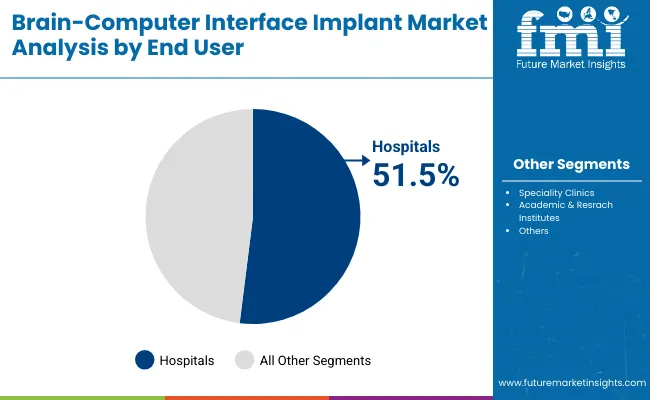
Insights into the End User Segment with Highest implantation Among Hospitals

Brain Computer Interface Implant Market By End User

End User Market Share (%), 2035
Hospitals 49.50%
Speciality Clinics 35.00%
Academic & Research Institutes 15.50%

Hospitals Institutes are expected to remain the largest end-user segment in the BCI implant market, accounting for the highest treatment base by 2025 due to their critical role in neurosurgical interventions and post-acute neurological care. The majority of implantable BCI procedures, including those for paralysis restoration, epilepsy monitoring, and motor recovery, are conducted in hospital settings equipped with neurology and neurosurgery departments.

Demand has been reinforced by the increasing number of patients requiring invasive neural interface procedures and the growing availability of FDA-cleared BCI systems. Hospitals to hold a revenue share of more than 49.5% by 2035. Additionally, government-backed healthcare funding and reimbursement initiatives have supported BCI system acquisition in hospitals, especially those participating in brain-machine interface trials and rehabilitation programs for spinal cord injuries and ALS. These factors position hospitals as the primary driver of clinical-scale adoption of BCI implants.

Regulatory Acceleration Driving Clinical Adoption of BCI Implants

The most significant growth driver in the Brain-Computer Interface (BCI) Implant Market is the regulatory support for clinical BCI innovation, particularly through the USA FDA’s Breakthrough Device Program, which has accelerated approvals for implants targeting conditions like ALS, spinal cord injuries, and locked-in syndrome. Hospitals and neuroscience centers are increasingly investing in implantable BCI systems due to their ability to restore communication and motor function.

Government-backed neurotechnology funding programs in the USA, Japan, and Europe are further catalyzing R&D and pilot deployments. As the number of patients requiring neurorehabilitation increases, demand for high-fidelity invasive BCIs with real-time decoding capabilities is driving procurement in tertiary care and academic research facilities.

Surgical Complexity and Cost Constraints Limit Broader Access

Despite mounting clinical interest, the high complexity of neurosurgical implantation procedures remains a key restraint. The requirement for craniotomies or endovascular navigation, along with postoperative neuro-monitoring, limits access primarily to high-resource hospital environments. In addition, cost burdens related to surgical infrastructure, post-op care, and neural interface calibration often discourage adoption in mid-tier or rural hospitals.

Ethical considerations, regulatory liabilities, and patient apprehension over long-term implant safety further add to institutional hesitancy. Reimbursement gaps and lack of standardized surgical training also continue to hinder mass-market scaling.

AI-Integrated Assistive BCI Platforms Redefining the Competitive Landscape

A transformative trend reshaping the market is the integration of BCI implants into AI-driven, closed-loop assistive technology ecosystems. Leading players are no longer developing BCI hardware in isolation instead, they are embedding their devices within broader platforms that include speech-generating software, neural decoding algorithms, cloud-connected neurodata environments, and wearable IoT interfaces.

Companies like Neuralink and Precision Neuroscience are advancing beyond basic signal acquisition to build multi-layered neurotechnology stacks. These platforms are being adopted not only for medical use but also for cognitive enhancement research and long-term brain-machine symbiosis. As new clinical trials test AI-BCI systems for adaptive learning, movement restoration, and visual prosthesis, hospitals are evaluating BCI implants not just as therapeutic tools but as core components of next-generation neurocomputing infrastructure.
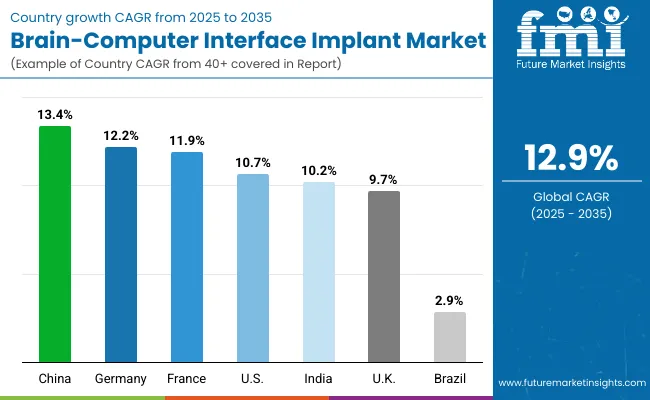
Analysis of Brain-Computer Interface (BCI) Implant Market By Key Countries

Brain Computer Interface Implant Market By Country

Asia Pacific will emerging as the fastest-growing region in the Brain-Computer Interface (BCI) Implant Market, projected to grow at a CAGR of more than 13.0% between 2025 and 2030. Among its leading contributors, Japan is expected to expand at a CAGR of 10.3%, supported by its robust neurotechnology research ecosystem and an aging population seeking assistive neuro-intervention solutions for conditions like ALS and stroke-related paralysis.

South Korea, growing at 9.9% CAGR, benefits from increased investments in academic neuroscience, clinical EEG applications, and government-backed cognitive research programs. The regional dominance is driven by the rapid expansion of neuroscience infrastructure in Tier 1 cities, cross-collaborations between academic institutes and hospitals, and innovation hubs in China, Japan, India, and South Korea that prioritize clinical trials and BCI integration into healthcare delivery models.

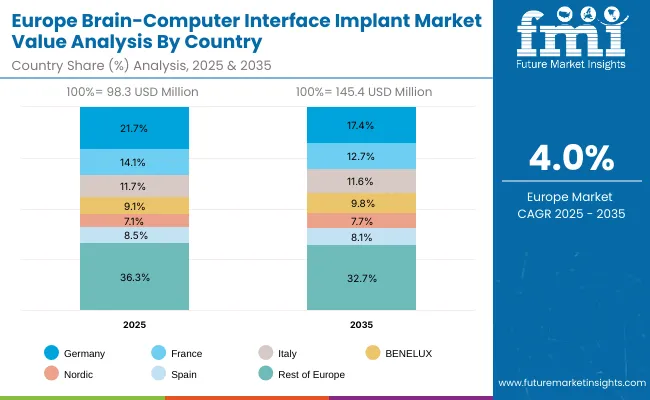
Europe is expected to grow steadily at a CAGR of 11.5% through 2035. Germany will expand at 12.2% CAGR, driven by its university hospital neurotech programs and increased public-private partnerships. France, with a higher 11.9% CAGR, benefits from national health reforms and state funding for assistive technology innovation. The UK is forecast to grow at 9.7% CAGR, fueled by NHS-backed BCI trial programs and infrastructure modernization in neuro-rehabilitation centers. Growth across Europe is reinforced by harmonized medical regulations, public funding for cognitive research, and clinical readiness for adopting invasive and non-invasive BCI solutions.

North America remains a mature yet innovation-led market, with the USA projected to grow at a CAGR of 10.7% between 2025 and 2035. Growth is primarily fueled by the FDA’s Breakthrough Device approvals, which have enabled early-stage human trials for invasive BCIs by companies like Neuralink and Synchron. The USA healthcare system’s early adoption of neuroprosthetic technologies for ALS, spinal injuries, and locked-in syndrome, combined with significant NIH and DARPA funding, has accelerated deployment. Additionally, rising surgical volumes, hospital-led research programs, and AI-integrated neurotechnology platforms are reinforcing BCI demand in clinical neurology and rehabilitation settings.
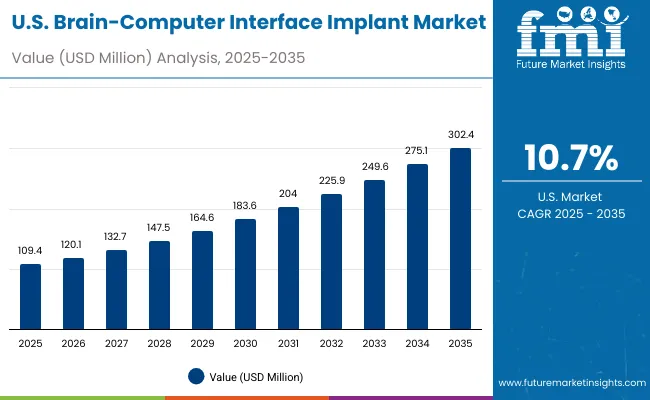
Sales Outlook for Brain-Computer Interface (BCI) Implants in the United States

Brain Computer Interface Implant Market Usa

The BCI implant market in the United States is forecasted to grow at a CAGR of 10.7%, primarily driven by the FDA’s Breakthrough Device approvals and a sharp rise in hospital-led neurorehabilitation programs targeting patients with paralysis, ALS, and locked-in syndrome. Leading neurology centers and academic hospitals are upgrading their infrastructure to support surgical implantation and real-time BCI decoding systems, integrating AI-based software and wireless cortical interfaces. Growth is also being fueled by NIH and DARPA funding aimed at scaling human trials and assistive neurotechnology deployment.

  • Tertiary hospitals are investing in invasive BCI systems to restore mobility and communication in patients with neurodegenerative conditions.
  • Academic research hospitals are conducting pilot studies using EEG and ECoG-based systems for long-term brain-machine interface evaluation.
  • Outpatient neurorehab centers are adopting non-invasive BCI platforms for post-stroke cognitive retraining and assistive communication workflows, aligning with rising outpatient care volume

Growth and Expansion Outlook for BCI Implant Market in the United Kingdom

The Brain-Computer Interface (BCI) Implant Market in the United Kingdom is projected to grow at a CAGR of 9.7% through 2035, driven by NHS-led initiatives focused on neurorehabilitation, assistive technologies, and digital health integration. Programs such as the NHS Long Term Plan and targeted innovation funding under NHSX are enabling academic hospitals and neurology centers to pilot invasive BCI systems for patients with severe motor impairments. Demand is further supported by the UK's growing emphasis on AI-powered medical devices, regulatory backing through the MHRA, and rising public investment in neurological research facilities.

  • NHS Trust hospitals are piloting BCI technologies in specialized neuro-units for ALS and stroke-induced paralysis.
  • University-affiliated research centers are leading trials using EEG and ECoG platforms under UKRI and NIHR funding schemes.
  • Neurorehabilitation clinics are expanding their use of non-invasive BCI systems for outpatient speech restoration and motor training, supported by NHS innovation accelerator programs.

In-depth Analysis of BCI Implant Market in Germany

The Brain-Computer Interface (BCI) Implant Market in Germany is projected to grow at a CAGR of 12.2%, driven by the country’s strong academic research ecosystem and public investment in neurotechnology innovation. Under initiatives linked to Germany’s High-Tech Strategy 2025 and funding from the German Research Foundation (DFG), university hospitals are scaling up BCI-related trials in cognitive restoration, ALS communication systems, and post-stroke rehabilitation. Germany’s adherence to strict medical device standards and surgical protocols is encouraging the deployment of high-precision invasive BCIs in clinical neurology departments.
  • University hospitals are trialing invasive and ECoG-based BCIs integrated with AI-assisted neural decoding software under publicly funded consortia.
  • Private neurorehabilitation clinics are adopting EEG-based BCI systems for outpatient cognitive therapy and motor retraining programs.
  • Biomedical engineering firms are collaborating with hospitals to design modular, implant-compatible neurotech suites aligned with MDR and ISO 13485 certification for advanced neural interface applications.

Europe Brain-Computer Interface (BCI) Implant Market Value Analysis by Country

Brain Computer Interface Implant Market Europe

Market Expansion Outlook for Brain-Computer Interface (BCI) Implant Market in India

The Brain-Computer Interface (BCI) Implant Market in India is expected to grow at a CAGR of 10.2%, making it one of the fastest-growing emerging markets globally. Growth is fueled by large-scale expansion in neuroscience research institutions, AI-enabled neurology departments, and rehabilitation centers across Tier 1 and Tier 2 cities. Rising incidence of neurological disorders, along with increasing academic focus on BCI technologies, has led to early-stage adoption of EEG-based and non-invasive BCI systems in premier hospitals. Indian research universities are also collaborating with local and international firms to develop low-cost BCI solutions optimized for domestic healthcare budgets and infrastructure.

  • Multispecialty hospitals are deploying EEG-based BCI devices to support neurorehabilitation protocols.
  • Research institutes are integrating AI-enabled BCI systems under government-funded innovation missions.
  • Neurology-focused chains in Tier 2 cities are prioritizing compact, low-cost non-invasive systems to address high patient volumes.

Sales Outlook for Brain-Computer Interface (BCI) Implant Market in China

The Brain-Computer Interface (BCI) Implant Market in China is projected to grow at a CAGR of 13.4% through 2035, supported by large-scale hospital modernization programs aligned with the Healthy China 2030 strategy. China’s Ministry of Health is rolling out clinical frameworks to enable precision diagnostics and neurological treatment via AI-integrated EEG and invasive BCI platforms. Urban hospitals are establishing neuroscience labs equipped with BCI systems, while regional facilities are adopting standard EEG and fMRI-integrated devices to boost cognitive care capacity. Domestic manufacturers are also scaling production of EEG/fMRI kits and are increasingly integrating signal analysis software for real-time brain mapping.
  • Tier 1 hospitals are adopting high-resolution invasive BCIs for brain-signal research and neurointervention.
  • County hospitals are deploying standard EEG units to support neurology care workflows.
  • Joint-venture institutions are importing USA and EU-certified BCI systems to align with global best practices.

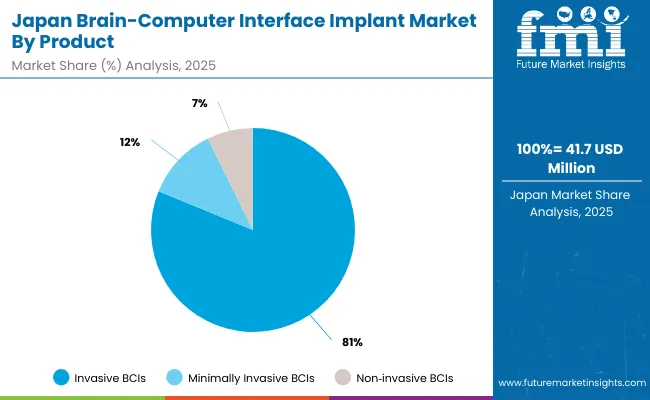
Growth Outlook of Brain-Computer Interface (BCI) Implant Market in Japan

Brain Computer Interface Implant Market Japan

The Brain-Computer Interface (BCI) Implant Market in Japan is projected to reach USD 23.4million by 2035, with Invasive BCIs will account for 77.4% of the revenue share, reflecting Japan’s dual emphasis on surgical precision and neural recovery. This dominant share stems from Japan’s stringent clinical standards under JSHP (Japan Society of Healthcare Policy) and institutional investment in neurodegenerative disease management. Japan’s hospital infrastructure particularly in long-term care is increasingly integrating fMRI and EEG-based assistive systems for aging-related cognitive treatment. Furthermore, domestic suppliers are developing smart BCI modules with localized support.
  • Market in Japan holds 2.0% revenue share of the global market in 2035.
  • Invasive BCIs dominate due to precision-neurosurgery and trial maturity.
  • Growth driven by public funding in automation and compliance with JSHP neurohealth guidelines.

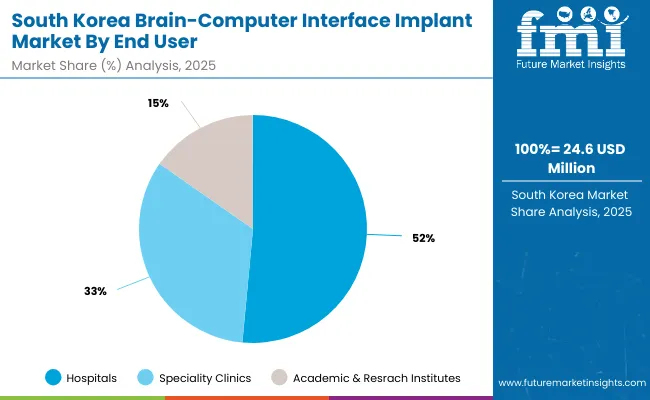
Opportunity Analysis of South Korea in Brain-Computer Interface (BCI) Implant Market

Brain Computer Interface Implant Market South Korea

The Brain-Computer Interface (BCI) Implant Market in South Korea is estimated at USD 14.0 million in 2035. This leadership is driven by Ministry of Health and Welfare (MOHW) directives mandating advanced neurological diagnostic infrastructure across tertiary care hospitals. Hospitals are adopting ISO-certified EEG and MEG workstations for real-time brain signal tracking and treatment of neurological impairments. Neuro-oncology and rehabilitation departments are integrating fMRI for cognitive mapping, supported by research collaborations with academic centers.
  • Market size for South Korea in 2025 is USD 14.0 million.
  • South Korea holds 1.2% of the Global Market.
  • Hospitals segment will lead the market with 49.1% revenue share by 2035.

Competition Landscape

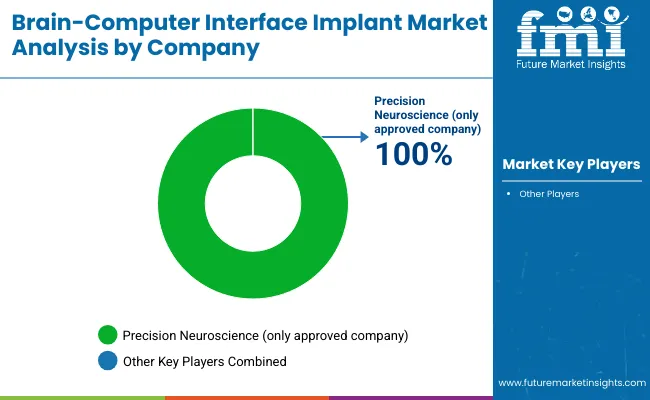
Brain Computer Interface Implant Market By Company

The Brain-Computer Interface (BCI) Implant Market is moderately consolidated, led by deep-tech innovators and neuroengineering pioneers pushing the boundaries of cognitive augmentation and assistive communication. Companies like Synchron are advancing minimally invasive vascular BCI platforms that integrate with medical imaging infrastructure and have progressed into human trials in the USA and Australia. Their implantable systems emphasize functional restoration in paralysis patients with scalable deployment potential.

Neurotechnology companies such as Neuralink and Precision Neuroscience are focused on high-channel neural recording devices with wireless transmission and surgical precision. Precision Neuroscience has the first approved implant in 2025. Neuralink is pioneering brain-controlled device operation, while Precision Neuroscience is targeting ultra-thin cortical strips for enhanced safety and broad patient applicability.

Paradromics is developing high-throughput neural interfaces for severe neurological conditions, aiming for robust data transmission and real-time decoding. BrainGate / Blackrock Neurotech continues to lead academic-clinical collaborations in motor restoration and neural prosthetics, with established protocols in university hospitals. CorTec GmbH is strengthening its position in closed-loop systems, supporting neural signal recording and stimulation in therapeutic research across Europe.

The market’s competitive edge is shifting toward biocompatible design, surgical ease, and clinical-grade software ecosystems to support scalable, regulatory-cleared BCI adoption across healthcare and research settings.

Key Development

  • In August 2025, Neuralink will begin a clinical study in Great Britain to test its brain chip on people with severe paralysis. The study, in partnership with University College London Hospitals and Newcastle Hospitals, aims to help patients control digital and physical tools with their thoughts.
  • In May 2025, ONWARD Medical successfully implanted its ARC-BCI® Therapy into two more individuals, bringing the total to five. This brain-computer interface system is designed to restore thought-driven movement in people with spinal cord injuries.

Scope of the Report

Item Value
Market value USD 351.3 million
Product type Invasive BCIs, Minimally Invasive BCIs, and Non-invasive BCIs,
Technology Electroencephalography (EEG), Magnetoencephalography (MEG), Electrocorticography (ECoG), and Functional Magnetic Resonance Imaging (fMRI),
End User Hospitals, Speciality Clinics, and Academic & Research Institutes
Regions Covered North America, Latin America, Western & Eastern Europe, East Asia, South Asia & Pacific, Middle East & Africa
Countries Covered USA, Brazil, China, India, Germany, France, UK etc.
Key Companies Profiled Synchron, Precision Neuroscience, Neuralink, Paradromics, BrainGate / Blackrock Neurotech, CorTec GmbH, Axoft & Inc., Onward Medical, Science Corporation
Additional Attributes Dollar sales by application and regions, adoption trends of Next-Generation BCI Implants, Rising demand in Neuroscience & Cognitive Research, Growing demand across Assistive Technology and Neurorehabilitation Centers

Key Segments

By Product:

  • Invasive BCIs
  • Minimally Invasive BCIs
  • Non invasive BCIs

By End User:

  • Hospitals
  • Speciality Clinics
  • Academic & Reserach Institutes

By Region:

  • North America
  • Latin America
  • East Asia
  • South Asia
  • Western Europe
  • Eastern Europe
  • Middle East & Africa

Table of Content

  1. Executive Summary
    • Global Market Outlook
    • Demand-side Trends
    • Supply-side Trends
    • Technology Roadmap Analysis
    • Analysis and Recommendations
  2. Market Overview
    • Market Coverage / Taxonomy
    • Market Definition / Scope / Limitations
  3. Market Background
    • Market Dynamics
      • Drivers
      • Restraints
      • Opportunity
      • Trends
    • Scenario Forecast
      • Demand in Optimistic Scenario
      • Demand in Likely Scenario
      • Demand in Conservative Scenario
    • Technology Assessment
    • Product Life Cycle Analysis
  4. 3.9. Regulatory Landscape
  5. Global Market Analysis 2020 to 2024 and Forecast, 2025 to 2035
    • Historical Market Size Value (USD Million) Analysis, 2020 to 2024
    • Current and Future Market Size Value (USD Million) Projections, 2025 to 2035
      • Y-o-Y Growth Trend Analysis
      • Absolute $ Opportunity Analysis
  6. Global Market Analysis 2020 to 2024 and Forecast 2025 to 2035, By Product
    • Introduction / Key Findings
    • Historical Market Size Value (USD Million) Analysis By Product, 2020 to 2024
    • Current and Future Market Size Value (USD Million) Analysis and Forecast By Product, 2025 to 2035
      • Invasive BCIs
      • Minimally Invasive BCIs
      • Non invasive BCIs
    • Y-o-Y Growth Trend Analysis By Product, 2020 to 2024
    • Absolute $ Opportunity Analysis By Product, 2025 to 2035
  7. Global Market Analysis 2020 to 2024 and Forecast 2025 to 2035, By End User
    • Introduction / Key Findings
    • Historical Market Size Value (USD Million) Analysis By End User, 2020 to 2024
    • Current and Future Market Size Value (USD Million) Analysis and Forecast By End User, 2025 to 2035
      • Hospitals
      • Speciality Clinics
      • Academic & Reserach Institutes
    • Y-o-Y Growth Trend Analysis By End User, 2020 to 2024
    • Absolute $ Opportunity Analysis By End User, 2025 to 2035
  8. Global Market Analysis 2020 to 2024 and Forecast 2025 to 2035, By Region
    • Introduction
    • Historical Market Size Value (USD Million) Analysis By Region, 2020 to 2024
    • Current Market Size Value (USD Million) Analysis and Forecast By Region, 2025 to 2035
      • North America
      • Latin America
      • East Asia
      • South Asia
      • Western Europe
      • Eastern Europe
      • Middle East & Africa
    • Market Attractiveness Analysis By Region
  9. North America Market Analysis 2020 to 2024 and Forecast 2025 to 2035, By Country
    • Historical Market Size Value (USD Million) Trend Analysis By Market Taxonomy, 2020 to 2024
    • Market Size Value (USD Million) Forecast By Market Taxonomy, 2025 to 2035
      • By Country
        • USA
        • Canada
        • Mexico
      • By Product
      • By End User
    • Market Attractiveness Analysis
      • By Country
      • By Product
      • By End User
    • Key Takeaways
  10. Latin America Market Analysis 2020 to 2024 and Forecast 2025 to 2035, By Country
    • Historical Market Size Value (USD Million) Trend Analysis By Market Taxonomy, 2020 to 2024
    • Market Size Value (USD Million) Forecast By Market Taxonomy, 2025 to 2035
      • By Country
        • Brazil
        • Rest of Latin America
      • By Product
      • By End User
    • Market Attractiveness Analysis
      • By Country
      • By Product
      • By End User
    • Key Takeaways
  11. East Asia Market Analysis 2020 to 2024 and Forecast 2025 to 2035, By Country
    • Historical Market Size Value (USD Million) Trend Analysis By Market Taxonomy, 2020 to 2024
    • Market Size Value (USD Million) Forecast By Market Taxonomy, 2025 to 2035
      • By Country
        • China
        • Japan
        • South Korea
      • By Product
      • By End User
    • Market Attractiveness Analysis
      • By Country
      • By Product
      • By End User
    • Key Takeaways
  12. South Asia Market Analysis 2020 to 2024 and Forecast 2025 to 2035, By Country
    • Historical Market Size Value (USD Million) Trend Analysis By Market Taxonomy, 2020 to 2024
    • Market Size Value (USD Million) Forecast By Market Taxonomy, 2025 to 2035
      • By Country
        • India
        • ASEAN Countries
        • Australia & New Zealand
        • Rest of South Asia
      • By Product
      • By End User
    • Market Attractiveness Analysis
      • By Country
      • By Product
      • By End User
    • Key Takeaways
  13. Western Europe Market Analysis 2020 to 2024 and Forecast 2025 to 2035, By Country
    • Historical Market Size Value (USD Million) Trend Analysis By Market Taxonomy, 2020 to 2024
    • Market Size Value (USD Million) Forecast By Market Taxonomy, 2025 to 2035
      • By Country
        • Germany
        • UK
        • France
        • Italy
        • Spain
        • BENELUX
        • Nordic Countries
        • Rest of Western Europe
      • By Product
      • By End User
    • Market Attractiveness Analysis
      • By Country
      • By Product
      • By End User
    • Key Takeaways
  14. Eastern Europe Market Analysis 2020 to 2024 and Forecast 2025 to 2035, By Country
    • Historical Market Size Value (USD Million) Trend Analysis By Market Taxonomy, 2020 to 2024
    • Market Size Value (USD Million) Forecast By Market Taxonomy, 2025 to 2035
      • By Country
        • Russia
        • Hungary
        • Poland
        • Rest of Eastern Europe
      • By Product
      • By End User
    • Market Attractiveness Analysis
      • By Country
      • By Product
      • By End User
    • Key Takeaways
  15. Middle East & Africa Market Analysis 2020 to 2024 and Forecast 2025 to 2035, By Country
    • Historical Market Size Value (USD Million) Trend Analysis By Market Taxonomy, 2020 to 2024
    • Market Size Value (USD Million) Forecast By Market Taxonomy, 2025 to 2035
      • By Country
        • Saudi Arabia
        • Other GCC Countries
        • Türkiye
        • South Africa
        • Rest of MEA
      • By Product
      • By End User
    • Market Attractiveness Analysis
      • By Country
      • By Product
      • By End User
    • Key Takeaways
  16. Key Countries Market Analysis
    • USA
      • Pricing Analysis
      • Market Share Analysis, 2024
        • By Product
        • By End User
    • Canada
      • Pricing Analysis
      • Market Share Analysis, 2024
        • By Product
        • By End User
    • Brazil
      • Pricing Analysis
      • Market Share Analysis, 2024
        • By Product
        • By End User
    • Rest of Latin America
      • Pricing Analysis
      • Market Share Analysis, 2024
        • By Product
        • By End User
    • China
      • Pricing Analysis
      • Market Share Analysis, 2024
        • By Product
        • By End User
    • Japan
      • Pricing Analysis
      • Market Share Analysis, 2024
        • By Product
        • By End User
    • South Korea
      • Pricing Analysis
      • Market Share Analysis, 2024
        • By Product
        • By End User
    • India
      • Pricing Analysis
      • Market Share Analysis, 2024
        • By Product
        • By End User
    • ASEAN Countries
      • Pricing Analysis
      • Market Share Analysis, 2024
        • By Product
        • By End User
    • Australia & New Zealand
      • Pricing Analysis
      • Market Share Analysis, 2024
        • By Product
        • By End User
    • Rest of South Asia
      • Pricing Analysis
      • Market Share Analysis, 2024
        • By Product
        • By End User
    • Germany
      • Pricing Analysis
      • Market Share Analysis, 2024
        • By Product
        • By End User
    • UK
      • Pricing Analysis
      • Market Share Analysis, 2024
        • By Product
        • By End User
    • France
      • Pricing Analysis
      • Market Share Analysis, 2024
        • By Product
        • By End User
    • Italy
      • Pricing Analysis
      • Market Share Analysis, 2024
        • By Product
        • By End User
    • Spain
      • Pricing Analysis
      • Market Share Analysis, 2024
        • By Product
        • By End User
    • BENELUX
      • Pricing Analysis
      • Market Share Analysis, 2024
        • By Product
        • By End User
    • Nordic Countries
      • Pricing Analysis
      • Market Share Analysis, 2024
        • By Product
        • By End User
    • Rest of Western Europe
      • Pricing Analysis
      • Market Share Analysis, 2024
        • By Product
        • By End User
    • Russia
      • Pricing Analysis
      • Market Share Analysis, 2024
        • By Product
        • By End User
    • Hungary
      • Pricing Analysis
      • Market Share Analysis, 2024
        • By Product
        • By End User
    • Poland
      • Pricing Analysis
      • Market Share Analysis, 2024
        • By Product
        • By End User
    • Rest of Eastern Europe
      • Pricing Analysis
      • Market Share Analysis, 2024
        • By Product
        • By End User
    • Saudi Arabia
      • Pricing Analysis
      • Market Share Analysis, 2024
        • By Product
        • By End User
    • Other GCC Countries
      • Pricing Analysis
      • Market Share Analysis, 2024
        • By Product
        • By End User
    • Türkiye
      • Pricing Analysis
      • Market Share Analysis, 2024
        • By Product
        • By End User
    • South Africa
      • Pricing Analysis
      • Market Share Analysis, 2024
        • By Product
        • By End User
    • Rest of MEA
      • Pricing Analysis
      • Market Share Analysis, 2024
        • By Product
        • By End User
  17. Market Structure Analysis
    • Competition Dashboard
    • Competition Benchmarking
    • Market Share Analysis of Top Players
      • By Regional
      • By Product
      • By End User
  18. Competition Analysis
    • Competition Deep Dive
      • Precision Neuroscience
        • Overview
        • Product Portfolio
        • Segmental Revenue Analysis
        • Sales Footprint
        • Strategy Overview
          • Marketing Strategy
          • Product Strategy
          • Channel Strategy
      • Science Corporation
        • Overview
        • Product Portfolio
        • Segmental Revenue Analysis
        • Sales Footprint
        • Strategy Overview
          • Marketing Strategy
          • Product Strategy
          • Channel Strategy
      • ONWARD Medical
        • Overview
        • Product Portfolio
        • Segmental Revenue Analysis
        • Sales Footprint
        • Strategy Overview
          • Marketing Strategy
          • Product Strategy
          • Channel Strategy
      • Neuralink
        • Overview
        • Product Portfolio
        • Segmental Revenue Analysis
        • Sales Footprint
        • Strategy Overview
          • Marketing Strategy
          • Product Strategy
          • Channel Strategy
      • Synchron
        • Overview
        • Product Portfolio
        • Segmental Revenue Analysis
        • Sales Footprint
        • Strategy Overview
          • Marketing Strategy
          • Product Strategy
          • Channel Strategy
      • Axoft Inc.
        • Overview
        • Product Portfolio
        • Segmental Revenue Analysis
        • Sales Footprint
        • Strategy Overview
          • Marketing Strategy
          • Product Strategy
          • Channel Strategy
      • Blackrock Neurotech
        • Overview
        • Product Portfolio
        • Segmental Revenue Analysis
        • Sales Footprint
        • Strategy Overview
          • Marketing Strategy
          • Product Strategy
          • Channel Strategy
      • CorTec GmbH
        • Overview
        • Product Portfolio
        • Segmental Revenue Analysis
        • Sales Footprint
        • Strategy Overview
          • Marketing Strategy
          • Product Strategy
          • Channel Strategy
  19. Assumptions & Acronyms Used
  20. Research Methodology

List of Tables

  • Table 1: Global Market Value (USD Million) Forecast by Region, 2020-2035
  • Table 2: Global Market Value (USD Million) Forecast by Product, 2020-2035
  • Table 3: Global Market Value (USD Million) Forecast by End User, 2020-2035
  • Table 4: North America Market Value (USD Million) Forecast by Country, 2020-2035
  • Table 5: North America Market Value (USD Million) Forecast by Product, 2020-2035
  • Table 6: North America Market Value (USD Million) Forecast by End User, 2020-2035
  • Table 7: Latin America Market Value (USD Million) Forecast by Country, 2020-2035
  • Table 8: Latin America Market Value (USD Million) Forecast by Product, 2020-2035
  • Table 9: Latin America Market Value (USD Million) Forecast by End User, 2020-2035
  • Table 10: East Asia Market Value (USD Million) Forecast by Country, 2020-2035
  • Table 11: East Asia Market Value (USD Million) Forecast by Product, 2020-2035
  • Table 12: East Asia Market Value (USD Million) Forecast by End User, 2020-2035
  • Table 13: South Asia Market Value (USD Million) Forecast by Country, 2020-2035
  • Table 14: South Asia Market Value (USD Million) Forecast by Product, 2020-2035
  • Table 15: South Asia Market Value (USD Million) Forecast by End User, 2020-2035
  • Table 16: Western Europe Market Value (USD Million) Forecast by Country, 2020-2035
  • Table 17: Western Europe Market Value (USD Million) Forecast by Product, 2020-2035
  • Table 18: Western Europe Market Value (USD Million) Forecast by End User, 2020-2035
  • Table 19: Eastern Europe Market Value (USD Million) Forecast by Country, 2020-2035
  • Table 20: Eastern Europe Market Value (USD Million) Forecast by Product, 2020-2035
  • Table 21: Eastern Europe Market Value (USD Million) Forecast by End User, 2020-2035
  • Table 22: Middle East & Africa Market Value (USD Million) Forecast by Country, 2020-2035
  • Table 23: Middle East & Africa Market Value (USD Million) Forecast by Product, 2020-2035
  • Table 24: Middle East & Africa Market Value (USD Million) Forecast by End User, 2020-2035

List of Figures

  • Figure 1: Global Market Value (USD Million) by Product, 2025-2035
  • Figure 2: Global Market Value (USD Million) by End User, 2025-2035
  • Figure 3: Global Market Value (USD Million) by Region, 2025-2035
  • Figure 4: Global Market Value (USD Million) Analysis by Region, 2020-2035
  • Figure 5: Global Market Value Share (%) and BPS Analysis by Region, 2025-2035
  • Figure 6: Global Market Y-o-Y Growth (%) Projections by Region, 2025-2035
  • Figure 7: Global Market Value (USD Million) Analysis by Product, 2020-2035
  • Figure 8: Global Market Value Share (%) and BPS Analysis by Product, 2025-2035
  • Figure 9: Global Market Y-o-Y Growth (%) Projections by Product, 2025-2035
  • Figure 10: Global Market Value (USD Million) Analysis by End User, 2020-2035
  • Figure 11: Global Market Value Share (%) and BPS Analysis by End User, 2025-2035
  • Figure 12: Global Market Y-o-Y Growth (%) Projections by End User, 2025-2035
  • Figure 13: Global Market Attractiveness by Product, 2025-2035
  • Figure 14: Global Market Attractiveness by End User, 2025-2035
  • Figure 15: Global Market Attractiveness by Region, 2025-2035
  • Figure 16: North America Market Value (USD Million) by Product, 2025-2035
  • Figure 17: North America Market Value (USD Million) by End User, 2025-2035
  • Figure 18: North America Market Value (USD Million) by Country, 2025-2035
  • Figure 19: North America Market Value (USD Million) Analysis by Country, 2020-2035
  • Figure 20: North America Market Value Share (%) and BPS Analysis by Country, 2025-2035
  • Figure 21: North America Market Y-o-Y Growth (%) Projections by Country, 2025-2035
  • Figure 22: North America Market Value (USD Million) Analysis by Product, 2020-2035
  • Figure 23: North America Market Value Share (%) and BPS Analysis by Product, 2025-2035
  • Figure 24: North America Market Y-o-Y Growth (%) Projections by Product, 2025-2035
  • Figure 25: North America Market Value (USD Million) Analysis by End User, 2020-2035
  • Figure 26: North America Market Value Share (%) and BPS Analysis by End User, 2025-2035
  • Figure 27: North America Market Y-o-Y Growth (%) Projections by End User, 2025-2035
  • Figure 28: North America Market Attractiveness by Product, 2025-2035
  • Figure 29: North America Market Attractiveness by End User, 2025-2035
  • Figure 30: North America Market Attractiveness by Country, 2025-2035
  • Figure 31: Latin America Market Value (USD Million) by Product, 2025-2035
  • Figure 32: Latin America Market Value (USD Million) by End User, 2025-2035
  • Figure 33: Latin America Market Value (USD Million) by Country, 2025-2035
  • Figure 34: Latin America Market Value (USD Million) Analysis by Country, 2020-2035
  • Figure 35: Latin America Market Value Share (%) and BPS Analysis by Country, 2025-2035
  • Figure 36: Latin America Market Y-o-Y Growth (%) Projections by Country, 2025-2035
  • Figure 37: Latin America Market Value (USD Million) Analysis by Product, 2020-2035
  • Figure 38: Latin America Market Value Share (%) and BPS Analysis by Product, 2025-2035
  • Figure 39: Latin America Market Y-o-Y Growth (%) Projections by Product, 2025-2035
  • Figure 40: Latin America Market Value (USD Million) Analysis by End User, 2020-2035
  • Figure 41: Latin America Market Value Share (%) and BPS Analysis by End User, 2025-2035
  • Figure 42: Latin America Market Y-o-Y Growth (%) Projections by End User, 2025-2035
  • Figure 43: Latin America Market Attractiveness by Product, 2025-2035
  • Figure 44: Latin America Market Attractiveness by End User, 2025-2035
  • Figure 45: Latin America Market Attractiveness by Country, 2025-2035
  • Figure 46: East Asia Market Value (USD Million) by Product, 2025-2035
  • Figure 47: East Asia Market Value (USD Million) by End User, 2025-2035
  • Figure 48: East Asia Market Value (USD Million) by Country, 2025-2035
  • Figure 49: East Asia Market Value (USD Million) Analysis by Country, 2020-2035
  • Figure 50: East Asia Market Value Share (%) and BPS Analysis by Country, 2025-2035
  • Figure 51: East Asia Market Y-o-Y Growth (%) Projections by Country, 2025-2035
  • Figure 52: East Asia Market Value (USD Million) Analysis by Product, 2020-2035
  • Figure 53: East Asia Market Value Share (%) and BPS Analysis by Product, 2025-2035
  • Figure 54: East Asia Market Y-o-Y Growth (%) Projections by Product, 2025-2035
  • Figure 55: East Asia Market Value (USD Million) Analysis by End User, 2020-2035
  • Figure 56: East Asia Market Value Share (%) and BPS Analysis by End User, 2025-2035
  • Figure 57: East Asia Market Y-o-Y Growth (%) Projections by End User, 2025-2035
  • Figure 58: East Asia Market Attractiveness by Product, 2025-2035
  • Figure 59: East Asia Market Attractiveness by End User, 2025-2035
  • Figure 60: East Asia Market Attractiveness by Country, 2025-2035
  • Figure 61: South Asia Market Value (USD Million) by Product, 2025-2035
  • Figure 62: South Asia Market Value (USD Million) by End User, 2025-2035
  • Figure 63: South Asia Market Value (USD Million) by Country, 2025-2035
  • Figure 64: South Asia Market Value (USD Million) Analysis by Country, 2020-2035
  • Figure 65: South Asia Market Value Share (%) and BPS Analysis by Country, 2025-2035
  • Figure 66: South Asia Market Y-o-Y Growth (%) Projections by Country, 2025-2035
  • Figure 67: South Asia Market Value (USD Million) Analysis by Product, 2020-2035
  • Figure 68: South Asia Market Value Share (%) and BPS Analysis by Product, 2025-2035
  • Figure 69: South Asia Market Y-o-Y Growth (%) Projections by Product, 2025-2035
  • Figure 70: South Asia Market Value (USD Million) Analysis by End User, 2020-2035
  • Figure 71: South Asia Market Value Share (%) and BPS Analysis by End User, 2025-2035
  • Figure 72: South Asia Market Y-o-Y Growth (%) Projections by End User, 2025-2035
  • Figure 73: South Asia Market Attractiveness by Product, 2025-2035
  • Figure 74: South Asia Market Attractiveness by End User, 2025-2035
  • Figure 75: South Asia Market Attractiveness by Country, 2025-2035
  • Figure 76: Western Europe Market Value (USD Million) by Product, 2025-2035
  • Figure 77: Western Europe Market Value (USD Million) by End User, 2025-2035
  • Figure 78: Western Europe Market Value (USD Million) by Country, 2025-2035
  • Figure 79: Western Europe Market Value (USD Million) Analysis by Country, 2020-2035
  • Figure 80: Western Europe Market Value Share (%) and BPS Analysis by Country, 2025-2035
  • Figure 81: Western Europe Market Y-o-Y Growth (%) Projections by Country, 2025-2035
  • Figure 82: Western Europe Market Value (USD Million) Analysis by Product, 2020-2035
  • Figure 83: Western Europe Market Value Share (%) and BPS Analysis by Product, 2025-2035
  • Figure 84: Western Europe Market Y-o-Y Growth (%) Projections by Product, 2025-2035
  • Figure 85: Western Europe Market Value (USD Million) Analysis by End User, 2020-2035
  • Figure 86: Western Europe Market Value Share (%) and BPS Analysis by End User, 2025-2035
  • Figure 87: Western Europe Market Y-o-Y Growth (%) Projections by End User, 2025-2035
  • Figure 88: Western Europe Market Attractiveness by Product, 2025-2035
  • Figure 89: Western Europe Market Attractiveness by End User, 2025-2035
  • Figure 90: Western Europe Market Attractiveness by Country, 2025-2035
  • Figure 91: Eastern Europe Market Value (USD Million) by Product, 2025-2035
  • Figure 92: Eastern Europe Market Value (USD Million) by End User, 2025-2035
  • Figure 93: Eastern Europe Market Value (USD Million) by Country, 2025-2035
  • Figure 94: Eastern Europe Market Value (USD Million) Analysis by Country, 2020-2035
  • Figure 95: Eastern Europe Market Value Share (%) and BPS Analysis by Country, 2025-2035
  • Figure 96: Eastern Europe Market Y-o-Y Growth (%) Projections by Country, 2025-2035
  • Figure 97: Eastern Europe Market Value (USD Million) Analysis by Product, 2020-2035
  • Figure 98: Eastern Europe Market Value Share (%) and BPS Analysis by Product, 2025-2035
  • Figure 99: Eastern Europe Market Y-o-Y Growth (%) Projections by Product, 2025-2035
  • Figure 100: Eastern Europe Market Value (USD Million) Analysis by End User, 2020-2035
  • Figure 101: Eastern Europe Market Value Share (%) and BPS Analysis by End User, 2025-2035
  • Figure 102: Eastern Europe Market Y-o-Y Growth (%) Projections by End User, 2025-2035
  • Figure 103: Eastern Europe Market Attractiveness by Product, 2025-2035
  • Figure 104: Eastern Europe Market Attractiveness by End User, 2025-2035
  • Figure 105: Eastern Europe Market Attractiveness by Country, 2025-2035
  • Figure 106: Middle East & Africa Market Value (USD Million) by Product, 2025-2035
  • Figure 107: Middle East & Africa Market Value (USD Million) by End User, 2025-2035
  • Figure 108: Middle East & Africa Market Value (USD Million) by Country, 2025-2035
  • Figure 109: Middle East & Africa Market Value (USD Million) Analysis by Country, 2020-2035
  • Figure 110: Middle East & Africa Market Value Share (%) and BPS Analysis by Country, 2025-2035
  • Figure 111: Middle East & Africa Market Y-o-Y Growth (%) Projections by Country, 2025-2035
  • Figure 112: Middle East & Africa Market Value (USD Million) Analysis by Product, 2020-2035
  • Figure 113: Middle East & Africa Market Value Share (%) and BPS Analysis by Product, 2025-2035
  • Figure 114: Middle East & Africa Market Y-o-Y Growth (%) Projections by Product, 2025-2035
  • Figure 115: Middle East & Africa Market Value (USD Million) Analysis by End User, 2020-2035
  • Figure 116: Middle East & Africa Market Value Share (%) and BPS Analysis by End User, 2025-2035
  • Figure 117: Middle East & Africa Market Y-o-Y Growth (%) Projections by End User, 2025-2035
  • Figure 118: Middle East & Africa Market Attractiveness by Product, 2025-2035
  • Figure 119: Middle East & Africa Market Attractiveness by End User, 2025-2035
  • Figure 120: Middle East & Africa Market Attractiveness by Country, 2025-2035

Frequently Asked Questions

How big is the Brain-Computer Interface (BCI) Implant Market in 2025?

The global Brain-Computer Interface (BCI) Implant Market is estimated to be valued at USD 351.3 million in 2025.

What will be the size of the Brain-Computer Interface (BCI) Implant Market in 2035?

The market size for BCI Implants is projected to reach USD 1,181.1 million by 2035.

How much will the Brain-Computer Interface (BCI) Implant Market grow between 2025 and 2035?

The BCI Implant Market is expected to grow at a CAGR of 12.9% during this period.

What are the key product types in the Brain-Computer Interface (BCI) Implant Market?

Key product types include Invasive BCIs, Minimally Invasive BCIs, and Non-Invasive BCIs.

Which end-user segment will contribute a significant share in the Brain-Computer Interface (BCI) Implant Market in 2025?

The Hospitals segment is projected to command the largest share at 51.5% in 2025.

Explore Similar Insights

Future Market Insights

Brain Computer Interface Implant Market