The computer-aided design (CAD) market is anticipated to witness sustained expansion throughout the forecast period due to its increasing adoption across industries such as automotive, aerospace, construction, and packaging.
The global CAD market is estimated to reach a valuation of USD 12.2 billion by 2025 and is further projected to surpass USD 22.7 billion by 2035.The industry is expected to exhibit a steady CAGR of 6.4% between 2025 and 2035. Significant growth is anticipated in the 3-D design type segment, which is likely to dominate the market by holding a share of 74.3% in 2025. The Windows operating system will retain its dominance across global markets with a market share of 62.5% in the same year.
In February 2025, Autodesk Inc. officially announced a 9% reduction in its global workforce, affecting approximately 1,350 employees, as part of a strategic restructuring initiative aimed at enhancing operational efficiency and reallocating resources toward artificial intelligence, cloud services, and platform development.
According to a report by MarketWatch, CEO Andrew Anagnost stated that this move aligns with the company’s transition to a subscription-based model, with the goal of boosting productivity and delivering greater value to customers and partners while supporting future innovation. This restructuring reflects the company’s commitment to adapting its business model in response to evolving market demands and technological advancements.
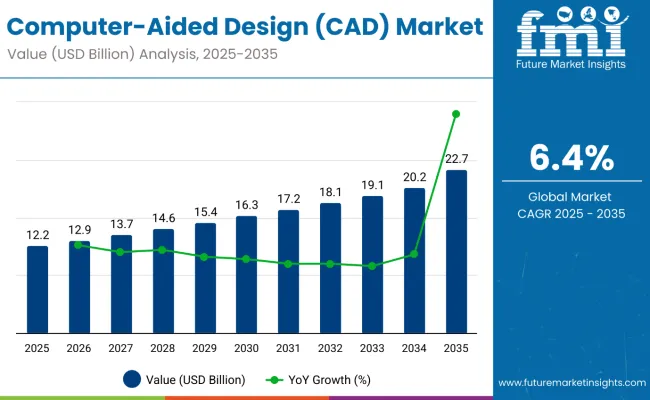
| Attributes | Details |
|---|---|
| Estimated Market Size (2025) | USD 12.2 billion |
| Projected Market Size (2035) | USD 22.7 billion |
| Value-based CAGR (2025 to 2035) | 6.4% |
The rise in demand for advanced packaging solutions, digital twin simulations, and Industry 4.0 technologies is driving the adoption of CAD software worldwide. Manufacturers increasingly require 3-D CAD tools to design complex components and simulate product performance, reducing physical prototyping costs and improving time-to-market. Additionally, the growing focus on customization and automation in various industries further supports the need for advanced CAD solutions.
Moreover, cloud-based CAD platforms are gaining traction, enabling collaborative design processes across geographically dispersed teams. Such platforms enhance scalability, data security, and flexibility in the design process, especially in small and medium enterprises (SMEs) that seek cost-effective solutions. The use of CAD in the healthcare sector for designing medical devices and prosthetics is another emerging application area contributing to the market's growth.
Windows remains the preferred operating system for CAD applications due to its widespread adoption in the corporate and educational sectors. Meanwhile, mobile and macOS-based CAD solutions are slowly capturing niche segments but are unlikely to overtake Windows dominance in the foreseeable future.
Despite these opportunities, the market also faces challenges such as high software costs, the need for skilled designers, and interoperability issues among different CAD platforms. However, ongoing technological advancements, such as AI integration and cloud deployment models, are expected to mitigate these limitations over time.
Leading companies in the CAD market are integrating advanced technologies such as artificial intelligence, machine learning, and automation to enhance design accuracy, efficiency, and innovation. These smart solutions enable automated workflows, error detection, and optimization of complex designs across multiple industries including automotive, aerospace, architecture, and manufacturing.
In 2025, the 3-D design type segment will dominate the Computer Aided Engineering (CAE) Software Market, capturing a substantial 74.3% market share due to its growing importance in complex product simulations. Windows will remain the preferred operating system, holding a leading 62.5% market share, owing to its widespread adoption across engineering and industrial design sectors.
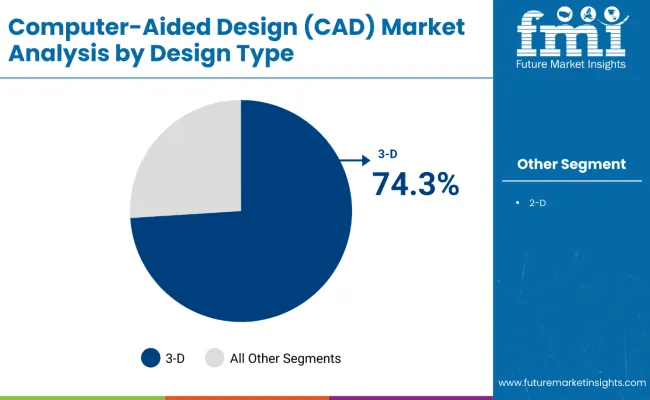
The 3-D segment is projected to lead the design type category in 2025 with a commanding market share of 74.3% in the global CAE Software Market. This dominance arises from the increasing need for precise, realistic simulations that help optimize product design and performance in industries such as automotive, aerospace, and electronics.
3-D CAE tools enable designers and engineers to visualize complex geometries, stress points, thermal behavior, and fluid dynamics with unparalleled accuracy. As product complexity rises and digital prototyping becomes crucial for cost and time reduction, 3-D design solutions gain preference.
Leading CAE software providers, such as Dassault Systèmes, Siemens Digital Industries Software, and Autodesk Inc., offer advanced 3-D modeling and simulation capabilities tailored to industry-specific requirements. The surge in additive manufacturing, smart factory deployment, and Industry 4.0 trends further bolsters demand for 3-D CAE solutions. The ability to integrate with virtual twin technologies and augmented reality systems enhances their utility, ensuring 3-D design remains the primary choice for companies pursuing innovative and efficient product development processes.
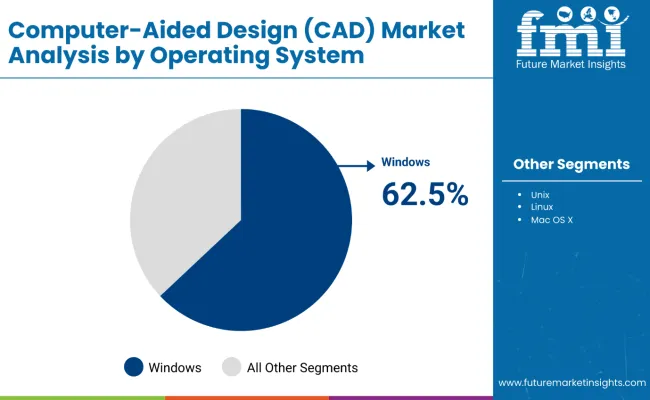
Windows is expected to remain the dominant operating system in the CAE Software Market, holding a significant 62.5% market share in 2025. The widespread usage of Windows-based systems in commercial, industrial, and academic environments makes it the preferred platform for most CAE applications.
Major CAE software providers, including Ansys Inc., Altair Engineering, and Siemens Digital Industries Software, develop and optimize their solutions primarily for Windows, ensuring compatibility, scalability, and user-friendliness. Windows’ strong presence in engineering departments, design studios, and manufacturing firms worldwide contributes to its continued leadership in this segment.
Moreover, Windows offers seamless integration with various supporting tools such as CAD software, PLM systems, and data analytics platforms-features essential for comprehensive simulation and design workflows. Its compatibility with affordable hardware configurations and extensive technical support network reinforces its market position. Despite the presence of other operating systems like Linux, Unix, and Mac OS X, Windows remains the platform of choice due to its accessibility, ease of use, and strong ecosystem support across CAE applications.
Extensive Application in Several End-use industries to Augment Market Growth of CAD Software
The adoption of CAD design platforms in various manufacturing industries and disciplines to generate models and drawings is the major driver of the growth of the global CAD market. The increasing adoption of virtual platforms for product development in manufacturing industries is expected to drive the consumption of CAD software. The CAD-based designs are used throughout the life cycle of a product and at different stages such as design verification, concept verification, and failure verification.
The manufacturers adopt the implementation of CAD software in the product development phase as it helps in improving the quality of the product. The CAD-based design is extensively used in the automotive industry and the OEMs are consistently focusing on improving the design parameters. The rapid growth in the automotive industry is expected to propel the growth of the global CAD market.
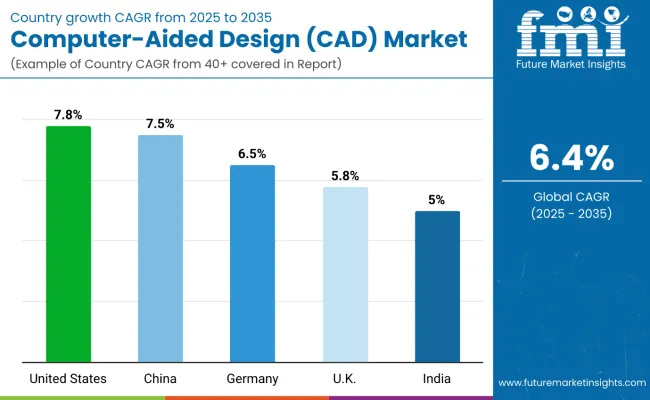
In terms of geographic divisions, North America held the largest share, accounting for 39.8% share in Computer-Aided Design (CAD) in 2021. According to Future Market Insights analysis, the region is projected to maintain its governance over the projection period, backed by the soaring application in the packaging and manufacturing industry.
The market growth in North American CAD is also boosted by additional funding offered by the US government for deploying digitization solutions that will augment the development of the manufacturing industry in the region, thus boosting the implementation of 3D CAD software solutions. The presence of key players, such as Autodesk Inc., PTC, DassaultSystèmes, and DassaultSystèmes SolidWorks Corp., in the region is also fueling the market growth.
These players are expanding their market reach using collaborations and mergers. For instance, an agreement was signed by 3D Systems Corporation in September 2021 for acquiring Oqton Inc., a software company that offers cloud-based manufacturing operating system (MOS) platforms. Owing to this, the market for CAD software is forecasted to witness moderate growth over the assessment period.
Based on Future Market Insight’s recent analysis, Europe is the second-largest region in terms of revenue share, accounting for nearly 22.9% of the share of the computer-aided design (CAD) market. Prominent countries contributing to the regional revenue share of Computer-Aided Design (CAD) are Germany, the United Kingdom, and France. Owing to the increasing deployment of Building Information Management (BIM) solutions by AEC businesses in the United Kingdom, the European CAD market is likely to witness significant gains during the forecast period.
The implementation of computer-aided design software in the healthcare segment has revolutionized the industry and developers are focusing on improving the capabilities of medical equipment.
CAD software is extensively used in patient care processes, such as lesion detection, characterization, cancer staging, treatment planning, response assessment, recurrence, and prognosis prediction. The new state-of-the-art machine learning technique, known as deep learning (DL), has revolutionized speech and text recognition as well as computer vision.
According to Future Market Insights, Asia Pacific’s market is anticipated to register rapid growth throughout the forecast period. This market growth is attributed to the rising adoption of cloud-based mechanical CAD software in the mechatronics industry and is anticipated to propel the growth of the CAD market in the region.
The extensive growth in the region’s engineering, design, and development sectors is anticipated to boost the adoption of designing and modeling tools over the forecast period. Prominent manufacturers of healthcare equipment have been making hefty investments the technological advancements and are emphasizing the adoption of CAD designs for the development of medical devices in the region.
Also, the rapid growth of the automotive industry is expected to boost the growth of the CAD market in the region. Japan holds a major share in the robotics and mechatronics industry, which is anticipated to boost the growth of the CAD market in the country.
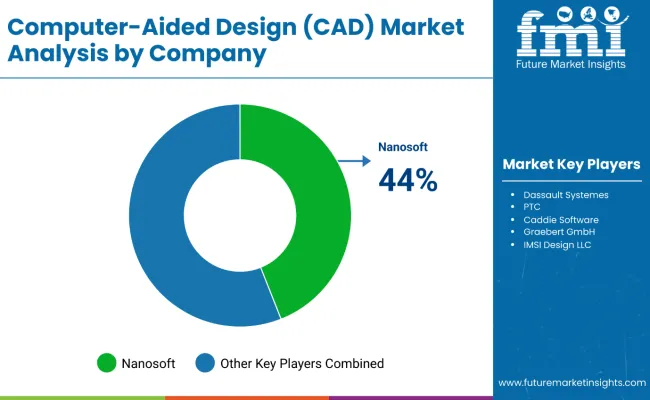
What are the Leading Players in the Computer-Aided Design (CAD) Market Up to?
Recent Developments
| Attribute | Details |
|---|---|
| Estimated Market Size (2025E) | USD 12.2 billion |
| Projected Market Size (2035F) | USD 22.7 billion |
| Value-based CAGR (2025 to 2035) | 6.4% |
| Forecast Period | 2025 to 2035 |
| Historical Data | 2018 to 2024 |
| Base Year | 2024 |
| Quantitative Units | Value in USD billion, Volume in Number of CAD Licenses/Subscriptions |
| Segments Covered | Design Type, Operating System, Region |
| Regions Covered | North America, Latin America, Europe, Asia Pacific, Middle East & Africa |
| Countries Covered | United States, Canada, Mexico, Brazil, Argentina, Germany, United Kingdom, France, Italy, Spain, Russia, China, Japan, South Korea, India, Australia, UAE, Saudi Arabia, South Africa, Turkey |
| By Design Type | 3-D, 2-D |
| By Operating System | Windows, Unix, Linux, Mac OS X |
| Key Companies Profiled | Dassault Systemes, PTC, Nanosoft, VariCAD, Cadonix Ltd., Caddie Software, Kubotek the USA, Autodesk Inc., Siemens PLM Software Inc., Fujifilm Corporation, Graebert GmbH, Trimble Inc., ALPI International Software, IMSI Design LLC |
| Assumptions & Acronyms Used | Includes assumptions related to licensing models, market penetration rates, subscription growth, and acronyms such as CAD (Computer-Aided Design), PLM (Product Lifecycle Management) |
| Additional Attributes | What would a manufacturer or software developer in the CAD Market want to know? Include dollar sales, market share, product adoption trends, and regional growth drivers in 200-250 characters. Answer: Dollar sales by OS and design type, market share of cloud vs on-premise CAD, adoption rates by industry, regional demand shifts, and growth in subscription/licensing models. |
As of 2025, the computer-aided design (CAD) market is slated to reach a valuation of USD 12.2 billion.
From 2025 to 2035, sales of computer-aided design (CAD) are expected to thrive at a 6.4% CAGR.
By 2035, Future Market Insights expects the computer-aided design (CAD) market to reach USD 22.7 billion.
Table 1: Global Market Value (US$ Million) Forecast by Region, 2018 to 2033
Table 2: Global Market Value (US$ Million) Forecast by Design Type, 2018 to 2033
Table 3: Global Market Value (US$ Million) Forecast by Operating System, 2018 to 2033
Table 4: North America Market Value (US$ Million) Forecast by Country, 2018 to 2033
Table 5: North America Market Value (US$ Million) Forecast by Design Type, 2018 to 2033
Table 6: North America Market Value (US$ Million) Forecast by Operating System, 2018 to 2033
Table 7: Latin America Market Value (US$ Million) Forecast by Country, 2018 to 2033
Table 8: Latin America Market Value (US$ Million) Forecast by Design Type, 2018 to 2033
Table 9: Latin America Market Value (US$ Million) Forecast by Operating System, 2018 to 2033
Table 10: Western Europe Market Value (US$ Million) Forecast by Country, 2018 to 2033
Table 11: Western Europe Market Value (US$ Million) Forecast by Design Type, 2018 to 2033
Table 12: Western Europe Market Value (US$ Million) Forecast by Operating System, 2018 to 2033
Table 13: Eastern Europe Market Value (US$ Million) Forecast by Country, 2018 to 2033
Table 14: Eastern Europe Market Value (US$ Million) Forecast by Design Type, 2018 to 2033
Table 15: Eastern Europe Market Value (US$ Million) Forecast by Operating System, 2018 to 2033
Table 16: South Asia and Pacific Market Value (US$ Million) Forecast by Country, 2018 to 2033
Table 17: South Asia and Pacific Market Value (US$ Million) Forecast by Design Type, 2018 to 2033
Table 18: South Asia and Pacific Market Value (US$ Million) Forecast by Operating System, 2018 to 2033
Table 19: East Asia Market Value (US$ Million) Forecast by Country, 2018 to 2033
Table 20: East Asia Market Value (US$ Million) Forecast by Design Type, 2018 to 2033
Table 21: East Asia Market Value (US$ Million) Forecast by Operating System, 2018 to 2033
Table 22: Middle East and Africa Market Value (US$ Million) Forecast by Country, 2018 to 2033
Table 23: Middle East and Africa Market Value (US$ Million) Forecast by Design Type, 2018 to 2033
Table 24: Middle East and Africa Market Value (US$ Million) Forecast by Operating System, 2018 to 2033
Figure 1: Global Market Value (US$ Million) by Design Type, 2023 to 2033
Figure 2: Global Market Value (US$ Million) by Operating System, 2023 to 2033
Figure 3: Global Market Value (US$ Million) by Region, 2023 to 2033
Figure 4: Global Market Value (US$ Million) Analysis by Region, 2018 to 2033
Figure 5: Global Market Value Share (%) and BPS Analysis by Region, 2023 to 2033
Figure 6: Global Market Y-o-Y Growth (%) Projections by Region, 2023 to 2033
Figure 7: Global Market Value (US$ Million) Analysis by Design Type, 2018 to 2033
Figure 8: Global Market Value Share (%) and BPS Analysis by Design Type, 2023 to 2033
Figure 9: Global Market Y-o-Y Growth (%) Projections by Design Type, 2023 to 2033
Figure 10: Global Market Value (US$ Million) Analysis by Operating System, 2018 to 2033
Figure 11: Global Market Value Share (%) and BPS Analysis by Operating System, 2023 to 2033
Figure 12: Global Market Y-o-Y Growth (%) Projections by Operating System, 2023 to 2033
Figure 13: Global Market Attractiveness by Design Type, 2023 to 2033
Figure 14: Global Market Attractiveness by Operating System, 2023 to 2033
Figure 15: Global Market Attractiveness by Region, 2023 to 2033
Figure 16: North America Market Value (US$ Million) by Design Type, 2023 to 2033
Figure 17: North America Market Value (US$ Million) by Operating System, 2023 to 2033
Figure 18: North America Market Value (US$ Million) by Country, 2023 to 2033
Figure 19: North America Market Value (US$ Million) Analysis by Country, 2018 to 2033
Figure 20: North America Market Value Share (%) and BPS Analysis by Country, 2023 to 2033
Figure 21: North America Market Y-o-Y Growth (%) Projections by Country, 2023 to 2033
Figure 22: North America Market Value (US$ Million) Analysis by Design Type, 2018 to 2033
Figure 23: North America Market Value Share (%) and BPS Analysis by Design Type, 2023 to 2033
Figure 24: North America Market Y-o-Y Growth (%) Projections by Design Type, 2023 to 2033
Figure 25: North America Market Value (US$ Million) Analysis by Operating System, 2018 to 2033
Figure 26: North America Market Value Share (%) and BPS Analysis by Operating System, 2023 to 2033
Figure 27: North America Market Y-o-Y Growth (%) Projections by Operating System, 2023 to 2033
Figure 28: North America Market Attractiveness by Design Type, 2023 to 2033
Figure 29: North America Market Attractiveness by Operating System, 2023 to 2033
Figure 30: North America Market Attractiveness by Country, 2023 to 2033
Figure 31: Latin America Market Value (US$ Million) by Design Type, 2023 to 2033
Figure 32: Latin America Market Value (US$ Million) by Operating System, 2023 to 2033
Figure 33: Latin America Market Value (US$ Million) by Country, 2023 to 2033
Figure 34: Latin America Market Value (US$ Million) Analysis by Country, 2018 to 2033
Figure 35: Latin America Market Value Share (%) and BPS Analysis by Country, 2023 to 2033
Figure 36: Latin America Market Y-o-Y Growth (%) Projections by Country, 2023 to 2033
Figure 37: Latin America Market Value (US$ Million) Analysis by Design Type, 2018 to 2033
Figure 38: Latin America Market Value Share (%) and BPS Analysis by Design Type, 2023 to 2033
Figure 39: Latin America Market Y-o-Y Growth (%) Projections by Design Type, 2023 to 2033
Figure 40: Latin America Market Value (US$ Million) Analysis by Operating System, 2018 to 2033
Figure 41: Latin America Market Value Share (%) and BPS Analysis by Operating System, 2023 to 2033
Figure 42: Latin America Market Y-o-Y Growth (%) Projections by Operating System, 2023 to 2033
Figure 43: Latin America Market Attractiveness by Design Type, 2023 to 2033
Figure 44: Latin America Market Attractiveness by Operating System, 2023 to 2033
Figure 45: Latin America Market Attractiveness by Country, 2023 to 2033
Figure 46: Western Europe Market Value (US$ Million) by Design Type, 2023 to 2033
Figure 47: Western Europe Market Value (US$ Million) by Operating System, 2023 to 2033
Figure 48: Western Europe Market Value (US$ Million) by Country, 2023 to 2033
Figure 49: Western Europe Market Value (US$ Million) Analysis by Country, 2018 to 2033
Figure 50: Western Europe Market Value Share (%) and BPS Analysis by Country, 2023 to 2033
Figure 51: Western Europe Market Y-o-Y Growth (%) Projections by Country, 2023 to 2033
Figure 52: Western Europe Market Value (US$ Million) Analysis by Design Type, 2018 to 2033
Figure 53: Western Europe Market Value Share (%) and BPS Analysis by Design Type, 2023 to 2033
Figure 54: Western Europe Market Y-o-Y Growth (%) Projections by Design Type, 2023 to 2033
Figure 55: Western Europe Market Value (US$ Million) Analysis by Operating System, 2018 to 2033
Figure 56: Western Europe Market Value Share (%) and BPS Analysis by Operating System, 2023 to 2033
Figure 57: Western Europe Market Y-o-Y Growth (%) Projections by Operating System, 2023 to 2033
Figure 58: Western Europe Market Attractiveness by Design Type, 2023 to 2033
Figure 59: Western Europe Market Attractiveness by Operating System, 2023 to 2033
Figure 60: Western Europe Market Attractiveness by Country, 2023 to 2033
Figure 61: Eastern Europe Market Value (US$ Million) by Design Type, 2023 to 2033
Figure 62: Eastern Europe Market Value (US$ Million) by Operating System, 2023 to 2033
Figure 63: Eastern Europe Market Value (US$ Million) by Country, 2023 to 2033
Figure 64: Eastern Europe Market Value (US$ Million) Analysis by Country, 2018 to 2033
Figure 65: Eastern Europe Market Value Share (%) and BPS Analysis by Country, 2023 to 2033
Figure 66: Eastern Europe Market Y-o-Y Growth (%) Projections by Country, 2023 to 2033
Figure 67: Eastern Europe Market Value (US$ Million) Analysis by Design Type, 2018 to 2033
Figure 68: Eastern Europe Market Value Share (%) and BPS Analysis by Design Type, 2023 to 2033
Figure 69: Eastern Europe Market Y-o-Y Growth (%) Projections by Design Type, 2023 to 2033
Figure 70: Eastern Europe Market Value (US$ Million) Analysis by Operating System, 2018 to 2033
Figure 71: Eastern Europe Market Value Share (%) and BPS Analysis by Operating System, 2023 to 2033
Figure 72: Eastern Europe Market Y-o-Y Growth (%) Projections by Operating System, 2023 to 2033
Figure 73: Eastern Europe Market Attractiveness by Design Type, 2023 to 2033
Figure 74: Eastern Europe Market Attractiveness by Operating System, 2023 to 2033
Figure 75: Eastern Europe Market Attractiveness by Country, 2023 to 2033
Figure 76: South Asia and Pacific Market Value (US$ Million) by Design Type, 2023 to 2033
Figure 77: South Asia and Pacific Market Value (US$ Million) by Operating System, 2023 to 2033
Figure 78: South Asia and Pacific Market Value (US$ Million) by Country, 2023 to 2033
Figure 79: South Asia and Pacific Market Value (US$ Million) Analysis by Country, 2018 to 2033
Figure 80: South Asia and Pacific Market Value Share (%) and BPS Analysis by Country, 2023 to 2033
Figure 81: South Asia and Pacific Market Y-o-Y Growth (%) Projections by Country, 2023 to 2033
Figure 82: South Asia and Pacific Market Value (US$ Million) Analysis by Design Type, 2018 to 2033
Figure 83: South Asia and Pacific Market Value Share (%) and BPS Analysis by Design Type, 2023 to 2033
Figure 84: South Asia and Pacific Market Y-o-Y Growth (%) Projections by Design Type, 2023 to 2033
Figure 85: South Asia and Pacific Market Value (US$ Million) Analysis by Operating System, 2018 to 2033
Figure 86: South Asia and Pacific Market Value Share (%) and BPS Analysis by Operating System, 2023 to 2033
Figure 87: South Asia and Pacific Market Y-o-Y Growth (%) Projections by Operating System, 2023 to 2033
Figure 88: South Asia and Pacific Market Attractiveness by Design Type, 2023 to 2033
Figure 89: South Asia and Pacific Market Attractiveness by Operating System, 2023 to 2033
Figure 90: South Asia and Pacific Market Attractiveness by Country, 2023 to 2033
Figure 91: East Asia Market Value (US$ Million) by Design Type, 2023 to 2033
Figure 92: East Asia Market Value (US$ Million) by Operating System, 2023 to 2033
Figure 93: East Asia Market Value (US$ Million) by Country, 2023 to 2033
Figure 94: East Asia Market Value (US$ Million) Analysis by Country, 2018 to 2033
Figure 95: East Asia Market Value Share (%) and BPS Analysis by Country, 2023 to 2033
Figure 96: East Asia Market Y-o-Y Growth (%) Projections by Country, 2023 to 2033
Figure 97: East Asia Market Value (US$ Million) Analysis by Design Type, 2018 to 2033
Figure 98: East Asia Market Value Share (%) and BPS Analysis by Design Type, 2023 to 2033
Figure 99: East Asia Market Y-o-Y Growth (%) Projections by Design Type, 2023 to 2033
Figure 100: East Asia Market Value (US$ Million) Analysis by Operating System, 2018 to 2033
Figure 101: East Asia Market Value Share (%) and BPS Analysis by Operating System, 2023 to 2033
Figure 102: East Asia Market Y-o-Y Growth (%) Projections by Operating System, 2023 to 2033
Figure 103: East Asia Market Attractiveness by Design Type, 2023 to 2033
Figure 104: East Asia Market Attractiveness by Operating System, 2023 to 2033
Figure 105: East Asia Market Attractiveness by Country, 2023 to 2033
Figure 106: Middle East and Africa Market Value (US$ Million) by Design Type, 2023 to 2033
Figure 107: Middle East and Africa Market Value (US$ Million) by Operating System, 2023 to 2033
Figure 108: Middle East and Africa Market Value (US$ Million) by Country, 2023 to 2033
Figure 109: Middle East and Africa Market Value (US$ Million) Analysis by Country, 2018 to 2033
Figure 110: Middle East and Africa Market Value Share (%) and BPS Analysis by Country, 2023 to 2033
Figure 111: Middle East and Africa Market Y-o-Y Growth (%) Projections by Country, 2023 to 2033
Figure 112: Middle East and Africa Market Value (US$ Million) Analysis by Design Type, 2018 to 2033
Figure 113: Middle East and Africa Market Value Share (%) and BPS Analysis by Design Type, 2023 to 2033
Figure 114: Middle East and Africa Market Y-o-Y Growth (%) Projections by Design Type, 2023 to 2033
Figure 115: Middle East and Africa Market Value (US$ Million) Analysis by Operating System, 2018 to 2033
Figure 116: Middle East and Africa Market Value Share (%) and BPS Analysis by Operating System, 2023 to 2033
Figure 117: Middle East and Africa Market Y-o-Y Growth (%) Projections by Operating System, 2023 to 2033
Figure 118: Middle East and Africa Market Attractiveness by Design Type, 2023 to 2033
Figure 119: Middle East and Africa Market Attractiveness by Operating System, 2023 to 2033
Figure 120: Middle East and Africa Market Attractiveness by Country, 2023 to 2033


Our Research Products

The "Full Research Suite" delivers actionable market intel, deep dives on markets or technologies, so clients act faster, cut risk, and unlock growth.

The Leaderboard benchmarks and ranks top vendors, classifying them as Established Leaders, Leading Challengers, or Disruptors & Challengers.

Locates where complements amplify value and substitutes erode it, forecasting net impact by horizon

We deliver granular, decision-grade intel: market sizing, 5-year forecasts, pricing, adoption, usage, revenue, and operational KPIs—plus competitor tracking, regulation, and value chains—across 60 countries broadly.

Spot the shifts before they hit your P&L. We track inflection points, adoption curves, pricing moves, and ecosystem plays to show where demand is heading, why it is changing, and what to do next across high-growth markets and disruptive tech

Real-time reads of user behavior. We track shifting priorities, perceptions of today’s and next-gen services, and provider experience, then pace how fast tech moves from trial to adoption, blending buyer, consumer, and channel inputs with social signals (#WhySwitch, #UX).

Partner with our analyst team to build a custom report designed around your business priorities. From analysing market trends to assessing competitors or crafting bespoke datasets, we tailor insights to your needs.
Supplier Intelligence
Discovery & Profiling
Capacity & Footprint
Performance & Risk
Compliance & Governance
Commercial Readiness
Who Supplies Whom
Scorecards & Shortlists
Playbooks & Docs
Category Intelligence
Definition & Scope
Demand & Use Cases
Cost Drivers
Market Structure
Supply Chain Map
Trade & Policy
Operating Norms
Deliverables
Buyer Intelligence
Account Basics
Spend & Scope
Procurement Model
Vendor Requirements
Terms & Policies
Entry Strategy
Pain Points & Triggers
Outputs
Pricing Analysis
Benchmarks
Trends
Should-Cost
Indexation
Landed Cost
Commercial Terms
Deliverables
Brand Analysis
Positioning & Value Prop
Share & Presence
Customer Evidence
Go-to-Market
Digital & Reputation
Compliance & Trust
KPIs & Gaps
Outputs
Full Research Suite comprises of:
Market outlook & trends analysis
Interviews & case studies
Strategic recommendations
Vendor profiles & capabilities analysis
5-year forecasts
8 regions and 60+ country-level data splits
Market segment data splits
12 months of continuous data updates
DELIVERED AS:
PDF EXCEL ONLINE
Designer Sneaker Market Forecast Outlook 2025 to 2035
Design Collaboration Software Market Size and Share Forecast Outlook 2025 to 2035
SCADA Alarm Management Market Size and Share Forecast Outlook 2025 to 2035
Academic Scheduling Software Market Size and Share Forecast Outlook 2025 to 2035
Facade Materials Market Size and Share Forecast Outlook 2025 to 2035
Facade Market Size and Share Forecast Outlook 2025 to 2035
Macadamia Market Analysis - Size, Share, and Forecast 2025 to 2035
Macadamia Milk Market Analysis by Flavor, Product Type, and Sales Channel Through 2025 to 2035
Macadamia Butter Market Analysis by Nature, Form, Application, Distribution Channel, and Region through 2025 to 2035
Circadian Rhythm Sleep Disorders Market Size and Share Forecast Outlook 2025 to 2035
Avocado Oil Market Size and Share Forecast Outlook 2025 to 2035
PCB Design Software Industry Analysis in Europe Size and Share Forecast Outlook 2025 to 2035
PCB Design Software Market Analysis by Component, Deployment, Application, and Region Through 2035
Remicade Biosimilar Market Analysis - Demand & Forecast 2025 to 2035
Barricade Tape Market Size and Share Forecast Outlook 2025 to 2035
Drug Designing Tools Market Growth – Trends & Forecast 2025 to 2035
Market Share Distribution Among Barricade Tape Manufacturers
Product Design Verification And Validation Solution Market Size and Share Forecast Outlook 2025 to 2035
Japan Avocado Oil Market Analysis - Size, Share & Trends 2025 to 2035
Korea Avocado Oil Market Analysis - Size, Share & Trends 2025 to 2035

Thank you!
You will receive an email from our Business Development Manager. Please be sure to check your SPAM/JUNK folder too.
Chat With
MaRIA