This site uses cookies, including third-party cookies, that help us to provide and improve our services.

Privacy Policy
- Global Locations -
Headquarters
Future Market Insights, Inc.
Christiana Corporate, 200 Continental Drive, Suite 401, Newark, Delaware - 19713, United States
T: +1-845-579-5705
MEA
Market Access DMCC

1602-6 Jumeirah Bay X2 Tower, Plot No: JLT-PH2-X2A,

Jumeirah Lakes Towers, Dubai,

United Arab Emirates

Americas
Future Market Insights
616 Corporate Way, Suite 2-9018,
Valley Cottage, NY 10989,
United States
T: +1-347-918-3531
Europe
Future Market Insights
3rd Floor, 207 Regent Street,
London W1B 3HH
United Kingdom
T: + 44 (0) 20 8123 9659
D: +44 (0) 20 3287 4268
APAC
Future Market Insights
Office No. 401-A, 4th Floor,
VANTAGE 9, S.No. 36/1/1,
Baner, Pune 411045 India

Designer Sneaker Market

Market Insights on Designer Sneaker covering sales outlook, demand forecast & up-to-date key trends

Designer Sneaker Market by Product Type, Material Type, Consumer Orientation, Sales Channel & Region | Forecast 2022 to 2032

Designer Sneaker Market Outlook (2022 to 2032)

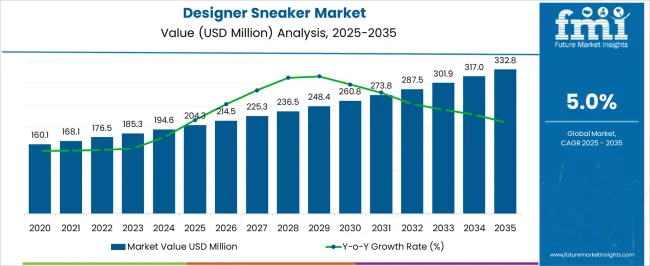
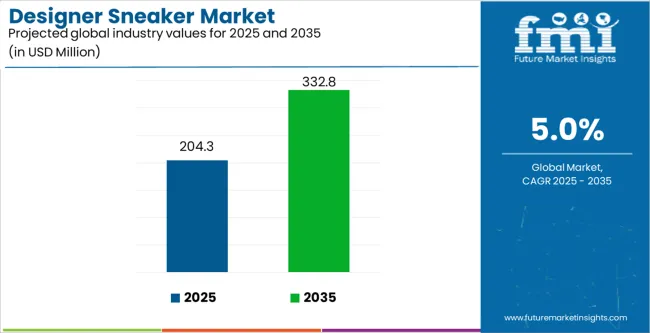
As per newly released data by Future Market Insights (FMI), the Designer Sneaker Market is estimated at USD 182.9 Million in 2022 and is projected to reach USD 289.5 Million by 2032, at a CAGR of ~4.9% from 2022 to 2032.

Attribute

Details

Estimated Designer Sneaker Market Size 2022

US$ 182.9 Million

Projected Designer Sneaker Market (2032) Market Size

US$ 289.5 Million

Value CAGR (2022 to 2032)

4.9%

Customize this Report

Let us know your requirement to get
100% FREE customization

Key Points Covered in Designer Sneaker Market Survey

  • Market estimates and forecast 2016-2032
  • Key drivers and restraints impacting market growth
  • Segment-wise, Country-wise, and Region-wise Analysis
  • Competition Mapping and Benchmarking
  • Brand share and Market Share Analysis
  • Key Product Innovations and Regulatory Climate
  • COVID-19 Impact on Designer Sneaker Market and How to Navigate
  • Recommendation on Key Winning Strategies

2017 to 2021 Designer Sneaker Market Outlook Compared to 2022 to 2032 Forecast

Designer Sneaker refers to the types of sneakers that are typically associated with wealthy or affluent individuals. Consumers to sustain their sense of self-worth and status or for the quality and artistry of the product, and demand for them rises proportionately less than the income buy these products. The following qualities are typically present in luxury footwear items: cost, excellence, rarity, beauty, extraordinariness, and symbolism.

By highlighting a product's better quality and uniqueness, manufacturers can increase consumer attractiveness by "premiumizing" the brand or product. It is inspired by a preference for high-quality goods and the need to establish success. Because of the increase in per capita income, consumers are more likely to select high-quality goods. Due to their high cost and value-added features and specifications, designer sneakers are considered premium goods. Customers who can afford expensive things are attracted to products with such attributes. As a result, it is anticipated that more end consumers will adopt premium footwear. This in turn accelerates the market's expansion.

These firms have implemented profitable strategies to appeal to various consumer groups, including HENRYs (High-Earners-Not-Rich-Yet), who are tech-perceptive and huge consumers. To attract this group, manufacturers offer inclusive, individual, and self-expressive products, which will spur market expansion. For instance, Modello Domani, a high-end shoe brand that specializes in handcrafted premium footwear, offers full footwear customization with monograms and styles for men, women, and kids that fit the customer's taste and size.

Sneha Verghese
Sneha Verghese
Principal Consultant
LinkedIn
Talk to Analyst

Find your sweet spots for generating winning opportunities in this market.

Talk to Analyst

Millennials prefer to mix and match, combining expensive goods with more expensive designer brands.

This significant cultural shift in the luxury market demonstrates the desire of these aspiring customers to project a more relaxed image where exclusivity meets casual attire. For instance, Nike offers a digital visualization customizing service called the Nike Makers Experience in New York, which is similar to the tactic used by other top luxury companies. Innovative entrepreneurs have also established themselves in this market, such as Buscemi, which is well known for its 18K gold padlocks and provides high-quality artistry as part of its customizing service.

The fusion of high-end fashion with sports is a significant trend in Designer Sneaker Market

The foundations can be discovered in an association between Adidas and Yohji Yamamoto, a Japanese constructivism designer. With Y-3, a co-creation initiative that included performance apparel and unique trainers, he was the first fashion designer to foresee the potential of shoes on the runway. The following designer, Phoebe Philo, started the white Adidas Stan Smith style. In addition to attending one of her fashion exhibitions in 2010, she wore them in daily life. At that point, Stan Smith gained notoriety.

MarketNage
Become a MarketNgage Insider

A unified Market Research Subscription Platform, built for today's disparate research needs.

Rise in fashion trend demands designer Sneaker Market

As fashion trends increase, there is a need for new products, which presents market potential. Customers anxiously anticipate new releases or recent additions to the market. In the upcoming years, it is anticipated that the need for innovative and stylish products would rise due to the fast-changing nature of fashion trends. Customers are increasingly looking for stylish designer shoes with aspects of sports design in keeping with the athleisure trend. Sneakers' introduction to sports, particularly basketball, is one of the key reasons they are growing in popularity among consumers. Before Chuck Taylor, there was never a specific shoe connected with basketball. Thus, prospects for the designer sneaker market in the coming years are created by the development of fashion trends.

Adidas rise the cushioning Technology

Over the years, designers have frequently drawn inspiration from cushioning technology. MicroG, Lunarlon foam, and a number of other more recent inventions are but a few. However, I believe that among the most recent cushioning technologies, Adidas' Boost technology gives designers a fresh and cutting-edge tool that may significantly alter the appearance and feel of a shoe in addition to its cushioning properties. It will be interesting to see how designers develop this technology and apply it to various aspects of footwear to produce improved cushioning and a completely new appearance that attracts customers who prefer comfortable sneakers.

Country - wise Insights

What technological innovation is popular in Germany?

“German-based designer produce plant-based leather material for use in Sneaker.”

A major feature that is becoming ever more popular in the designer sneaker market is technological innovation. To achieve the sustainability targets established by international organizations and governments around the world, businesses in the designer sneaker market are concentrating on creating new, future-proof goods using recycled plastics. For instance, in 2020, Adidas, a German-based designer clothing, designer sneaker, accessory, and sports equipment designer and producer, produced plant-based leather material made from mycelium, a component of a fungus, for use in shoes. Additionally in 2020, the business will have created 15 million pairs of shoes from recovered plastic garbage that was gathered from beaches and coastal areas.

Which Chinese company acquire Italian Designer shoemaker Sergio Rossi?

“Fosun Fashion Group acquire Italian Designer Shoemaker Sergio Rossi.”

In addition to Wolford, Caruso, St. John, and French fashion label Lanvin, Sergio Rossi adds a famous footwear brand to FFG's luxury portfolio. One of the world's leading consumer groups focused on innovation is Fosun International, which also owns the luxury fashion company Fosun Fashion Group (FFG). FFG is one of the pioneers in China to establish a global luxury fashion business and oversees a portfolio of legacy brands that span the full range of fashion luxury sectors. Through Sergio Rossi's completely owned, state-of-the-art plant, this acquisition not only completes a more complete strategic brand ecosystem for FFG but also potentially fosters brand synergies.

Which France Designer collaborate with Reebok in 2022?

“Maison Margiela collaborate with reebok on Paris Fashion Couture Week.”

The high-fashion brand Reebok and Maison Margiela collaborated for the first time in 2020, and the deal was revealed on the Paris Couture Week runway. Since then, the duo has produced a number of drops, offering anything from sneakers with a cyber-industrial theme to styles that are more traditional. The fashion house's Tabi toe, a split hoof-like design that made its debut in the brand's 1989 spring collection, is one of the most distinctive items from the designer sneaker collaboration. It is a controversial appearance, but it is undeniably special.

For instance: A few celebrities who have flaunted the co-created shoe styles for the series include Kim Kardashian West and Hunter Schafer, who plays the series "Euphoria." The most effective way to persuade individuals to purchase designer shoes and to draw in customers is through social media or runways.

Category-wise Insights

Which type of Sales Channel will contribute a major share of the Designer Sneaker Market?

“Online Sales are the most popular sales channel in Designer Sneaker Market”

As consumers become more technologically adept, online commerce channels are getting more and more popular. As a result, both single- and multi-brand retailers of women's non-athletic footwear around the world are experiencing new growth opportunities. Consumers' purchasing habits are changing, new user experiences are shaping, business plans are being disrupted, and new growth prospects are being created. The expansion of e-Commerce has had a tremendous impact on the designer sneaker market, further pressuring manufacturers to adopt an Omni-channel approach. With a 10% internet penetration rate and high consumer awareness on websites like Amazon, Walmart, Flipkart, and other Designer online platforms, etc., online sales are on their way to becoming the most lucrative sales channel.

What Material type do manufacturers use for the Designer Sneaker Market?

“Synthetic materials are commonly used for the Designer Sneaker Market.”

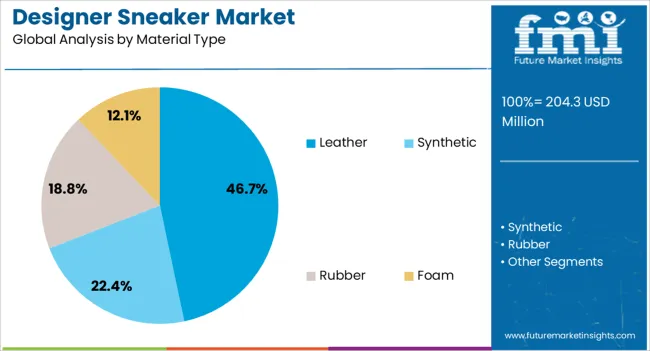
Since products approach genuine leather in appearance and feel while avoiding the moral dilemmas associated with animal rights, synthetic materials are becoming more and more popular. These materials are more cost-effective, durable, and ecologically friendly than leather, which gives them a superior value proposition for manufacturers. The demand for synthetic materials is rising as companies work to reduce their carbon footprint.

Which segment will have the most consumers on the basis of consumer orientation?

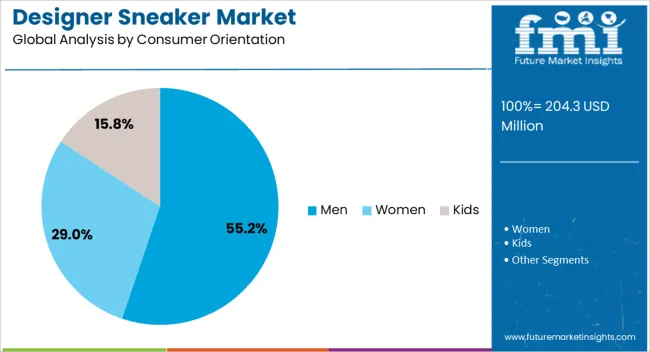
“Commonly, Men prefer Designer Sneakers Market over that women.”

Men's designer sneakers are widely available. Men choose to wear sneakers more regularly since they engage in a variety of physical activities on a daily basis, but there are Designer Sneaker Markets for women and kids as well. Sneaker help with comfort and safety to some extent.

Competitive Landscape

There are a number of designers launching and collaborating new partnerships with different brands and launching their designs on the online and offline platforms, new technological advancements in order to deliver high-quality sneakers in the sneaker market and social media, celebrities influencing the designer's sneaker market that influence the customers.

For Instance:

  • The high-fashion brand Reebok and Maison Margiela cooperated for the first time in 2020, and the partnership was announced on the Paris Couture Week catwalk.
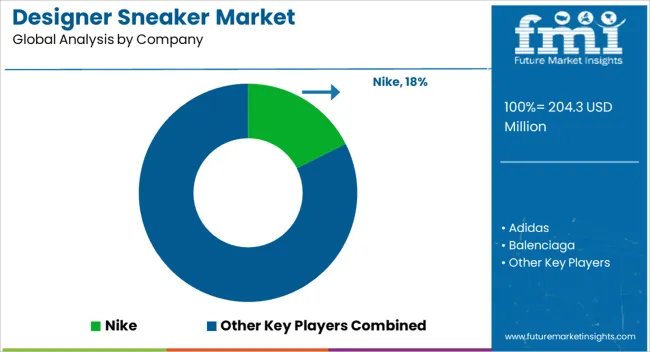
  • Nike teamed up with the Japanese brand Sacai in the middle of 2021 to combine the Nike Waffle Racer and the Nike LDV, two legendary shoes.

Scope of Report

Attribute

Details

Forecast Period

2022 to 2032

Historical Data Available for

2017 to 2021

Market Analysis

USD Million for Value

Key Regions Covered

North America, Latin America, Europe, East Asia,

South Asia, Oceania & Middle East & Africa (MEA)

Key Countries Covered

United States, Canada, Brazil, Mexico, Germany, the UK, France, Spain, Italy, Russia, South Africa, Northern Africa GCC Countries, China, Japan, South Korea, India, Thailand, Malaysia, Indonesia, Australia & New Zealand.

Key Segments Covered

Product Type, Material Type, Consumer Orientation, Sales Channel, and Region.

Key Companies Profiled

  • Adidas
  • Balenciaga
  • Gucci
  • Nike
  • Golden Goose
  • New Balance
  • Prada
  • Valentino
  • Saint Laurent
  • Tom Ford
  • Lanvin
  • Balmain
  • Versace
  • Veja
  • Billionaire
  • Emporio Armani
  • Fred Perry
  • Hackett London
  • John Richardo
  • Michael Kors
  • Philipp Plein
  • Polo Ralph Lauren
  • Ralph Lauren
  • Ted Baker
  • Others

Report Coverage

Market Forecast, Company Share Analysis, Competition Intelligence, DROT Analysis, Market Dynamics and Challenges, and Strategic Growth Initiatives

Customization & Pricing

Available upon Request

Designer Sneaker Market by Category

Product Type segments as Designer Sneaker Market:

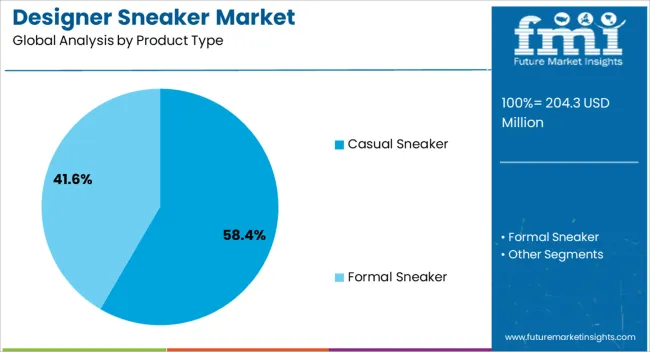
  • Casual Sneaker
  • Formal Sneaker

Material Type segments as Designer Sneaker Market:

  • Leather
  • Synthetic
  • Rubber
  • Foam

Consumer Orientation segments as Designer Sneaker Market:

  • Men
  • Women
  • Kids

Sales Channel segments as Designer sneaker Market:

  • Online Retailers
  • Offline
  • Other Sales Channel

  Region, segments as Designer Sneaker Market:

  • North America
  • Latin America
  • Europe
  • East Asia
  • South Asia
  • Oceania
  • Middle East & Africa (MEA)

Frequently Asked Questions

The Designer Sneaker Market reached a valuation of ~US$ 182.9 Million in 2022.

The Designer Sneaker Market grew at 4.9% CAGR between 2022 and 2032.

The rise in Fashion trends and buying more luxury brands influence consumers. Celebrities like Bella Hadid and Kim Kardashian are launching designer sneakers on runway couture. New Technological advancement in the sneaker market is a key trend in Designer Sneaker Market.

Leading players operating in the sneaker market are Adidas, Balenciaga, Gucci, Nike, Golden Goose, New Balance, Prada, Valentino, Saint Laurent, Tom Ford, Lanvin, Balmain, Versace, Veja, Billionaire, Emporio Armani, Fred Perry, Hackett London, John Richardo, Michael Kors, Philipp Plein, Polo Ralph Lauren, Ralph Lauren, Ted Baker, and others.

The North America Designer Sneaker Market is projected to grow at an xx% CAGR over the forecast period.

Table of Content

1. Executive Summary | Designer Sneaker Market 

    1.1. Global Market Outlook

    1.2. Summary of Key Findings

    1.3. Summary of Key statistics

    1.4. FMI Analysis and Recommendations

2. Market Overview

    2.1. Market Taxonomy

    2.2. Market Definition

3. Key Market Trends

    3.1. Key Trends Impacting the Market

        3.1.1. Millennials are Driving Force

        3.1.2. Rapid Emergence of The Start-ups In the Market

        3.1.3. Increasing Awareness about sustainability

        3.1.4. Globalization Impacting Lifestyles

        3.1.5. Consumers Selecting for At-home Services, Using e-Commerce

        3.1.6. Others

    3.2. Product Innovation Trends

        3.2.1. Manufacturers Increasingly Spending on R&D and Stepping Up Eco-friendly material

        3.2.2. Growing Consumer Interest in Multifunctional Products

        3.2.3. Prominent Players are Now Diversifying Into other Profitable Segments

        3.2.4. Evolution in Product Design

    3.3. Future Prospects of the Leather Sneakers Industry

        3.3.1. Factors Fuelling Growth

        3.3.2. Influx of Brands

        3.3.3. Innovative Distribution & Marketing Strategies

4. Market Demand Analysis 2017 to 2021 and Forecast, 2022 to 2032

    4.1. Historical Market Volume (Units) Analysis, 2017 to 2021

    4.2. Current and Future Market Volume (Units) Projections, 2022 to 2032

    4.3. Y-o-Y Growth Trend Analysis

5. Pricing Analysis

    5.1. Regional Pricing Analysis By Product

    5.2. Pricing Break-up

        5.2.1. Manufacturer-Level Pricing

        5.2.2. Distributor Level Pricing

    5.3. Average Pricing Analysis Benchmark

6. Market Demand (in Value or in US$ Million) Analysis 2017 to 2021 and Forecast, 2022 to 2032

    6.1. Historical Market Value (US$ Million) Analysis, 2017 to 2021

    6.2. Current and Future Market Value (US$ Million) Projections, 2022 to 2032

        6.2.1. Y-o-Y Growth Trend Analysis

        6.2.2. Absolute $ Opportunity Analysis

7. Market Background

    7.1. Macro-Economic Factors

        7.1.1. Global GDP Growth Outlook

        7.1.2. Global Consumer Spending Outlook

        7.1.3. Global Population and Income Level Growth Outlook

        7.1.4. Global Apparel Industry Growth

        7.1.5. GDP Growth Rate Analysis

        7.1.6. Apparel Industry Contribution to GDP Outlook

        7.1.7. Global E-Commerce Industry Outlook

        7.1.8. Global Household Spending Outlook

        7.1.9. Urbanization Growth Outlook

        7.1.10. Global Male-Female Ratio Outlook

        7.1.11. Per Capita Disposable Income

        7.1.12. The outbreak of Covid-19 Pandemic

        7.1.13. Economic Instability

        7.1.14. Impact of Online Sales

    7.2. Forecast Factors - Relevance & Impact

        7.2.1. Top Companies Historical Growth

        7.2.2. Global Leather Sneakers Industry Assessment

        7.2.3. Global Retail Sales Outlook

        7.2.4. Manufacturing Sector Gross Value Added

        7.2.5. Urbanization Growth Outlook

        7.2.6. Consumer Price Index

        7.2.7. Others

    7.3. Purchase Pattern Assessment

        7.3.1. Analysis Of Perception Towards Leather Sneakers

        7.3.2. Analysis Of Preferred Purchase Mode

        7.3.3. Analysis On The Consumption Pattern

        7.3.4. Consumer Insights

        7.3.5. Others (Pointers Will Be Developed During The Course of Study)

    7.4. Industry Value and Supply Chain Analysis

    7.5. Market Dynamics

        7.5.1. Drivers

        7.5.2. Restraints

        7.5.3. Opportunity Analysis

    7.6. PESTLE Analysis of the Designer Sneaker Market

    7.7. Investment Feasibility Matrix

    7.8. Porter’s Five Force

8. Market Analysis 2017 to 2021 and Forecast 2022 to 2032, By Product Type

    8.1. Introduction / Key Findings

    8.2. Historical Market Size (US$ Million) and Volume Analysis By Product Type, 2017 to 2021

    8.3. Current and Future Market Size (US$ Million) and Volume Analysis and Forecast By Product Type, 2022 to 2032

        8.3.1. Formal Sneaker

        8.3.2. Casual Sneaker

    8.4. Market Attractiveness Analysis By Product Type

9. Market Analysis 2017 to 2021 and Forecast 2022 to 2032, By Material Type

    9.1. Introduction / Key Findings

    9.2. Historical Market Size (US$ Million) and Volume Analysis By Material Type, 2017 to 2021

    9.3. Current and Future Market Size (US$ Million) and Volume Analysis and Forecast By Material Type, 2022 to 2032

        9.3.1. Leather

        9.3.2. Synthetic

        9.3.3. Rubber

        9.3.4. Foam

    9.4. Market Attractiveness Analysis By Material Type

10. Market Analysis 2017 to 2021 and Forecast 2022 to 2032, by Consumer Orientation

    10.1. Introduction / Key Findings

    10.2. Historical Market Size (US$ Million) and Volume Analysis By Consumer Orientation, 2017 to 2021

    10.3. Current and Future Market Size (US$ Million) and Volume Analysis and Forecast By Consumer Orientation, 2022 to 2032

        10.3.1. Men

        10.3.2. Women

        10.3.3. Kids

    10.4. Market Attractiveness Analysis By Consumer Orientation

11. Market Analysis 2017 to 2021 and Forecast 2022 to 2032, by Sales Channel

    11.1. Introduction / Key Findings

    11.2. Historical Market Size (US$ Million) and Volume Analysis By Sales Channel, 2017 to 2021

    11.3. Current and Future Market Size (US$ Million) and Volume Analysis and Forecast By Sales Channel, 2022 to 2032

        11.3.1. Online

        11.3.2. Offline

        11.3.3. Other Sales Channel

    11.4. Market Attractiveness Analysis By Sales Channel

12.  Market Analysis 2017 to 2021 and Forecast 2022 to 2032, by Region

    12.1. Introduction

    12.2. Historical Market Size (US$ Million) and Volume Analysis By Region, 2017 to 2021

    12.3. Current Market Size (US$ Million) and Volume Analysis and Forecast By Region, 2022 to 2032

        12.3.1. North America

        12.3.2. Latin America

        12.3.3. Europe

        12.3.4. East Asia

        12.3.5. South Asia

        12.3.6. Oceania

        12.3.7. Middle East & Africa (MEA)

    12.4. Market Attractiveness Analysis By Region

13. North America Market Analysis 2017 to 2021 and Forecast 2022 to 2032

    13.1. Introduction

    13.2. Pricing Analysis

    13.3. Historical Market Size (US$ Million) and Volume Trend Analysis By Market Taxonomy, 2017 to 2021

    13.4. Market Size (US$ Million) and Volume Forecast By Market Taxonomy, 2022 to 2032

        13.4.1. By Country

            13.4.1.1. The US

            13.4.1.2. Canada

        13.4.2. By Product Type

        13.4.3. By Material Type

        13.4.4. By Consumer Orientation

        13.4.5. By Sales Channel

    13.5. Market Attractiveness Analysis

        13.5.1. By Country

        13.5.2. By Product Type

        13.5.3. By Material Type

        13.5.4. By Consumer Orientation

        13.5.5. By Sales Channel

14. Latin America Market Analysis 2017 to 2021 and Forecast 2022 to 2032

    14.1. Introduction

    14.2. Pricing Analysis

    14.3. Historical Market Size (US$ Million) and Volume Trend Analysis By Market Taxonomy, 2017 to 2021

    14.4. Market Size (US$ Million) and Volume Forecast By Market Taxonomy, 2022 to 2032

        14.4.1. By Country

            14.4.1.1. Brazil

            14.4.1.2. Mexico

            14.4.1.3. Rest of Latin America

        14.4.2. By Product Type

        14.4.3. By Material Type

        14.4.4. By Consumer Orientation

        14.4.5. By Sales Channel

    14.5. Market Attractiveness Analysis

        14.5.1. By Country

        14.5.2. By Product Type

        14.5.3. By Material Type

        14.5.4. By Consumer Orientation

        14.5.5. By Sales Channel

15. Europe  Market Analysis 2017 to 2021 and Forecast 2022 to 2032

    15.1. Introduction

    15.2. Pricing Analysis

    15.3. Historical Market Size (US$ Million) and Volume Trend Analysis By Market Taxonomy, 2017 to 2021

    15.4. Market Size (US$ Million) and Volume Forecast By Market Taxonomy, 2022 to 2032

        15.4.1. By Country

            15.4.1.1. UK

            15.4.1.2. Germany

            15.4.1.3. Italy

            15.4.1.4. Spain

            15.4.1.5. France

            15.4.1.6. Russia

            15.4.1.7. Rest of Europe

        15.4.2. By Product Type

        15.4.3. By Material Type

        15.4.4. By Consumer Orientation

        15.4.5. By Sales Channel

    15.5. Market Attractiveness Analysis

        15.5.1. By Country

        15.5.2. By Product Type

        15.5.3. By Material Type

        15.5.4. By Consumer Orientation

        15.5.5. By Sales Channel

16. East Asia Market Analysis 2017 to 2021 and Forecast 2022 to 2032

    16.1. Introduction

    16.2. Pricing Analysis

    16.3. Historical Market Size (US$ Million) and Volume Trend Analysis By Market Taxonomy, 2017 to 2021

    16.4. Market Size (US$ Million) and Volume Forecast By Market Taxonomy, 2022 to 2032

        16.4.1. By Country

            16.4.1.1. China

            16.4.1.2. Japan

            16.4.1.3. South Korea

        16.4.2. By Product Type

        16.4.3. By Material Type

        16.4.4. By Consumer Orientation

        16.4.5. By Sales Channel

    16.5. Market Attractiveness Analysis

        16.5.1. By Country

        16.5.2. By Product Type

        16.5.3. By Material Type

        16.5.4. By Consumer Orientation

        16.5.5. By Sales Channel

17. South Asia Market Analysis 2017 to 2021 and Forecast 2022 to 2032

    17.1. Introduction

    17.2. Pricing Analysis

    17.3. Historical Market Size (US$ Million) and Volume Trend Analysis By Market Taxonomy, 2017 to 2021

    17.4. Market Size (US$ Million) and Volume Forecast By Market Taxonomy, 2022 to 2032

        17.4.1. By Country

            17.4.1.1. India

            17.4.1.2. Thailand

            17.4.1.3. Malaysia

            17.4.1.4. Indonesia

            17.4.1.5. Rest of South Asia

        17.4.2. By Product Type

        17.4.3. By Material Type

        17.4.4. By Consumer Orientation

        17.4.5. By Sales Channel

    17.5. Market Attractiveness Analysis

        17.5.1. By Country

        17.5.2. By Product Type

        17.5.3. By Material Type

        17.5.4. By Consumer Orientation

        17.5.5. By Sales Channel

18. Oceania Market Analysis 2017 to 2021 and Forecast 2022 to 2032

    18.1. Introduction

    18.2. Pricing Analysis

    18.3. Historical Market Size (US$ Million) and Volume Trend Analysis By Market Taxonomy, 2017 to 2021

    18.4. Market Size (US$ Million) and Volume Forecast By Market Taxonomy, 2022 to 2032

        18.4.1. By Country

            18.4.1.1. Australia

            18.4.1.2. New Zealand

        18.4.2. By Product Type

        18.4.3. By Material Type

        18.4.4. By Consumer Orientation

        18.4.5. By Sales Channel

    18.5. Market Attractiveness Analysis

        18.5.1. By Country

        18.5.2. By Product Type

        18.5.3. By Material Type

        18.5.4. By Consumer Orientation

        18.5.5. By Sales Channel

19. MEA Market Analysis 2017 to 2021 and Forecast 2022 to 2032

    19.1. Introduction

    19.2. Pricing Analysis

    19.3. Historical Market Size (US$ Million) and Volume Trend Analysis By Market Taxonomy, 2017 to 2021

    19.4. Market Size (US$ Million) and Volume Forecast By Market Taxonomy, 2022 to 2032

        19.4.1. By Country

            19.4.1.1. GCC Countries

            19.4.1.2. South Africa

            19.4.1.3. Rest of MEA

        19.4.2. By Product Type

        19.4.3. By Material Type

        19.4.4. By Consumer Orientation

        19.4.5. By Sales Channel

    19.5. Market Attractiveness Analysis

        19.5.1. By Country

        19.5.2. By Product Type

        19.5.3. By Material Type

        19.5.4. By Consumer Orientation

        19.5.5. By Sales Channel

20. Key Countries Market Analysis

    20.1. Introduction

        20.1.1. Market Value Proportion Analysis, By Key Countries

        20.1.2. Global Vs. Country Growth Comparison

    20.2. U.S. Designer Sneaker Market Analysis

        20.2.1. By Product Type

        20.2.2. By Material Type

        20.2.3. By Consumer Orientation

        20.2.4. By Sales Channel

    20.3. Canada Designer Sneaker Market Analysis

        20.3.1. By Product Type

        20.3.2. By Material Type

        20.3.3. By Consumer Orientation

        20.3.4. By Sales Channel

    20.4. Mexico Designer Sneaker Market Analysis

        20.4.1. By Product Type

        20.4.2. By Material Type

        20.4.3. By Consumer Orientation

        20.4.4. By Sales Channel

    20.5. Brazil Designer Sneaker Market Analysis

        20.5.1. By Product Type

        20.5.2. By Material Type

        20.5.3. By Consumer Orientation

        20.5.4. By Sales Channel

    20.6. Germany Designer Sneaker Market Analysis

        20.6.1. By Product Type

        20.6.2. By Material Type

        20.6.3. By Consumer Orientation

        20.6.4. By Sales Channel

    20.7. Italy Designer Sneaker Market Analysis

        20.7.1. By Product Type

        20.7.2. By Material Type

        20.7.3. By Consumer Orientation

        20.7.4. By Sales Channel

    20.8. France Designer Sneaker Market Analysis

        20.8.1. By Product Type

        20.8.2. By Material Type

        20.8.3. By Consumer Orientation

        20.8.4. By Sales Channel

    20.9. U.K. Designer Sneaker Market Analysis

        20.9.1. By Product Type

        20.9.2. By Material Type

        20.9.3. By Consumer Orientation

        20.9.4. By Sales Channel

    20.10. Spain Designer Sneaker Market Analysis

        20.10.1. By Product Type

        20.10.2. By Material Type

        20.10.3. By Consumer Orientation

        20.10.4. By Sales Channel

    20.11. Russia Designer Sneaker Market Analysis

        20.11.1. By Product Type

        20.11.2. By Material Type

        20.11.3. By Consumer Orientation

        20.11.4. By Sales Channel

    20.12. China Designer Sneaker Market Analysis

        20.12.1. By Product Type

        20.12.2. By Material Type

        20.12.3. By Consumer Orientation

        20.12.4. By Sales Channel

    20.13. Japan Designer Sneaker Market Analysis

        20.13.1. By Product Type

        20.13.2. By Material Type

        20.13.3. By Consumer Orientation

        20.13.4. By Sales Channel

    20.14. S. Korea Designer Sneaker Market Analysis

        20.14.1. By Product Type

        20.14.2. By Material Type

        20.14.3. By Consumer Orientation

        20.14.4. By Sales Channel

    20.15. India Designer Sneaker Market Analysis

        20.15.1. By Product Type

        20.15.2. By Material Type

        20.15.3. By Consumer Orientation

        20.15.4. By Sales Channel

    20.16. ASEAN Designer Sneaker Market Analysis

        20.16.1. By Product Type

        20.16.2. By Material Type

        20.16.3. By Consumer Orientation

        20.16.4. By Sales Channel

    20.17. Australia and New Zealand Designer Sneaker Market Analysis

        20.17.1. By Product Type

        20.17.2. By Material Type

        20.17.3. By Consumer Orientation

        20.17.4. By Sales Channel

    20.18. Turkey Designer Sneaker Market Analysis

        20.18.1. By Product Type

        20.18.2. By Material Type

        20.18.3. By Consumer Orientation

        20.18.4. By Sales Channel

    20.19. South Africa Designer Sneaker Market Analysis

        20.19.1. By Product Type

        20.19.2. By Material Type

        20.19.3. By Consumer Orientation

        20.19.4. By Sales Channel

21. Market Structure Analysis

    21.1. Market Analysis by Tier of Companies

    21.2. Market Concentration

    21.3. Market Share Analysis of Top Players

    21.4. Market Presence Analysis

        21.4.1. By Regional footprint of Players

        21.4.2. Product foot print by Players

        21.4.3. Channel Foot Print by Players

22. Competition Analysis

    22.1. Competition Dashboard

    22.2. Pricing Analysis by Competition

    22.3. Competition Benchmarking

    22.4. Competition Deep Dive

        22.4.1. Adidas

            22.4.1.1. Overview

            22.4.1.2. Product Portfolio

            22.4.1.3. Profitability by Market Segments (Product / Channel / Region)

            22.4.1.4. Distribution Footprint

            22.4.1.5. Strategy Overview

        22.4.2. Balenciaga

            22.4.2.1. Overview

            22.4.2.2. Product Portfolio

            22.4.2.3. Profitability by Market Segments (Product / Channel / Region)

            22.4.2.4. Distribution Footprint

            22.4.2.5. Strategy Overview

        22.4.3. Gucci

            22.4.3.1. Overview

            22.4.3.2. Product Portfolio

            22.4.3.3. Profitability by Market Segments (Product / Channel / Region)

            22.4.3.4. Distribution Footprint

            22.4.3.5. Strategy Overview

        22.4.4. Nike

            22.4.4.1. Overview

            22.4.4.2. Product Portfolio

            22.4.4.3. Profitability by Market Segments (Product / Channel / Region)

            22.4.4.4. Distribution Footprint

            22.4.4.5. Strategy Overview

        22.4.5. Golden Goose

            22.4.5.1. Overview

            22.4.5.2. Product Portfolio

            22.4.5.3. Profitability by Market Segments (Product / Channel / Region)

            22.4.5.4. Distribution Footprint

            22.4.5.5. Strategy Overview

        22.4.6. New Balance

            22.4.6.1. Overview

            22.4.6.2. Product Portfolio

            22.4.6.3. Profitability by Market Segments (Product / Channel / Region)

            22.4.6.4. Distribution Footprint

            22.4.6.5. Strategy Overview

        22.4.7. Prada

            22.4.7.1. Overview

            22.4.7.2. Product Portfolio

            22.4.7.3. Profitability by Market Segments (Product / Channel / Region)

            22.4.7.4. Distribution Footprint

            22.4.7.5. Strategy Overview

        22.4.8. Valentino

            22.4.8.1. Overview

            22.4.8.2. Product Portfolio

            22.4.8.3. Profitability by Market Segments (Product / Channel / Region)

            22.4.8.4. Distribution Footprint

            22.4.8.5. Strategy Overview

        22.4.9. Saint Laurent

            22.4.9.1. Overview

            22.4.9.2. Product Portfolio

            22.4.9.3. Profitability by Market Segments (Product / Channel / Region)

            22.4.9.4. Distribution Footprint

            22.4.9.5. Strategy Overview

        22.4.10. Tom Ford

            22.4.10.1. Overview

            22.4.10.2. Product Portfolio

            22.4.10.3. Profitability by Market Segments (Product / Channel / Region)

            22.4.10.4. Distribution Footprint

            22.4.10.5. Strategy Overview

        22.4.11. Lanvin

            22.4.11.1. Overview

            22.4.11.2. Product Portfolio

            22.4.11.3. Profitability by Market Segments (Product / Channel / Region)

            22.4.11.4. Distribution Footprint

            22.4.11.5. Strategy Overview

        22.4.12. Balmain

            22.4.12.1. Overview

            22.4.12.2. Product Portfolio

            22.4.12.3. Profitability by Market Segments (Product / Channel / Region)

            22.4.12.4. Distribution Footprint

            22.4.12.5. Strategy Overview

        22.4.13. Versace

            22.4.13.1. Overview

            22.4.13.2. Product Portfolio

            22.4.13.3. Profitability by Market Segments (Product / Channel / Region)

            22.4.13.4. Distribution Footprint

            22.4.13.5. Strategy Overview

        22.4.14. Veja

            22.4.14.1. Overview

            22.4.14.2. Product Portfolio

            22.4.14.3. Profitability by Market Segments (Product / Channel / Region)

            22.4.14.4. Distribution Footprint

            22.4.14.5. Strategy Overview

        22.4.15. Billionaire

            22.4.15.1. Overview

            22.4.15.2. Product Portfolio

            22.4.15.3. Profitability by Market Segments (Product / Channel / Region)

            22.4.15.4. Distribution Footprint

            22.4.15.5. Strategy Overview

        22.4.16. Emporio Armani

            22.4.16.1. Overview

            22.4.16.2. Product Portfolio

            22.4.16.3. Profitability by Market Segments (Product / Channel / Region)

            22.4.16.4. Distribution Footprint

            22.4.16.5. Strategy Overview

        22.4.17. Fred Perry

            22.4.17.1. Overview

            22.4.17.2. Product Portfolio

            22.4.17.3. Profitability by Market Segments (Product / Channel / Region)

            22.4.17.4. Distribution Footprint

            22.4.17.5. Strategy Overview

        22.4.18. Hackett London

            22.4.18.1. Overview

            22.4.18.2. Product Portfolio

            22.4.18.3. Profitability by Market Segments (Product / Channel / Region)

            22.4.18.4. Distribution Footprint

            22.4.18.5. Strategy Overview

        22.4.19. John Richardo

            22.4.19.1. Overview

            22.4.19.2. Product Portfolio

            22.4.19.3. Profitability by Market Segments (Product / Channel / Region)

            22.4.19.4. Distribution Footprint

            22.4.19.5. Strategy Overview

        22.4.20. Michael Kors

            22.4.20.1. Overview

            22.4.20.2. Product Portfolio

            22.4.20.3. Profitability by Market Segments (Product / Channel / Region)

            22.4.20.4. Distribution Footprint

            22.4.20.5. Strategy Overview

        22.4.21. Philipp Plein

            22.4.21.1. Overview

            22.4.21.2. Product Portfolio

            22.4.21.3. Profitability by Market Segments (Product / Channel / Region)

            22.4.21.4. Distribution Footprint

            22.4.21.5. Strategy Overview

        22.4.22. Polo Ralph Lauren

            22.4.22.1. Overview

            22.4.22.2. Product Portfolio

            22.4.22.3. Profitability by Market Segments (Product / Channel / Region)

            22.4.22.4. Distribution Footprint

            22.4.22.5. Strategy Overview

        22.4.23. Ralph Lauren

            22.4.23.1. Overview

            22.4.23.2. Product Portfolio

            22.4.23.3. Profitability by Market Segments (Product / Channel / Region)

            22.4.23.4. Distribution Footprint

            22.4.23.5. Strategy Overview

        22.4.24. Ted Baker

            22.4.24.1. Overview

            22.4.24.2. Product Portfolio

            22.4.24.3. Profitability by Market Segments (Product / Channel / Region)

            22.4.24.4. Distribution Footprint

            22.4.24.5. Strategy Overview

        22.4.25. Others)

            22.4.25.1. Overview

            22.4.25.2. Product Portfolio

            22.4.25.3. Profitability by Market Segments (Product / Channel / Region)

            22.4.25.4. Distribution Footprint

            22.4.25.5. Strategy Overview

23. Assumptions and Acronyms Used

24. Research Methodology
Customize this Report

Let us know your requirement to get
100% FREE customization

List of Tables

Table 1: Global Value Value (US$ Million) Forecast, By Product Type, 2017 to 2032

Table 2: Global Value Volume (Million Units) Forecast, By Product Type, 2017 to 2032

Table 3: Global Value Value (US$ Million) Forecast, By Material, 2017 to 2032

Table 4: Global Value Volume (Million Units) Forecast, By Material, 2017 to 2032

Table 5: Global Value Value (US$ Million) Forecast, By Consumer Orientation, 2017 to 2032

Table 6: Global Value Volume (Million Units) Forecast, By Consumer Orientation, 2017 to 2032

Table 7: Global Value Value (US$ Million) Forecast, By Sales Channel, 2017 to 2032

Table 8: Global Value Volume (Million Units) Forecast, By Sales Channel, 2017 to 2032

Table 9: Global Value Value (US$ Million) Forecast, By Region, 2017 to 2032

Table 10: Global Value Volume (Million Units) Forecast, By Region, 2017 to 2032

Table 11: North America Value Value (US$ Million) Forecast, By Country, 2017 to 2032

Table 12: North America Value Volume (Million Units) Forecast, By Country, 2017 to 2032

Table 13: North America Value Value (US$ Million) Forecast, By Product Product Type, 2017 to 2032

Table 14: North America Value Volume (Million Units) Forecast, By Product Product Type, 2017 to 2032

Table 15: North America Value Value (US$ Million) Forecast, By Material, 2017 to 2032

Table 16: North America Value Volume (Million Units) Forecast, By Material, 2017 to 2032

Table 17: North America Value Value (US$ Million) Forecast, By Consumer Orientation, 2017 to 2032

Table 18: North America Value Value (US$ Million) Forecast, By Sales Channel, 2017 to 2032

Table 19: North America Value Volume (Million Units) Forecast, By Sales Channel, 2017 to 2032

Table 20: Latin America Value Volume (Million Units) Forecast, By Country, 2017 to 2032

Table 21: Latin America Value Value (US$ Million) Forecast, By Product Type, 2017 to 2032

Table 22: Latin America Value Volume (Million Units) Forecast, By Product Type, 2017 to 2032

Table 23: Latin America Value Value (US$ Million) Forecast, By Material, 2017 to 2032

Table 24: Latin America Value Volume (Million Units) Forecast, By Material, 2017 to 2032

Table 25: Latin America Value Value (US$ Million) Forecast, By Product Type, 2017 to 2032

Table 26: Latin America Value Volume (Million Units) Forecast, By Product Type, 2017 to 2032

Table 27: Latin America Value Value (US$ Million) Forecast, By Consumer Orientation, 2017 to 2032

Table 28: Latin America Value Volume (Million Units) Forecast, By Consumer Orientation, 2017 to 2032

Table 29: Latin America Value Value (US$ Million) Forecast, By Sales Channel, 2017 to 2032

Table 30: Latin America Value Volume (Million Units) Forecast, By Sales Channel, 2017 to 2032

Table 31: Europe Value Value (US$ Million) Forecast, By Product Type, 2017 to 2032

Table 32: Europe Value Volume (Million Units) Forecast, By Product Type, 2017 to 2032

Table 33: Europe Value Value (US$ Million) Forecast, By Material, 2017 to 2032

Table 34: Europe Value Volume (Million Units) Forecast, By Material, 2017 to 2032

Table 35: Europe Value Value (US$ Million) Forecast, By Product Type, 2017 to 2032

Table 36: Europe Value Volume (Million Units) Forecast, By Product Type, 2017 to 2032

Table 37: Europe Value Value (US$ Million) Forecast, By Consumer Orientation, 2017 to 2032

Table 38: Europe Value Volume (Million Units) Forecast, By Consumer Orientation, 2017 to 2032

Table 39: East Asia Value Value (US$ Million) Forecast, By Country, 2017 to 2032

Table 40: East Asia Value Value (US$ Million) Forecast, By Sales Channel, 2017 to 2032

Table 41: East Asia Value Volume (Million Units) Forecast, By Sales Channel, 2017 to 2032

Table 42: East Asia Value Volume (Million Units) Forecast, By Product Type, 2017 to 2032

Table 43: East Asia Value Value (US$ Million) Forecast, By Material, 2017 to 2032

Table 44: East Asia Value Volume (Million Units) Forecast, By Material, 2017 to 2032

Table 45: East Asia Value Value (US$ Million) Forecast, By Product Type, 2017 to 2032

Table 46: East Asia Value Volume (Million Units) Forecast, By Product Type, 2017 to 2032

Table 47: East Asia Value Value (US$ Million) Forecast, By Consumer Orientation, 2017 to 2032

Table 48: East Asia Value Volume (Million Units) Forecast, By Consumer Orientation, 2017 to 2032

Table 49: East Asia Value Value (US$ Million) Forecast, By Sales Channel, 2017 to 2032

Table 50: East Asia Value Volume (Million Units) Forecast, By Sales Channel, 2017 to 2032

Table 51: South Asia Value Value (US$ Million) Forecast, By Product Type, 2017 to 2032

Table 52: South Asia Value Volume (Million Units) Forecast, By Product Type, 2017 to 2032

Table 53: South Asia Value Value (US$ Million) Forecast, By Material, 2017 to 2032

Table 54: South Asia Value Volume (Million Units) Forecast, By Material, 2017 to 2032

Table 55: South Asia Value Value (US$ Million) Forecast, By Product Type, 2017 to 2032

Table 56: South Asia Value Volume (Million Units) Forecast, By Product Type, 2017 to 2032

Table 57: South Asia Value Value (US$ Million) Forecast, By Consumer Orientation, 2017 to 2032

Table 58: South Asia Value Volume (Million Units) Forecast, By Consumer Orientation, 2017 to 2032

Table 59: South Asia Value Value (US$ Million) Forecast, By Sales Channel, 2017 to 2032

Table 60: South Asia Value Volume (Million Units) Forecast, By Sales Channel, 2017 to 2032

Table 61: Oceania Value Value (US$ Million) Forecast, By Product Type, 2017 to 2032

Table 62: Oceania Value Volume (Million Units) Forecast, By Product Type, 2017 to 2032

Table 63: Oceania Value Value (US$ Million) Forecast, By Material, 2017 to 2032

Table 64: Oceania Value Volume (Million Units) Forecast, By Material, 2017 to 2032

Table 65: Oceania Value Value (US$ Million) Forecast, By Product Type, 2017 to 2032

Table 66: Oceania Value Volume (Million Units) Forecast, By Product Type, 2017 to 2032

Table 67: Oceania Value Value (US$ Million) Forecast, By Consumer Orientation, 2017 to 2032

Table 68: Oceania Value Volume (Million Units) Forecast, By Consumer Orientation, 2017 to 2032

Table 69: Oceania Value Value (US$ Million) Forecast, By Sales Channel, 2017 to 2032

Table 70: Oceania Value Volume (Million Units) Forecast, By Sales Channel, 2017 to 2032

Table 71: MEA Value Volume (Million Units) Forecast, By Country, 2017 to 2032

Table 72: MEA Value Value (US$ Million) Forecast, By Product Type, 2017 to 2032

Table 73: MEA Value Volume (Million Units) Forecast, By Product Type, 2017 to 2032

Table 74: MEA Value Value (US$ Million) Forecast, By Material, 2017 to 2032

Table 75: MEA Value Volume (Million Units) Forecast, By Material, 2017 to 2032

Table 76: MEA Value Value (US$ Million) Forecast, By Product Type, 2017 to 2032

Table 77: MEA Value Volume (Million Units) Forecast, By Product Type, 2017 to 2032

Table 78: MEA Value Value (US$ Million) Forecast, By Consumer Orientation, 2017 to 2032

Table 79: MEA Value Volume (Million Units) Forecast, By Consumer Orientation, 2017 to 2032

Table 80: MEA Value Value (US$ Million) Forecast, By Sales Channel, 2017 to 2032

Table 81: MEA Value Volume (Million Units) Forecast, By Sales Channel, 2017 to 2032

Table 82: Oceania Value Volume (Million Units) Forecast, By Consumer Orientation, 2017 to 2032

Table 83: Oceania Value Value (US$ Million) Forecast, By Sales Channel, 2017 to 2032

Table 84: Oceania Value Volume (Million Units) Forecast, By Sales Channel, 2017 to 2032

Table 85: MEA Value Volume (Million Units) Forecast, By Country, 2017 to 2032

Table 86: MEA Value Value (US$ Million) Forecast, By Closure Type, 2017 to 2032

Table 87: MEA Value Volume (Million Units) Forecast, By Closure Type, 2017 to 2032

Table 88: MEA Value Value (US$ Million) Forecast, By Sole Material, 2017 to 2032

Table 89: MEA Value Volume (Million Units) Forecast, By Sole Material, 2017 to 2032

Table 90: MEA Value Value (US$ Million) Forecast, By Outer Material, 2017 to 2032

Table 91: MEA Value Volume (Million Units) Forecast, By Outer Material, 2017 to 2032

Table 92: MEA Value Value (US$ Million) Forecast, By Closure Type, 2017 to 2032

Table 93: MEA Value Volume (Million Units) Forecast, By Closure Type, 2017 to 2032

Table 94: MEA Value Value (US$ Million) Forecast, By Consumer Orientation, 2017 to 2032

Table 95: MEA Value Volume (Million Units) Forecast, By Consumer Orientation, 2017 to 2032

Table 96: MEA Value Value (US$ Million) Forecast, By Sales Channel, 2017 to 2032

Table 97: MEA Value Volume (Million Units) Forecast, By Sales Channel, 2017 to 2032
Sneha Verghese
Principal Consultant
LinkedIn
Talk to Analyst

Find your sweet spots for generating winning opportunities in this market.

Talk to Analyst

List of Charts

Figure 01: Global Market Value (US$ Million) and Volume (Units) Analysis, 2017 to 2033

Figure 02: Global Market Value (US$ Million) and Volume (Units) Forecast 2022 to 2033

Figure 03: Global Market Value (US$ Million) and Volume (Units), 2017 to 2033

Figure 04: Global Market Absolute $ Opportunity (US$ Million) 2022 to 2033

Figure 05: Global Market Value (US$ Million) and Volume (Units) Forecast 2022 to 2033

Figure 06: Global Market Value (US$ Million) Analysis by Product Type, 2017 to 2033

Figure 07: Global Market Volume (Units) Analysis by Product Type, 2017 to 2033

Figure 08: Global Market Y-o-Y Growth (%) Projections, By Product Type, 2022 to 2033

Figure 09: Global Market Attractiveness by Product Type, 2022 to 2033

Figure 10: Global Market Value (US$ Million) Analysis by Material, 2017 to 2033

Figure 11: Global Market Volume (Units) Analysis by Material, 2017 to 2033

Figure 12: Global Market Y-o-Y Growth (%) Projections, By Material, 2022 to 2033

Figure 13: Global Market Attractiveness by Material, 2022 to 2033

Figure 14: Global Market Value (US$ Million) Analysis by Consumer Orientation, 2017 to 2033

Figure 15: Global Market Volume (Units) Analysis by Consumer Orientation, 2017 to 2033

Figure 16: Global Market Y-o-Y Growth (%) Projections, By Consumer Orientation, 2022 to 2033

Figure 17: Global Market Attractiveness by Consumer Orientation, 2022 to 2033

Figure 18: Global Market Value (US$ Million) Analysis by Sales Channel, 2017 to 2033

Figure 19: Global Market Volume (Units) Analysis by Sales Channel, 2017 to 2033

Figure 20: Global Market Y-o-Y Growth (%) Projections, By Sales Channel, 2022 to 2033

Figure 21: Global Market Attractiveness by Sales Channel, 2022 to 2033

Figure 22: Global Market Y-o-Y Growth (%) Projections, By Region, 2022 to 2033

Figure 23: Global Market Attractiveness by Region, 2022 to 2033

Figure 24: North America Market Value (US$ Million) and Volume (Units) Analysis, 2017 to 2033

Figure 25: North America Value (US$ Million) and Volume (Units) Forecast 2022 to 2033

Figure 26: North America Market Value (US$ Million) and Volume (Units) , 2017 to 2033

Figure 27: North America Market Absolute $ Opportunity (US$ Million) 2022 to 2033

Figure 28: North America Market Value (US$ Million) and Volume (Units) Forecast 2022 to 2033

Figure 29: North America Market Value (US$ Million) Analysis by Product Type, 2017 to 2033

Figure 30: North America Market Volume (Units) Analysis by Product Type, 2017 to 2033

Figure 31: North America Market Y-o-Y Growth (%) Projections, By Product Type, 2022 to 2033

Figure 32: North America Market Attractiveness by Product Type, 2022 to 2033

Figure 33: North America Market Value (US$ Million) Analysis by Material, 2017 to 2033

Figure 34: North America l Market Volume (Units) Analysis by Material, 2017 to 2033

Figure 35: North America Market Y-o-Y Growth (%) Projections, By Material, 2022 to 2033

Figure 36: North America Market Attractiveness by Material, 2022 to 2033

Figure 37: North America Market Value (US$ Million) Analysis by Consumer Orientation, 2017 to 2033

Figure 38: North America l Market Volume (Units) Analysis by Consumer Orientation, 2017 to 2033

Figure 39: North America Market Y-o-Y Growth (%) Projections, By Consumer Orientation, 2022 to 2033

Figure 40: North America Market Attractiveness by Consumer Orientation, 2022 to 2033

Figure 42: North America l Market Volume (Units) Analysis by Sales Channel, 2017 to 2033

Figure 43: North America Market Y-o-Y Growth (%) Projections, By Sales Channel, 2022 to 2033

Figure 44: North America Market Attractiveness by Sales Channel, 2022 to 2033

Figure 45: North America Market Y-o-Y Growth (%) Projections, By Region, 2022 to 2033

Figure 46: North America Market Attractiveness by Region, 2022 to 2033

Figure 47: Latin America Market Value (US$ Million) Analysis by Country, 2017 to 2033

Figure 48: Latin America Market Volume (Units) Analysis by Country, 2017 to 2033

Figure 49: Latin America Market Y-o-Y Growth (%) Projections, By Country, 2022 to 2033

Figure 50: Latin America Market Attractiveness by Country, 2022 to 2033

Figure 51: Latin America Market Value (US$ Million) Analysis by Product Type, 2017 to 2033

Figure 52: Latin America Market Volume (Units) Analysis by Product Type, 2017 to 2033

Figure 53: Latin America Market Y-o-Y Growth (%) Projections, By Product Type, 2022 to 2033

Figure 54: Latin America Market Attractiveness by Product Type, 2022 to 2033

Figure 55: Latin America Market Value (US$ Million) Analysis by Material, 2017 to 2033

Figure 56: Latin America Market Volume (Units) Analysis by Material, 2017 to 2033

Figure 57: Latin America Market Y-o-Y Growth (%) Projections, By Material, 2022 to 2033

Figure 58: Latin America Market Attractiveness by Material, 2022 to 2033

Figure 59: Latin America Market Value (Units) Analysis by Sole Material, 2017 to 2033

Figure 60: Latin America Market Volume (Units) Analysis by Sole Material, 2017 to 2033

Figure 61: Latin America Market Y-o-Y Growth (%) Projections, By Sole Material, 2022 to 2033

Figure 62: Latin America Market Attractiveness by Sole Material, 2022 to 2033

Figure 63: Latin America Market Value (US$ Million) Analysis by Consumer Orientation, 2017 to 2033

Figure 64: Latin America Market Volume (Units) Analysis by Consumer Orientation, 2017 to 2033

Figure 65: Latin America Market Y-o-Y Growth (%) Projections, By Consumer Orientation, 2022 to 2033

Figure 66: Latin America Market Attractiveness by Consumer Orientation, 2022 to 2033

Figure 67: Latin America Market Value (US$ Million) Analysis by Sales Channel, 2017 to 2033

Figure 68: Latin America Market Volume (Units) Analysis by Sales Channel, 2017 to 2033

Figure 69: Latin America Market Y-o-Y Growth (%) Projections, By Sales Channel, 2022 to 2033

Figure 70: Latin America Market Attractiveness by Sales Channel, 2022 to 2033

Figure 71: Europe Market Value (US$ Million) Analysis by Country, 2017 to 2033

Figure 72: Europe Market Volume (Units) Analysis by Country, 2017 to 2033

Figure 73: Europe Market Y-o-Y Growth (%) Projections, By Country, 2022 to 2033

Figure 74: Europe Market Attractiveness by Country, 2022 to 2033

Figure 75: Europe Market Value (US$ Million) Analysis by Product Type, 2017 to 2033

Figure 76: Europe Market Volume (Units) Analysis by Product Type, 2017 to 2033

Figure 77: Europe Market Y-o-Y Growth (%) Projections, By Product Type, 2022 to 2033

Figure 78: Europe Market Attractiveness by Product Type, 2022 to 2033

Figure 79: Europe Market Value (US$ Million) Analysis by Material, 2017 to 2033

Figure 80: Europe Market Volume (Units) Analysis by Material, 2017 to 2033

Figure 81: Europe Market Y-o-Y Growth (%) Projections, By Material, 2022 to 2033

Figure 82: Europe Market Attractiveness by Material, 2022 to 2033

Figure 83: Europe Market Value (Units) Analysis by Sole Material, 2017 to 2033

Figure 84: Europe Market Volume (Units) Analysis by Sole Material, 2017 to 2033

Figure 85: Europe Market Y-o-Y Growth (%) Projections, By Sole Material, 2022 to 2033

Figure 86: Europe Market Attractiveness by Sole Material, 2022 to 2033

Figure 87: Europe Market Value (US$ Million) Analysis by Consumer Orientation, 2017 to 2033

Figure 88: Europe Market Volume (Units) Analysis by Consumer Orientation, 2017 to 2033

Figure 89: Europe Market Y-o-Y Growth (%) Projections, By Consumer Orientation, 2022 to 2033

Figure 90: Europe Market Attractiveness by Consumer Orientation, 2022 to 2033

Figure 91: East Asia Market Value (US$ Million) Analysis by Country, 2017 to 2033

Figure 92: East Asia Market Volume (Units) Analysis by Country, 2017 to 2033

Figure 93: East Asia Market Y-o-Y Growth (%) Projections, By Country, 2022 to 2033

Figure 94: East Asia Market Attractiveness by Country, 2022 to 2033

Figure 95: East Asia Market Value (US$ Million) Analysis by Product Type, 2017 to 2033

Figure 96: East Asia Market Volume (Units) Analysis by Product Type, 2017 to 2033

Figure 97: East Asia Market Y-o-Y Growth (%) Projections, By Product Type, 2022 to 2033

Figure 98: East Asia Market Attractiveness by Product Type, 2022 to 2033

Figure 99: East Asia Market Value (US$ Million) Analysis by Material, 2017 to 2033

Figure 100: East Asia Market Volume (Units) Analysis by Material, 2017 to 2033

Figure 101: East Asia Market Y-o-Y Growth (%) Projections, By Material, 2022 to 2033

Figure 102: East Asia Market Attractiveness by Material, 2022 to 2033

Figure 103: East Asia Market Value (Units) Analysis by Sole Material, 2017 to 2033

Figure 104: East Asia Market Volume (Units) Analysis by Sole Material, 2017 to 2033

Figure 105: East Asia Market Y-o-Y Growth (%) Projections, By Sole Material, 2022 to 2033

Figure 106: East Asia Market Attractiveness by Sole Material, 2022 to 2033

Figure 107: East Asia Market Value (US$ Million) Analysis by Consumer Orientation, 2017 to 2033

Figure 108: East Asia Market Volume (Units) Analysis by Consumer Orientation, 2017 to 2033

Figure 109: East Asia Market Y-o-Y Growth (%) Projections, By Consumer Orientation, 2022 to 2033

Figure 110: East Asia Market Attractiveness by Consumer Orientation, 2022 to 2033

Figure 111: East Asia Market Value (US$ Million) Analysis by Sales Channel, 2017 to 2033

Figure 112: East Asia Market Volume (Units) Analysis by Sales Channel, 2017 to 2033

Figure 113: East Asia Market Y-o-Y Growth (%) Projections, By Sales Channel, 2022 to 2033

Figure 114: East Asia Market Attractiveness by Sales Channel, 2022 to 2033

Figure 115: South Asia Market Value (US$ Million) Analysis by Country, 2017 to 2033

Figure 116: South Asia Market Volume (Units) Analysis by Country, 2017 to 2033

Figure 117: South Asia Market Y-o-Y Growth (%) Projections, By Country, 2022 to 2033

Figure 118: South Asia Market Attractiveness by Country, 2022 to 2033

Figure 119: South Asia Market Value (US$ Million) Analysis by Product Type, 2017 to 2033

Figure 120: South Asia Market Volume (Units) Analysis by Product Type, 2017 to 2033

Figure 121: South Asia Market Y-o-Y Growth (%) Projections, By Product Type, 2022 to 2033

Figure 122: South Asia Market Attractiveness by Product Type, 2022 to 2033

Figure 123: South Asia Market Value (US$ Million) Analysis by Material, 2017 to 2033

Figure 124: South Asia Market Volume (Units) Analysis by Material, 2017 to 2033

Figure 125: South Asia Market Y-o-Y Growth (%) Projections, By Material, 2022 to 2033

Figure 126: South Asia Market Attractiveness by Material, 2022 to 2033

Figure 127: South Asia Market Value (Units) Analysis by Sole Material, 2017 to 2033

Figure 128: South Asia Market Volume (Units) Analysis by Sole Material, 2017 to 2033

Figure 129: South Asia Market Y-o-Y Growth (%) Projections, By Sole Material, 2022 to 2033

Figure 130: South Asia Market Attractiveness by Sole Material, 2022 to 2033

Figure 131: South Asia Market Value (US$ Million) Analysis by Consumer Orientation, 2017 to 2033

Figure 132: South Asia Market Volume (Units) Analysis by Consumer Orientation, 2017 to 2033

Figure 133: South Asia Market Y-o-Y Growth (%) Projections, By Consumer Orientation, 2022 to 2033

Figure 134: South Asia Market Attractiveness by Consumer Orientation, 2022 to 2033

Figure 135: South Asia Market Value (US$ Million) Analysis by Sales Channel, 2017 to 2033

Figure 136: South Asia Market Volume (Units) Analysis by Sales Channel, 2017 to 2033

Figure 137: South Asia Market Y-o-Y Growth (%) Projections, By Sales Channel, 2022 to 2033

Figure 138: South Asia Market Attractiveness by Sales Channel, 2022 to 2033

Figure 139: Oceania Market Value (US$ Million) Analysis by Country, 2017 to 2033

Figure 140: Oceania Market Volume (Units) Analysis by Country, 2017 to 2033

Figure 141: Oceania Market Y-o-Y Growth (%) Projections, By Country, 2022 to 2033

Figure 142: Oceania Market Attractiveness by Country, 2022 to 2033

Figure 143: Oceania Market Value (US$ Million) Analysis by Product Type, 2017 to 2033

Figure 144: Oceania Market Volume (Units) Analysis by Product Type, 2017 to 2033

Figure 145: Oceania Market Y-o-Y Growth (%) Projections, By Product Type, 2022 to 2033

Figure 146: Oceania Market Attractiveness by Product Type, 2022 to 2033

Figure 147: Oceania Market Value (US$ Million) Analysis by Material, 2017 to 2033

Figure 148: Oceania Market Volume (Units) Analysis by Material, 2017 to 2033

Figure 149: Oceania Market Y-o-Y Growth (%) Projections, By Material, 2022 to 2033

Figure 150: Oceania Market Attractiveness by Material, 2022 to 2033

Figure 151: Oceania Market Value (Units) Analysis by Sole Material, 2017 to 2033

Figure 152: Oceania Market Volume (Units) Analysis by Sole Material, 2017 to 2033

Figure 153: Oceania Market Y-o-Y Growth (%) Projections, By Sole Material, 2022 to 2033

Figure 154: Oceania Market Attractiveness by Sole Material, 2022 to 2033

Figure 155: Oceania Market Value (US$ Million) Analysis by Consumer Orientation, 2017 to 2033

Figure 156: Oceania Market Volume (Units) Analysis by Consumer Orientation, 2017 to 2033

Figure 157: Oceania Market Y-o-Y Growth (%) Projections, By Consumer Orientation, 2022 to 2033

Figure 158: Oceania Market Attractiveness by Consumer Orientation, 2022 to 2033

Figure 159: Oceania Market Value (US$ Million) Analysis by Sales Channel, 2017 to 2033

Figure 160: Oceania Market Volume (Units) Analysis by Sales Channel, 2017 to 2033

Figure 161: Oceania Market Y-o-Y Growth (%) Projections, By Sales Channel, 2022 to 2033

Figure 162: Oceania Market Attractiveness by Sales Channel, 2022 to 2033

Figure 163: MEA Market Value (US$ Million) Analysis by Country, 2017 to 2033

Figure 164: MEA Market Volume (Units) Analysis by Country, 2017 to 2033

Figure 165: MEA Market Y-o-Y Growth (%) Projections, By Country, 2022 to 2033

Figure 166: MEA Market Attractiveness by Country, 2022 to 2033

Figure 167: MEA Market Value (US$ Million) Analysis by Product Type, 2017 to 2033

Figure 168: MEA Market Volume (Units) Analysis by Product Type, 2017 to 2033

Figure 169: MEA Market Y-o-Y Growth (%) Projections, By Product Type, 2022 to 2033

Figure 170: MEA Market Attractiveness by Product Type, 2022 to 2033

Figure 171: MEA Market Value (US$ Million) Analysis by Material, 2017 to 2033

Figure 172: MEA Market Volume (Units) Analysis by Material, 2017 to 2033

Figure 173: MEA Market Y-o-Y Growth (%) Projections, By Material, 2022 to 2033

Figure 174: MEA Market Attractiveness by Material, 2022 to 2033

Figure 175: MEA Market Value (Units) Analysis by Sole Material, 2017 to 2033

Figure 176: MEA Market Volume (Units) Analysis by Sole Material, 2017 to 2033

Figure 177: MEA Market Y-o-Y Growth (%) Projections, By Sole Material, 2022 to 2033

Figure 178: MEA Market Attractiveness by Sole Material, 2022 to 2033

Figure 179: MEA Market Value (US$ Million) Analysis by Consumer Orientation, 2017 to 2033

Figure 180: MEA Market Volume (Units) Analysis by Consumer Orientation, 2017 to 2033

Figure 181: MEA Market Value (US$ Million) Analysis by Sales Channel, 2017 to 2033

Figure 182: MEA Market Volume (Units) Analysis by Sales Channel, 2017 to 2033

Figure 183: MEA Market Y-o-Y Growth (%) Projections, By Sales Channel, 2022 to 2033

Figure 184: MEA Market Attractiveness by Sales Channel, 2022 to 2033

Need specific information?

Request Customization

Explore Consumer Product Insights

View Reports
Google translate

Designer Sneaker Market