Computer Peripherals Market Size and Share Forecast Outlook 2025 to 2035

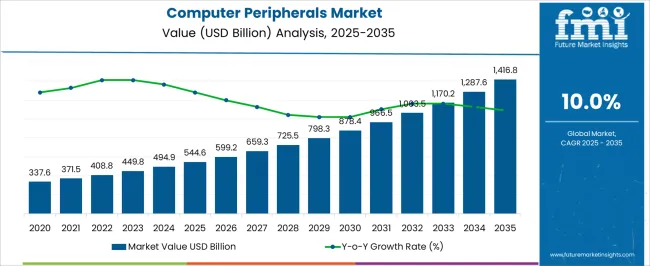
The Computer Peripherals Market is estimated to be valued at USD 544.6 billion in 2025 and is projected to reach USD 1416.8 billion by 2035, registering a compound annual growth rate (CAGR) of 10.0% over the forecast period.
Quick Stats for Computer Peripherals Market

  • Computer Peripherals Market Industry Value (2025): USD 544.6 billion
  • Computer Peripherals Market Forecast Value (2035): USD 1416.8 billion
  • Computer Peripherals Market Forecast CAGR: 10.0%
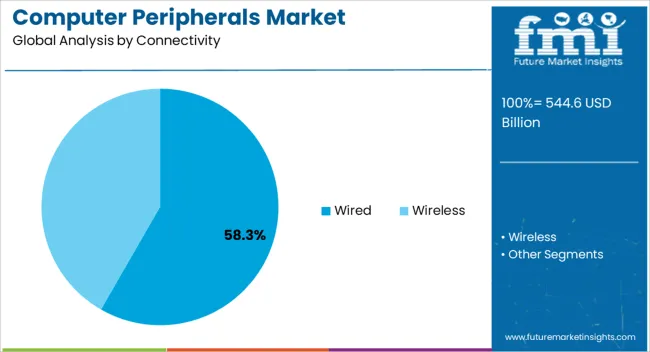
  • Leading Segment in Computer Peripherals Market in 2025: Wired (58.3%)
  • Key Growth Region in Computer Peripherals Market: North America, Asia-Pacific, Europe
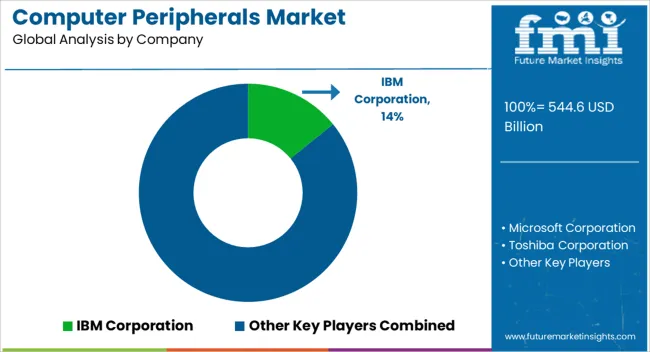
  • Top Key Players in Computer Peripherals Market: IBM Corporation, Microsoft Corporation, Toshiba Corporation, Logitech, Hewlett Packard Enterprise Development LP, Dell, Inc., Intel Corporation, SAMSUNG, Apple, Ricoh

Computer Peripherals Market Market Value Analysis

Metric Value
Computer Peripherals Market Estimated Value in (2025 E) USD 544.6 billion
Computer Peripherals Market Forecast Value in (2035 F) USD 1416.8 billion
Forecast CAGR (2025 to 2035) 10.0%

Rationale for Segmental Growth in the Computer Peripherals Market

The computer peripherals market is experiencing consistent growth supported by the rapid expansion of digital infrastructure, rising adoption of remote working models, and increasing demand for high performance devices. The shift toward hybrid workplaces and digital education has intensified the requirement for efficient, durable, and user friendly peripherals that enhance productivity.

Advancements in connectivity, ergonomics, and device compatibility are driving continuous innovation in the market. The proliferation of gaming, content creation, and e commerce has further accelerated demand for specialized peripherals, while ongoing price competitiveness makes them more accessible across consumer groups.

The overall outlook remains positive as technology integration, lifestyle shifts, and expanding residential and commercial use cases continue to define the growth trajectory of the computer peripherals industry.
Segmental Analysis

Insights into the Wired Connectivity Segment

Computer Peripherals Market Analysis By Connectivity

The wired connectivity segment is expected to account for 58.30% of total market revenue by 2025, making it the leading connectivity type. Its dominance is supported by reliability in performance, lower latency, and cost effectiveness compared to wireless alternatives.

Wired peripherals are less prone to interference, provide uninterrupted power, and are particularly valued in enterprise, educational, and gaming environments where consistent performance is critical.

Affordability and wide availability further enhance adoption, positioning wired solutions as a preferred choice in both emerging and developed markets.
Insights into the Input Devices Product Type Segment

Computer Peripherals Market Analysis By Product Type

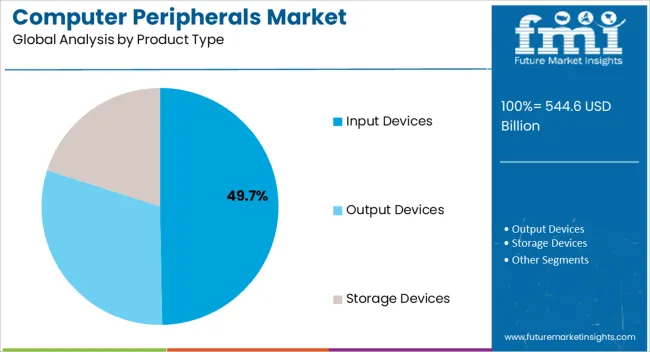
The input devices segment is projected to capture 49.70% of total revenue by 2025 within the product type category, positioning it as the most significant contributor. This growth is attributed to the indispensable role of devices such as keyboards, mice, and pointing devices in both personal and professional computing.

Rising demand for ergonomic designs, specialized gaming peripherals, and multi device compatible input tools has further expanded market penetration.

As digital adoption increases across residential and commercial sectors, the input devices category remains a fundamental and irreplaceable segment within the computer peripherals market.

What are the Factors Driving Global Computer Peripherals Market?

Rising Digitalization in Education Sector to Boost the Market

Students can also enroll in several courses offered by several other online course providers like Coursera, Udemy, BYJYU’s, edX, and Unacademy, among others. Therefore, rising digitalization, especially, among developing nations is anticipated to augment the market size in the assessment period.

Increasing strategic partnerships and acquisitions are anticipated to provide a significant boost to the market in the forecast period. For instance, in March 2024, BluPeak, a PC and hardware player, inked a partnership agreement with Dicker Data.

In May 2020, similarly, Toshiba Memory Corp and Western Digital Corp disclosed an agreement to jointly invest in the K1 manufacturing facility that Toshiba Memory is constructing in Kitakami, Iwate Prefecture, Japan. The rise in such initiatives is expected to bolster the industry in the forecast period.

What are the Challenges of the Global Computer Peripherals Market?

The rise in counterfeit products is expected to act as a significant market restrain during the forecast period. Various consumer electronics manufacturers face such challenges with the availability of counterfeit products at local stores and as well as e-commerce channels.

Their easy availability through various distribution channels is projected to hinder market expansion in the coming time. Also, the rising preference for smartphones and tablets over computers and laptops is anticipated to be a significant factor impeding the expansion in the forecast period.

However, with players taking several initiatives to tackle such challenges, the market is expected to show significant growth. For instance, in February 2025, Micross Components, Inc. an eminent mission-critical microelectronic provider, hosted a webinar on the supply chain challenges faced by specifiers, procurers, and designers. The title of the webinar was ‘How can we eliminate the risk of potentially using counterfeit parts?’ The webinar might offer industry insights and lessons from manufacturers and trusted solutions employed to eradicate the risk of counterfeit parts.

What are the Emerging Opportunities in the Global Computer Peripherals Market?

The increasing demand for external devices and the growing disposable income of an individual is expected to offer significant opportunities in the forecast period. The surge in data traffic and the growing need for compact and better storage devices is likely to enhance demand for better USB devices across the globe, thus, offering significant opportunities to players.

Players in the global computer peripherals market are taking several initiatives to expand their reach. For instance, in August 2024, Kingston Digital announced the launch of a new DataTraveler Max USD drive.

The company states that the USB-3 3.2 flash drive is likely to give record-breaking speeds for data transmission of up to 1,000 MB/s read and 900 MB/s. Production of such products is likely to drive the market and also act as an opportunity to market growth.

What is the Segmentation Analysis of the Global Computer Peripherals Market?

Wireless Computer Peripherals Soon to Take over their Wired Counterparts

As per the analysis, in the end-use segment, the commercial segment is expected to dominate the market in the forecast period. The segment is projected to expand at a 10.2% CAGR in the forecast period. The growth of the segment can be attributed to the rapid growth of the IT sector, which generates huge demand for computer peripherals. Developed nations such as the United States and Canada are anticipated to notable contributions in driving the market expansion.

Category By Connectivity
Top Segment Wired Computer Peripherals
Market Share in Percentage 59.4%
Category By End Use
Top Segment Commercial
Market Share in Percentage 60.3%

On the other hand, by product type, the storage devices segment is likely to dominate the market in the forecast period. The segment is anticipated to expand at an 11% CAGR during the forecast period. The growth of the segment can be attributed to the increased demand for efficient USB devices. An increase in data traffic and the rising requirement for compact and efficient storage devices are likely to enhance the demand for better USB devices across the globe.

Which are the Regions Boosting the Global Computer Peripherals Market?

Regional Market Comparison Global Market Share in Percentage
North America 32.1%
Europe 25.5%

North America to Retain its Dominance through the Forecast Years

As per the analysis, the global computer peripherals market is anticipated to be dominated by North America during the forecast period. As per the observations, the market in the United States is expected to make a substantial contribution to developing the regional market. The United States is anticipated to secure USD 1416.8 billion by 2035 while expanding at a CAGR of 9.6% from 2025 to 2035.

The presence of the most established players in the region is another salient factor driving the market in the region. For instance, in April 2025, Apple announced to unveil of two new Macs at WWDC 2025.

The Europe market is anticipated to be a lucrative market during the forecast period. As per the estimations, the United Kingdom is likely to be the most active player in propelling the market. The United Kingdom is projected to garner USD 544.6 billion, exhibiting a CAGR of 9.8% in the forecast period from 2025 to 2035.

The growth of the regional market can be credited to the increasing involvement of the government. For instance, the United Kingdom government awarded 15 million Euros to six universities and laboratories to work on the world’s leading radio telescope. Two teams from Oxford plan to work on software and computer hardware. Such initiatives are expected to propel the market in the forecast period.

Regional Market Comparison Global Market Share in Percentage
United States 17.6%
Germany 10.4%
Japan 5.4%
Australia 2.6%

Hardware & Electronics Manufacturers in Asia Pacific to Transform the Future of the Market

APAC is anticipated to be a fast-growing market during the forecast period. The growth of the region can be attributed to the presence of rapidly developing countries such as; India, China, and Japan. As per the estimations, China is expected to garner USD 87.5 billion in 2035.

The region is projected to exhibit a CAGR of 12.4% from 2025 to 2035. For instance, in April 2025, Lenovo announced to invest billions of dollars in the coming five years in research and development for modern technologies. The money is aimed to be spent on products and services related to the fast-growing metaverse space.

The market in Japan is anticipated at USD 50.1 billion while expanding at a CAGR of 12% during the forecast period. The expansion of the Japanese market can be attributed to the presence of strong players making aggressive investments in expanding the industry. Moreover, the rapid technological development of the region is expected to offer significant opportunities for market expansion in the forecast period.

Analysis reveals that the market in India is expected to garner USD 62.8 billion while expanding at a CAGR of 12% during the forecast period from 2025 to 2035. The growth of the market can be attributed to the increasing government participation in providing computer systems to underprivileged children.

The active participation of NITI Ayog and the growing participation of BYJYU are other salient factors developing the market. For instance, initiatives such as Skill India and the Digital India program are expected to benefit the market. In April 2025, the Chozuba Center of All India Computer Sakshatra Mission was formally inaugurated in the Phek district of Kohima. Such initiatives are likely to assist the expansion of the market in India.

Countries CAGR (2025 to 2035)
United States 9.7%
United Kingdom 9.9%
China 12.5%
Japan 12.1%
India 12.2%

Which are the Significant Players in the Global Computer Peripherals Market?

Computer Peripherals Market Analysis By Company

Key players in the global computer peripherals market include Hewlett-Packard Enterprise Canon Inc., Dell, Inc., Apple, Inc., and Seiko Epson Corporation, among others.

Recent key Developments by the Market Players are:

  • In April 2025, Dell, Nvidia, and AMD announced the power of the new Ohio AI compute cluster. The Ohio Supercomputer Center (OSC) may build a new high-performance computing cluster for AI applications based on Dell hardware with AMD Epyc processors and Nvidia accelerators.
  • In April 2025, Espon announced new A4 Desktop color multifunction printer for Eco-conscious businesses.

Key Segments Covered in the Computer Peripherals Industry Survey

Computer Peripherals Industry by Connectivity:

  • Wired
  • Wireless

Computer Peripherals Industry by End Use:

  • Residential Use
  • Commercial Use

Computer Peripherals Industry by Product Type:

  • Input Devices
  • Output Devices
  • Storage Devices

Computer Peripherals Industry by Region:

  • North America
  • Europe
  • East Asia
  • South Asia
  • Oceania
  • The Middle East & Africa (ME&A)
  • South America

Frequently Asked Questions

How big is the computer peripherals market in 2025?

The global computer peripherals market is estimated to be valued at USD 544.6 billion in 2025.

What will be the size of computer peripherals market in 2035?

The market size for the computer peripherals market is projected to reach USD 1,416.8 billion by 2035.

How much will be the computer peripherals market growth between 2025 and 2035?

The computer peripherals market is expected to grow at a 10.0% CAGR between 2025 and 2035.

What are the key product types in the computer peripherals market?

The key product types in computer peripherals market are wired and wireless.

Which end use segment to contribute significant share in the computer peripherals market in 2025?

In terms of end use, residential use segment to command 62.1% share in the computer peripherals market in 2025.

Table of Content

  1. Executive Summary
    • Global Market Outlook
    • Demand-side Trends
    • Supply-side Trends
    • Technology Roadmap Analysis
    • Analysis and Recommendations
  2. Market Overview
    • Market Coverage / Taxonomy
    • Market Definition / Scope / Limitations
  3. Market Background
    • Market Dynamics
      • Drivers
      • Restraints
      • Opportunity
      • Trends
    • Scenario Forecast
      • Demand in Optimistic Scenario
      • Demand in Likely Scenario
      • Demand in Conservative Scenario
    • Opportunity Map Analysis
    • Product Life Cycle Analysis
    • Supply Chain Analysis
    • Investment Feasibility Matrix
    • Value Chain Analysis
    • PESTLE and Porter’s Analysis
    • Regulatory Landscape
    • Regional Parent Market Outlook
    • Production and Consumption Statistics
    • Import and Export Statistics
  4. Global Market Analysis 2020 to 2024 and Forecast, 2025 to 2035
    • Historical Market Size Value (USD Million) Analysis, 2020 to 2024
    • Current and Future Market Size Value (USD Million) Projections, 2025 to 2035
      • Y-o-Y Growth Trend Analysis
      • Absolute $ Opportunity Analysis
  5. Global Market Pricing Analysis 2020 to 2024 and Forecast 2025 to 2035
  6. Global Market Analysis 2020 to 2024 and Forecast 2025 to 2035, By Connectivity
    • Introduction / Key Findings
    • Historical Market Size Value (USD Million) Analysis By Connectivity , 2020 to 2024
    • Current and Future Market Size Value (USD Million) Analysis and Forecast By Connectivity , 2025 to 2035
      • Wired
      • Wireless
    • Y-o-Y Growth Trend Analysis By Connectivity , 2020 to 2024
    • Absolute $ Opportunity Analysis By Connectivity , 2025 to 2035
  7. Global Market Analysis 2020 to 2024 and Forecast 2025 to 2035, By End Use
    • Introduction / Key Findings
    • Historical Market Size Value (USD Million) Analysis By End Use, 2020 to 2024
    • Current and Future Market Size Value (USD Million) Analysis and Forecast By End Use, 2025 to 2035
      • Residential Use
      • Commercial Use
    • Y-o-Y Growth Trend Analysis By End Use, 2020 to 2024
    • Absolute $ Opportunity Analysis By End Use, 2025 to 2035
  8. Global Market Analysis 2020 to 2024 and Forecast 2025 to 2035, By Product Type
    • Introduction / Key Findings
    • Historical Market Size Value (USD Million) Analysis By Product Type, 2020 to 2024
    • Current and Future Market Size Value (USD Million) Analysis and Forecast By Product Type, 2025 to 2035
      • Input Devices
      • Output Devices
      • Storage Devices
    • Y-o-Y Growth Trend Analysis By Product Type, 2020 to 2024
    • Absolute $ Opportunity Analysis By Product Type, 2025 to 2035
  9. Global Market Analysis 2020 to 2024 and Forecast 2025 to 2035, By Region
    • Introduction
    • Historical Market Size Value (USD Million) Analysis By Region, 2020 to 2024
    • Current Market Size Value (USD Million) Analysis and Forecast By Region, 2025 to 2035
      • North America
      • Latin America
      • Western Europe
      • Eastern Europe
      • East Asia
      • South Asia and Pacific
      • Middle East & Africa
    • Market Attractiveness Analysis By Region
  10. North America Market Analysis 2020 to 2024 and Forecast 2025 to 2035, By Country
    • Historical Market Size Value (USD Million) Trend Analysis By Market Taxonomy, 2020 to 2024
    • Market Size Value (USD Million) Forecast By Market Taxonomy, 2025 to 2035
      • By Country
        • USA
        • Canada
        • Mexico
      • By Connectivity
      • By End Use
      • By Product Type
    • Market Attractiveness Analysis
      • By Country
      • By Connectivity
      • By End Use
      • By Product Type
    • Key Takeaways
  11. Latin America Market Analysis 2020 to 2024 and Forecast 2025 to 2035, By Country
    • Historical Market Size Value (USD Million) Trend Analysis By Market Taxonomy, 2020 to 2024
    • Market Size Value (USD Million) Forecast By Market Taxonomy, 2025 to 2035
      • By Country
        • Brazil
        • Chile
        • Rest of Latin America
      • By Connectivity
      • By End Use
      • By Product Type
    • Market Attractiveness Analysis
      • By Country
      • By Connectivity
      • By End Use
      • By Product Type
    • Key Takeaways
  12. Western Europe Market Analysis 2020 to 2024 and Forecast 2025 to 2035, By Country
    • Historical Market Size Value (USD Million) Trend Analysis By Market Taxonomy, 2020 to 2024
    • Market Size Value (USD Million) Forecast By Market Taxonomy, 2025 to 2035
      • By Country
        • Germany
        • UK
        • Italy
        • Spain
        • France
        • Nordic
        • BENELUX
        • Rest of Western Europe
      • By Connectivity
      • By End Use
      • By Product Type
    • Market Attractiveness Analysis
      • By Country
      • By Connectivity
      • By End Use
      • By Product Type
    • Key Takeaways
  13. Eastern Europe Market Analysis 2020 to 2024 and Forecast 2025 to 2035, By Country
    • Historical Market Size Value (USD Million) Trend Analysis By Market Taxonomy, 2020 to 2024
    • Market Size Value (USD Million) Forecast By Market Taxonomy, 2025 to 2035
      • By Country
        • Russia
        • Poland
        • Hungary
        • Balkan & Baltic
        • Rest of Eastern Europe
      • By Connectivity
      • By End Use
      • By Product Type
    • Market Attractiveness Analysis
      • By Country
      • By Connectivity
      • By End Use
      • By Product Type
    • Key Takeaways
  14. East Asia Market Analysis 2020 to 2024 and Forecast 2025 to 2035, By Country
    • Historical Market Size Value (USD Million) Trend Analysis By Market Taxonomy, 2020 to 2024
    • Market Size Value (USD Million) Forecast By Market Taxonomy, 2025 to 2035
      • By Country
        • China
        • Japan
        • South Korea
      • By Connectivity
      • By End Use
      • By Product Type
    • Market Attractiveness Analysis
      • By Country
      • By Connectivity
      • By End Use
      • By Product Type
    • Key Takeaways
  15. South Asia and Pacific Market Analysis 2020 to 2024 and Forecast 2025 to 2035, By Country
    • Historical Market Size Value (USD Million) Trend Analysis By Market Taxonomy, 2020 to 2024
    • Market Size Value (USD Million) Forecast By Market Taxonomy, 2025 to 2035
      • By Country
        • India
        • ASEAN
        • Australia & New Zealand
        • Rest of South Asia and Pacific
      • By Connectivity
      • By End Use
      • By Product Type
    • Market Attractiveness Analysis
      • By Country
      • By Connectivity
      • By End Use
      • By Product Type
    • Key Takeaways
  16. Middle East & Africa Market Analysis 2020 to 2024 and Forecast 2025 to 2035, By Country
    • Historical Market Size Value (USD Million) Trend Analysis By Market Taxonomy, 2020 to 2024
    • Market Size Value (USD Million) Forecast By Market Taxonomy, 2025 to 2035
      • By Country
        • Kingdom of Saudi Arabia
        • Other GCC Countries
        • Turkiye
        • South Africa
        • Other African Union
        • Rest of Middle East & Africa
      • By Connectivity
      • By End Use
      • By Product Type
    • Market Attractiveness Analysis
      • By Country
      • By Connectivity
      • By End Use
      • By Product Type
    • Key Takeaways
  17. Key Countries Market Analysis
    • USA
      • Pricing Analysis
      • Market Share Analysis, 2024
        • By Connectivity
        • By End Use
        • By Product Type
    • Canada
      • Pricing Analysis
      • Market Share Analysis, 2024
        • By Connectivity
        • By End Use
        • By Product Type
    • Mexico
      • Pricing Analysis
      • Market Share Analysis, 2024
        • By Connectivity
        • By End Use
        • By Product Type
    • Brazil
      • Pricing Analysis
      • Market Share Analysis, 2024
        • By Connectivity
        • By End Use
        • By Product Type
    • Chile
      • Pricing Analysis
      • Market Share Analysis, 2024
        • By Connectivity
        • By End Use
        • By Product Type
    • Germany
      • Pricing Analysis
      • Market Share Analysis, 2024
        • By Connectivity
        • By End Use
        • By Product Type
    • UK
      • Pricing Analysis
      • Market Share Analysis, 2024
        • By Connectivity
        • By End Use
        • By Product Type
    • Italy
      • Pricing Analysis
      • Market Share Analysis, 2024
        • By Connectivity
        • By End Use
        • By Product Type
    • Spain
      • Pricing Analysis
      • Market Share Analysis, 2024
        • By Connectivity
        • By End Use
        • By Product Type
    • France
      • Pricing Analysis
      • Market Share Analysis, 2024
        • By Connectivity
        • By End Use
        • By Product Type
    • India
      • Pricing Analysis
      • Market Share Analysis, 2024
        • By Connectivity
        • By End Use
        • By Product Type
    • ASEAN
      • Pricing Analysis
      • Market Share Analysis, 2024
        • By Connectivity
        • By End Use
        • By Product Type
    • Australia & New Zealand
      • Pricing Analysis
      • Market Share Analysis, 2024
        • By Connectivity
        • By End Use
        • By Product Type
    • China
      • Pricing Analysis
      • Market Share Analysis, 2024
        • By Connectivity
        • By End Use
        • By Product Type
    • Japan
      • Pricing Analysis
      • Market Share Analysis, 2024
        • By Connectivity
        • By End Use
        • By Product Type
    • South Korea
      • Pricing Analysis
      • Market Share Analysis, 2024
        • By Connectivity
        • By End Use
        • By Product Type
    • Russia
      • Pricing Analysis
      • Market Share Analysis, 2024
        • By Connectivity
        • By End Use
        • By Product Type
    • Poland
      • Pricing Analysis
      • Market Share Analysis, 2024
        • By Connectivity
        • By End Use
        • By Product Type
    • Hungary
      • Pricing Analysis
      • Market Share Analysis, 2024
        • By Connectivity
        • By End Use
        • By Product Type
    • Kingdom of Saudi Arabia
      • Pricing Analysis
      • Market Share Analysis, 2024
        • By Connectivity
        • By End Use
        • By Product Type
    • Turkiye
      • Pricing Analysis
      • Market Share Analysis, 2024
        • By Connectivity
        • By End Use
        • By Product Type
    • South Africa
      • Pricing Analysis
      • Market Share Analysis, 2024
        • By Connectivity
        • By End Use
        • By Product Type
  18. Market Structure Analysis
    • Competition Dashboard
    • Competition Benchmarking
    • Market Share Analysis of Top Players
      • By Regional
      • By Connectivity
      • By End Use
      • By Product Type
  19. Competition Analysis
    • Competition Deep Dive
      • IBM Corporation
        • Overview
        • Product Portfolio
        • Profitability by Market Segments (Product/Age /Sales Channel/Region)
        • Sales Footprint
        • Strategy Overview
          • Marketing Strategy
          • Product Strategy
          • Channel Strategy
      • Microsoft Corporation
      • Toshiba Corporation
      • Logitech
      • Hewlett Packard Enterprise Development LP
      • Dell, Inc.
      • Intel Corporation
      • SAMSUNG
      • Apple
      • Ricoh
  20. Assumptions & Acronyms Used
  21. Research Methodology

List of Tables

  • Table 1: Global Market Value (USD Million) Forecast by Region, 2020-2035
  • Table 2: Global Market Value (USD Million) Forecast by Connectivity , 2020-2035
  • Table 3: Global Market Value (USD Million) Forecast by End Use, 2020-2035
  • Table 4: Global Market Value (USD Million) Forecast by Product Type, 2020-2035
  • Table 5: North America Market Value (USD Million) Forecast by Country, 2020-2035
  • Table 6: North America Market Value (USD Million) Forecast by Connectivity , 2020-2035
  • Table 7: North America Market Value (USD Million) Forecast by End Use, 2020-2035
  • Table 8: North America Market Value (USD Million) Forecast by Product Type, 2020-2035
  • Table 9: Latin America Market Value (USD Million) Forecast by Country, 2020-2035
  • Table 10: Latin America Market Value (USD Million) Forecast by Connectivity , 2020-2035
  • Table 11: Latin America Market Value (USD Million) Forecast by End Use, 2020-2035
  • Table 12: Latin America Market Value (USD Million) Forecast by Product Type, 2020-2035
  • Table 13: Western Europe Market Value (USD Million) Forecast by Country, 2020-2035
  • Table 14: Western Europe Market Value (USD Million) Forecast by Connectivity , 2020-2035
  • Table 15: Western Europe Market Value (USD Million) Forecast by End Use, 2020-2035
  • Table 16: Western Europe Market Value (USD Million) Forecast by Product Type, 2020-2035
  • Table 17: Eastern Europe Market Value (USD Million) Forecast by Country, 2020-2035
  • Table 18: Eastern Europe Market Value (USD Million) Forecast by Connectivity , 2020-2035
  • Table 19: Eastern Europe Market Value (USD Million) Forecast by End Use, 2020-2035
  • Table 20: Eastern Europe Market Value (USD Million) Forecast by Product Type, 2020-2035
  • Table 21: East Asia Market Value (USD Million) Forecast by Country, 2020-2035
  • Table 22: East Asia Market Value (USD Million) Forecast by Connectivity , 2020-2035
  • Table 23: East Asia Market Value (USD Million) Forecast by End Use, 2020-2035
  • Table 24: East Asia Market Value (USD Million) Forecast by Product Type, 2020-2035
  • Table 25: South Asia and Pacific Market Value (USD Million) Forecast by Country, 2020-2035
  • Table 26: South Asia and Pacific Market Value (USD Million) Forecast by Connectivity , 2020-2035
  • Table 27: South Asia and Pacific Market Value (USD Million) Forecast by End Use, 2020-2035
  • Table 28: South Asia and Pacific Market Value (USD Million) Forecast by Product Type, 2020-2035
  • Table 29: Middle East & Africa Market Value (USD Million) Forecast by Country, 2020-2035
  • Table 30: Middle East & Africa Market Value (USD Million) Forecast by Connectivity , 2020-2035
  • Table 31: Middle East & Africa Market Value (USD Million) Forecast by End Use, 2020-2035
  • Table 32: Middle East & Africa Market Value (USD Million) Forecast by Product Type, 2020-2035

List of Figures

  • Figure 1: Global Market Pricing Analysis
  • Figure 2: Global Market Value (USD Million) Forecast 2020-2035
  • Figure 3: Global Market Value Share and BPS Analysis by Connectivity , 2025 and 2035
  • Figure 4: Global Market Y-o-Y Growth Comparison by Connectivity , 2025-2035
  • Figure 5: Global Market Attractiveness Analysis by Connectivity
  • Figure 6: Global Market Value Share and BPS Analysis by End Use, 2025 and 2035
  • Figure 7: Global Market Y-o-Y Growth Comparison by End Use, 2025-2035
  • Figure 8: Global Market Attractiveness Analysis by End Use
  • Figure 9: Global Market Value Share and BPS Analysis by Product Type, 2025 and 2035
  • Figure 10: Global Market Y-o-Y Growth Comparison by Product Type, 2025-2035
  • Figure 11: Global Market Attractiveness Analysis by Product Type
  • Figure 12: Global Market Value (USD Million) Share and BPS Analysis by Region, 2025 and 2035
  • Figure 13: Global Market Y-o-Y Growth Comparison by Region, 2025-2035
  • Figure 14: Global Market Attractiveness Analysis by Region
  • Figure 15: North America Market Incremental Dollar Opportunity, 2025-2035
  • Figure 16: Latin America Market Incremental Dollar Opportunity, 2025-2035
  • Figure 17: Western Europe Market Incremental Dollar Opportunity, 2025-2035
  • Figure 18: Eastern Europe Market Incremental Dollar Opportunity, 2025-2035
  • Figure 19: East Asia Market Incremental Dollar Opportunity, 2025-2035
  • Figure 20: South Asia and Pacific Market Incremental Dollar Opportunity, 2025-2035
  • Figure 21: Middle East & Africa Market Incremental Dollar Opportunity, 2025-2035
  • Figure 22: North America Market Value Share and BPS Analysis by Country, 2025 and 2035
  • Figure 23: North America Market Value Share and BPS Analysis by Connectivity , 2025 and 2035
  • Figure 24: North America Market Y-o-Y Growth Comparison by Connectivity , 2025-2035
  • Figure 25: North America Market Attractiveness Analysis by Connectivity
  • Figure 26: North America Market Value Share and BPS Analysis by End Use, 2025 and 2035
  • Figure 27: North America Market Y-o-Y Growth Comparison by End Use, 2025-2035
  • Figure 28: North America Market Attractiveness Analysis by End Use
  • Figure 29: North America Market Value Share and BPS Analysis by Product Type, 2025 and 2035
  • Figure 30: North America Market Y-o-Y Growth Comparison by Product Type, 2025-2035
  • Figure 31: North America Market Attractiveness Analysis by Product Type
  • Figure 32: Latin America Market Value Share and BPS Analysis by Country, 2025 and 2035
  • Figure 33: Latin America Market Value Share and BPS Analysis by Connectivity , 2025 and 2035
  • Figure 34: Latin America Market Y-o-Y Growth Comparison by Connectivity , 2025-2035
  • Figure 35: Latin America Market Attractiveness Analysis by Connectivity
  • Figure 36: Latin America Market Value Share and BPS Analysis by End Use, 2025 and 2035
  • Figure 37: Latin America Market Y-o-Y Growth Comparison by End Use, 2025-2035
  • Figure 38: Latin America Market Attractiveness Analysis by End Use
  • Figure 39: Latin America Market Value Share and BPS Analysis by Product Type, 2025 and 2035
  • Figure 40: Latin America Market Y-o-Y Growth Comparison by Product Type, 2025-2035
  • Figure 41: Latin America Market Attractiveness Analysis by Product Type
  • Figure 42: Western Europe Market Value Share and BPS Analysis by Country, 2025 and 2035
  • Figure 43: Western Europe Market Value Share and BPS Analysis by Connectivity , 2025 and 2035
  • Figure 44: Western Europe Market Y-o-Y Growth Comparison by Connectivity , 2025-2035
  • Figure 45: Western Europe Market Attractiveness Analysis by Connectivity
  • Figure 46: Western Europe Market Value Share and BPS Analysis by End Use, 2025 and 2035
  • Figure 47: Western Europe Market Y-o-Y Growth Comparison by End Use, 2025-2035
  • Figure 48: Western Europe Market Attractiveness Analysis by End Use
  • Figure 49: Western Europe Market Value Share and BPS Analysis by Product Type, 2025 and 2035
  • Figure 50: Western Europe Market Y-o-Y Growth Comparison by Product Type, 2025-2035
  • Figure 51: Western Europe Market Attractiveness Analysis by Product Type
  • Figure 52: Eastern Europe Market Value Share and BPS Analysis by Country, 2025 and 2035
  • Figure 53: Eastern Europe Market Value Share and BPS Analysis by Connectivity , 2025 and 2035
  • Figure 54: Eastern Europe Market Y-o-Y Growth Comparison by Connectivity , 2025-2035
  • Figure 55: Eastern Europe Market Attractiveness Analysis by Connectivity
  • Figure 56: Eastern Europe Market Value Share and BPS Analysis by End Use, 2025 and 2035
  • Figure 57: Eastern Europe Market Y-o-Y Growth Comparison by End Use, 2025-2035
  • Figure 58: Eastern Europe Market Attractiveness Analysis by End Use
  • Figure 59: Eastern Europe Market Value Share and BPS Analysis by Product Type, 2025 and 2035
  • Figure 60: Eastern Europe Market Y-o-Y Growth Comparison by Product Type, 2025-2035
  • Figure 61: Eastern Europe Market Attractiveness Analysis by Product Type
  • Figure 62: East Asia Market Value Share and BPS Analysis by Country, 2025 and 2035
  • Figure 63: East Asia Market Value Share and BPS Analysis by Connectivity , 2025 and 2035
  • Figure 64: East Asia Market Y-o-Y Growth Comparison by Connectivity , 2025-2035
  • Figure 65: East Asia Market Attractiveness Analysis by Connectivity
  • Figure 66: East Asia Market Value Share and BPS Analysis by End Use, 2025 and 2035
  • Figure 67: East Asia Market Y-o-Y Growth Comparison by End Use, 2025-2035
  • Figure 68: East Asia Market Attractiveness Analysis by End Use
  • Figure 69: East Asia Market Value Share and BPS Analysis by Product Type, 2025 and 2035
  • Figure 70: East Asia Market Y-o-Y Growth Comparison by Product Type, 2025-2035
  • Figure 71: East Asia Market Attractiveness Analysis by Product Type
  • Figure 72: South Asia and Pacific Market Value Share and BPS Analysis by Country, 2025 and 2035
  • Figure 73: South Asia and Pacific Market Value Share and BPS Analysis by Connectivity , 2025 and 2035
  • Figure 74: South Asia and Pacific Market Y-o-Y Growth Comparison by Connectivity , 2025-2035
  • Figure 75: South Asia and Pacific Market Attractiveness Analysis by Connectivity
  • Figure 76: South Asia and Pacific Market Value Share and BPS Analysis by End Use, 2025 and 2035
  • Figure 77: South Asia and Pacific Market Y-o-Y Growth Comparison by End Use, 2025-2035
  • Figure 78: South Asia and Pacific Market Attractiveness Analysis by End Use
  • Figure 79: South Asia and Pacific Market Value Share and BPS Analysis by Product Type, 2025 and 2035
  • Figure 80: South Asia and Pacific Market Y-o-Y Growth Comparison by Product Type, 2025-2035
  • Figure 81: South Asia and Pacific Market Attractiveness Analysis by Product Type
  • Figure 82: Middle East & Africa Market Value Share and BPS Analysis by Country, 2025 and 2035
  • Figure 83: Middle East & Africa Market Value Share and BPS Analysis by Connectivity , 2025 and 2035
  • Figure 84: Middle East & Africa Market Y-o-Y Growth Comparison by Connectivity , 2025-2035
  • Figure 85: Middle East & Africa Market Attractiveness Analysis by Connectivity
  • Figure 86: Middle East & Africa Market Value Share and BPS Analysis by End Use, 2025 and 2035
  • Figure 87: Middle East & Africa Market Y-o-Y Growth Comparison by End Use, 2025-2035
  • Figure 88: Middle East & Africa Market Attractiveness Analysis by End Use
  • Figure 89: Middle East & Africa Market Value Share and BPS Analysis by Product Type, 2025 and 2035
  • Figure 90: Middle East & Africa Market Y-o-Y Growth Comparison by Product Type, 2025-2035
  • Figure 91: Middle East & Africa Market Attractiveness Analysis by Product Type
  • Figure 92: Global Market - Tier Structure Analysis
  • Figure 93: Global Market - Company Share Analysis
Dashboard
Dashboard
Dashboard
Dashboard
Dashboard
Dashboard

Full Research Suite comprises of:

Market outlook & trends analysis

Market outlook & trends analysis

Interviews & case studies

Interviews & case studies

Strategic recommendations

Strategic recommendations

Vendor profiles & capabilities analysis

Vendor profiles & capabilities analysis

5-year forecasts

5-year forecasts

8 regions and 60+ country-level data splits

8 regions and 60+ country-level data splits

Market segment data splits

Market segment data splits

12 months of continuous data updates

12 months of continuous data updates

DELIVERED AS:

PDF EXCEL ONLINE

Full Research Suite


$5000

$7500

$10000

Buy Report Now
Similar Industry Reports

Similar Industry Reports

Computer Keyboard Market

Computer Keyboard Market Size and Share Forecast Outlook 2025 to 2035

Computer Aided Facility Management (CAFM) Market

Computer Aided Facility Management (CAFM) Market Size and Share Forecast Outlook 2025 to 2035

Computerized Physician Order Entry (CPOE) Market

Computerized Physician Order Entry (CPOE) Market Size and Share Forecast Outlook 2025 to 2035

Computer Keyboard Industry Analysis in East Asia

Computer Keyboard Industry Analysis in East Asia Size and Share Forecast Outlook 2025 to 2035

Computer Graphics Market

Computer Graphics Market Size and Share Forecast Outlook 2025 to 2035

Computer-Aided Design (CAD) Market

Computer-aided Design (CAD) Market Analysis - Size, Share, & Forecast Outlook 2025 to 2035

Computer Microchips Market

Computer Microchips Market Size and Share Forecast Outlook 2025 to 2035

Computer-aided Engineering Market

Computer-aided Engineering Market Analysis - Size, Share, and Forecast 2025 to 2035

Computerized Maintenance Management Systems (CMMS) Market

Computerized Maintenance Management Systems (CMMS) Market Trends – Size, Share & Growth 2025–2035

Computer Assisted Coding Software Market

Computer Assisted Coding Software Market Analysis by Solution, Deployment, Application, and Region Through 2035

Computer Vision Market

Computer Vision Market Insights – Trends & Forecast 2025 to 2035

Computer Vision in Healthcare Market

Global Computer Vision in Healthcare Market Insights – Trends & Forecast 2024-2034

Computer Aided Trauma Fixators Market

Computer Aided Trauma Fixators Market

Computer-To-Plate And Computer-To-Press Systems Market

Computer-To-Plate And Computer-To-Press Systems Market

Flow Computer Market

Flow Computer Market Size and Share Forecast Outlook 2025 to 2035

Dive Computer Market

Dive Computer Market Growth – Industry Trends & Forecast 2024-2034

Brain Computer Interface Implant Market

Brain-Computer Interface Implant Market Analysis Size and Share Forecast Outlook 2025 to 2035

Refurbished Computers and Laptops Market

Refurbished Computers and Laptops Market Analysis - Size, Share, & Forecast Outlook 2025 to 2035

Single Board Computer Market

Single Board Computer Market Size and Share Forecast Outlook 2025 to 2035

Healthcare AI Computer Vision Market

Healthcare AI Computer Vision Market Size and Share Forecast Outlook 2025 to 2035

Future Market Insights

Computer Peripherals Market

Chat With MaRIA

Chat With

MaRIA

Hi There, I am MaRIA, Your Market Research Intelligence Assistant. How may I help you?