This site uses cookies, including third-party cookies, that help us to provide and improve our services.

Privacy Policy
- Global Locations -
Headquarters
Future Market Insights, Inc.
Christiana Corporate, 200 Continental Drive, Suite 401, Newark, Delaware - 19713, United States
T: +1-845-579-5705
MEA
Market Access DMCC

1602-6 Jumeirah Bay X2 Tower, Plot No: JLT-PH2-X2A,

Jumeirah Lakes Towers, Dubai,

United Arab Emirates

Americas
Future Market Insights
616 Corporate Way, Suite 2-9018,
Valley Cottage, NY 10989,
United States
T: +1-347-918-3531
Europe
Future Market Insights
3rd Floor, 207 Regent Street,
London W1B 3HH
United Kingdom
T: + 44 (0) 20 8123 9659
D: +44 (0) 20 3287 4268
APAC
Future Market Insights
Office No. 401-A, 4th Floor,
VANTAGE 9, S.No. 36/1/1,
Baner, Pune 411045 India

Computer Graphics Market

Market Insights on Computer Graphics covering sales outlook, demand forecast & up-to-date key trends

Computer Graphics Market by Component, Application & Region - Forecast 2022 - 2032

Computer Graphics Market Outlook (2022-2032)

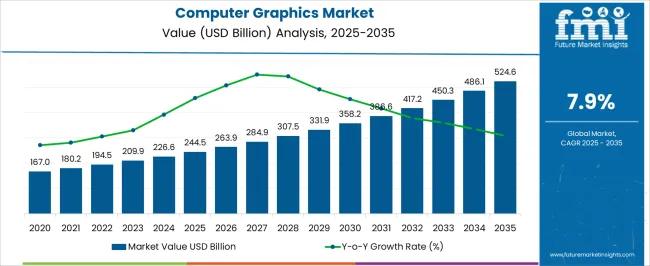
[299 Pages Report] The global computer graphics market size was valued at US$ 178.7 Million in 2021 and is projected to grow at a compound annual growth rate of 8% reaching US$ 406.3 Million by 2032, up from US$ 188.9 Million in 2022.

Increasing demand for computer graphics in the entertainment industry is recognized as one of the major factors expected to drive market growth in the long run. Increasing demand for 3D animations and 3D movies is growing the market for computer graphics and is expected to boost the market growth in future years.

"A growth in the graphic software business, entertainment businesses along with the increasing use of smartphones is expected to generate global market growth for computer graphics in the future."

Attributes

Details

Computer Graphics CAGR (2022-2032)

8%

Computer Graphics Market (2032)

US$ 406.3 Million

Computer Graphics Market Attraction

Additionally, the development of animated visual content in Science fiction movies, animated films, games, and other media and the demand for graphics software in business processes and for implementing the technology for developing interactive content will further impact the market.

A multitude of opportunities for computer graphics players are anticipated to exist during the assessment period in light of the growing dependency on computers in almost all vertical industries. Throughout the next few years, advances in computer programming and the expansion of applications for computer graphics will create a solid basis for growth. Eventually, 3D printing and augmented reality will be able to lift graphic design to new heights in future markets.

As 3D printing becomes more popular, designers will be forced to keep track of industry trends and move at a faster pace. With the advent of this technology, people will demand faster services as they expect quality designs to become readily available to them as quickly as possible.

Over the past few years, both interactive computer graphics, as well as non-interactive computer graphics have seen consistent growth, and current estimates indicate that this trend will continue going forward.

As a result of COVID-19, artificial intelligence, data centers, and software technologies have expanded exponentially in businesses, governments, and academic institutions. In 2020, the occurrence of COVID-19 outbreaks and spread has been a significant influence on computer graphics, which led to positive growth in the market. Video games have proven to be more resilient to the pandemic than many other sectors that have been negatively affected.

The vast majority of video game publishers, developers, and operators have managed to sustain game development and digital releases without having to hire more employees, but some productivity problems have cropped up.

In an era when many people are at home without the ability to work, online gaming has gained popularity as an alternative to physical separation from society during the pandemic, a strategy that is strongly recommended by the WHO and which has led to a rise in revenue for many gaming companies.

Gaming And Entertainment Industry Adoption To Drive Computer Graphics Market Growth?

In recent years, 3D computer graphics has played a vital role in changing the nature of computer graphics and these new trends have quickly revolutionized the market. A wide variety of applications are being used to make use of computer graphics across filmmaking, such as for the creation of characters, the addition of special effects, etc.

Furthermore, improvements in the technology behind computers is another leading influence that is likely to enhance demand for computer graphics in the entertainment sector for the creation of fully functional imagery models.

Among the main factors contributing to the growth of the computer graphics market is the growth of the internet across the globe. As computers become more embedded in everything from building & construction to defense, automotive, oil & gas, aerospace, and packaging, the market is set to grow strongly for computer graphics in the market.

Computer Graphics Market Download Report Brochure

Moreover, the massive amount of data being generated, the expansion of the Internet of things, have contributed to the high demand for computer graphics in the market. Increasing digitization, the emergence of smart mobiles, and the growth of computer graphics applications are things that have been shown to contribute to the growth and development of the computer graphics market.

The advent of 3D printing computer graphics and advancements in computer programming will open up more lucrative markets for market players in the forecast period of 2022 to 2032.

Customize this Report

Let us know your requirement to get
100% FREE customization

What Are Some Of The Challenges In The Computer Graphics Market?

Equipment and programming are necessary for computer graphics effects. Incorporating new 3D equipment and programming into old hardware and software processes is costly, which can stifle the growth of the computer graphics industry.

A decline in interest has been observed in the market for continuous real-time animations and enhanced videos and graphics. The media industry's expansion was accompanied by an increase in membership fees, which has caused a decline in the market.

Due to the growing cost of the most advanced innovations for more enhanced visual effects for the video, the market has experienced a decline in demand for these innovative products. Interactive or non-interactive computer graphics cannot comprehend real-world situations because they lack intelligence.

This prevents them from acting according to the underlying principles of reality. The objective of designing requires users to learn graphical software. This will further hinder the growth of the computer graphics market.

Comparative View Of Computer Graphics Market

Computer Graphics Market:

Attributes

Computer Graphics Market

CAGR(2022-2032)

8%

Market Value (2024)

US$ 211.6 Million

Growth Factor

Increasing demand from the entertainment industry for computer graphics is expected to take a big part in driving market growth in the future.

Opportunity

With the advent of e-sports and games as a service, which use 3D animation and image processing technology, the number of online game players has increased over time, and a way to develop new games has been provided an opportunity to the market for computer graphics software.

Key Trends

With the increasingly large number of internet-connected devices used by individuals and businesses, and the growing role of VFX in e-commerce, it is anticipated that future markets will grow significantly.

Hardware Market:

Attributes

Hardware Market

CAGR(2022-2032)

7.9%

Market Value (2024)

US$ 159.5 Million

Growth Factor

Hardware components are in high demand as advanced technologies and systems that integrate artificial intelligence are becoming more common in the market.

Opportunity

Due to the growing popularity of gadgets and new innovative technologies, it will become possible for consumer-focused e-electronics to create new opportunities in the computer graphics market.


Key Trends

As consumers get more familiar with high-end smartphones, as well as computer devices for UI and UX design applications, with which a substantial amount of growth is expected in the market over the course of the next few years.

Entertainment (3D/Animated/VFX) Market:

Attributes

Entertainment (3D/Animated/VFX) Market

CAGR(2022-2032)

8.2%

Market Value (2024)

 US$ 112 Million

Growth Factor

With the rapid growth of 3D entertainment industry in the market, the increased demand for computer graphics has propelled market demand in the market.

Opportunity

With the increasing demand for animated movies, educational videos, and video games in the market, entertainment industry will have 3D printed or 3D image viewing opportunities in the future.

Key Trends

There has been a noticeable increase in the popularity of online advertising platforms, social media apps, and entertainment apps with high-end visual effects in smartphones recently, which, in turn, drive the e-commerce and entertainment market to impressive growth rates.

Growing consumer interest in strengthening the digital presence of the business and rising awareness about the potential benefits of providing visual interest to the website will likely generate growth for the global computer graphics market in the years to come.

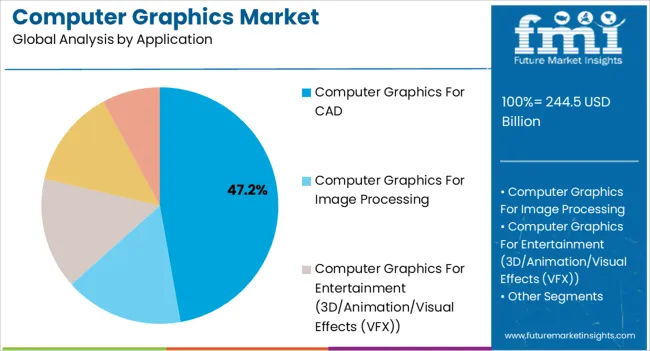
The global computer graphics market is also expected to grow exponentially in the next few years owing to increasing applications of computer graphics in CAD, digital imaging, and user interfaces.

Consumers expect that irrespective of the industry, a website selling merchandise online should make it easy for them to compare products, evaluate them, and make a purchase. As a result, consumers expect online stores to be accessible via virtual imaging platforms, which is why the demand for computer graphics in the market is growing rapidly.

Brands should curate content that incorporates large amounts of e-commerce to increase brand visibility. The visuals that are used to showcase each product should be able to provide complete and granular information about the product in addition to engaging and converting visitors to the website.

China and India has the biggest media and entertainment industry in the market. As a result, the computer graphics market in this region boomed. Population growth, the rapid growth of the e-commerce industry, and smartphone use are the main factors driving the growth of the industry. China's market is continuing to experience double-digit growth as a result of enhanced connectivity and the advancement of the media advertisement industry.

Sudip Saha
Sudip Saha
Principal Consultant
LinkedIn
Talk to Analyst

Find your sweet spots for generating winning opportunities in this market.

Talk to Analyst

How Do Hardware Components Stimulate Market Growth In Computer Graphics?

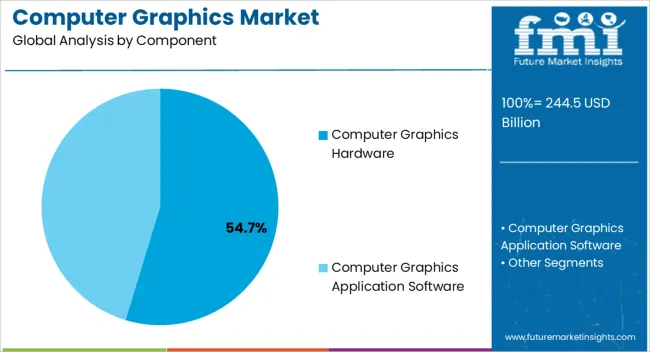
In the next few years, hardware components are expected to enjoy a CAGR of 7.9%, which makes it the most dominant segment of the global computer graphics market. The trend of the market growth for graphic cards, displaying drivers, and other hardware components in the graphics industry has stimulated the market for computer graphics in the market.

In terms of revenue, the hardware graphics market is projected to reach a value of US$ 306.3 Million by 2032. With the demand for high-speed and quality graphics games in the market, the demand for hardware graphics is growing considerably in the market.

With the growing demand for web and mobile applications that feature intense UI and UX designs, highly skilled graphic designers and significantly increased hardware demand, the market is expected to see significant growth in the coming years.  

What Is The Impact Of Entertainment (3D/Animation/Visual Effects (VFX)) On The Computer Graphics Markets?

Increasing image processing and 3D animation effects in the entertainment and media industries are contributing to the growth of the computer graphics market. Growing the prevalence of smartphones and tablets, online games have become widely accessible and have grown in popularity.

With this trend came the emergence of a massive number of free video games, which opened up a whole new market for those working in the computer graphics industry. Moreover, independent game developers are joining forces with larger entertainment firms in order to expand the number of games available on the market.

According to market research, the entertainment market for computer graphics is expected to reach a CAGR of 8.2% over the forecast period. With the increasing influence of artificial intelligence, virtual and augmented reality, e-commerce, and digital technology, the entertainment industry is undergoing significant changes.

With the introduction of digital technology, a fundamental shift has occurred in the way to which consumers view images and videos on a screen. Consumers are using new innovations to engage with brands in unique and engaging ways, as well as captivate customers and create innovative experiences.

In the entertainment industry, there are a number of future trends including 3D flicks and short animated films, which are poised to further propel computer graphics market demand. In addition to the advancements in technology for VFX games in the market, there is an increasing demand for live experiences of places and events, which makes computer graphics games increasingly popular in the market.

MarketNage
Become a MarketNgage Insider

A unified Market Research Subscription Platform, built for today's disparate research needs.

How Are The Various Regional Dynamics Influencing The Popularity Of Computer Graphics In The Market?

Over the forecast period, the Asia-Pacific region is expected to dominate the computer graphics market. Increasing adoption of technology in the entertainment and media sector can stimulate the market for computer graphics to grow in the coming years.

China is expected to grow at a 9.5% CAGR during the forecast period. Meanwhile, India is expected to expand at a 9.1% compound annual market growth in the region. The market for media on mobile has grown rapidly as Internet penetration, advances in technology, and the proliferation of mobile devices, as well as the growing number of VFX games with their technologically advanced graphics, have all contributed to the development of this market.

This region is highly embracing computer graphics, especially in the media and entertainment sectors. This is expected to fuel the growth of the global market in the coming years. The use of computer graphics by countries such as China and India has increased in recent years, largely because of the growth of the entertainment industry in these countries.

Over the forecast period, Japan is projected to achieve a CAGR of 9% in 2032. The growing popularity of digital technologies and the prevalence of 3D games on the market, this is driving the market demand for computer graphics. The market for computers graphics in Japan is expected to reach a market value of US$ 8.8 Million during the forecast period.

In the U.S, the computer graphics market is expected to grow at a CAGR of 7.7% during the forecast period of 2022-2032. A growing presence of major companies in this region, including Walt Disney Animation Studios, Warner Bros Animation, and DreamWorks Animation are propelling market demand for computer graphics in the market.

Furthermore, the region serves as a center for vendors who produce computer graphics hardware components and applications software, including Adobe Systems Inc., Autodesk Inc., Siemens PLM Software, Microsoft Corporation, etc. Moreover, the significant growth of the computer graphics market in the region has been attributed to the existence of government programs that support the film entertainment industry in the market.

During the forecast period, the computer graphics market in the UK is expected to grow at a compound annual growth rate of 7.6%. The increasing presence of manufacturers of computer hardware components in this region has boosted market growth for computer graphics.

Furthermore, technological advances in GPUs are expected to boost the growth of the market in the region. In addition, the growth of smart TVs and the surge in demand for video games are driving the growth and expansion of computer graphics in the market.
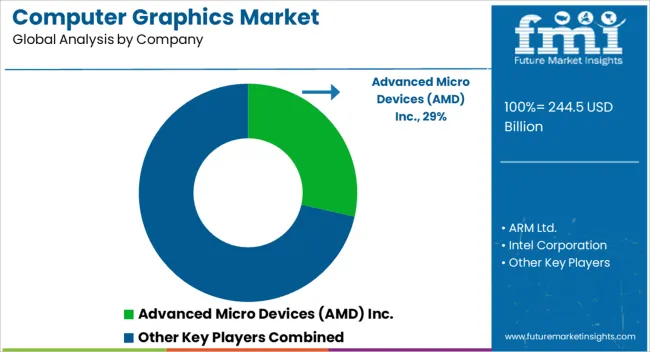
What Is The Level Of Competition For Computer Graphics In The Market?

Through strategic partnerships, manufacturers can increase production and meet consumer demand, increasing both their revenues and market share. The introduction of new products and technologies will allow end-users to reap the benefits of new technologies. Increasing the company's production capacity is one of the potential benefits of a strategic partnership.

Recent Developments In The Computer Graphics Market

  • A definitive agreement was signed between Qualcomm Incorporated and Qualcomm Technologies, Inc. in January 2021 for Qualcomm Technologies to acquire NUVIA for approximately $1.4 billion including expenses and working capital. In addition to customary closing conditions, the transaction must receive regulatory approval under Hart-Scott-Rodino Antitrust Improvements Act of 1976, as amended. In acquiring NUVIA, Qualcomm Technologies builds on its leadership in Snapdragon-based technology, offering a step-change improvement in CPU performance and power efficiency in order to meet the demands of the upcoming 5G era.
  • In November 2021, Threekit, the leading 3D visual commerce platform for brands, raised $35 million in Series B funding from Leaders Fund, alongside strategic investors Capgemini and ServiceNow and existing investors Salesforce and Shasta Ventures. Through this investment, Threekit can accelerate investments in product platform, eCommerce integration, global sales organization, and partner network.
  • In February 2022, AMD announced that it had acquired Xilinx in an all-stock transaction. As a result of the acquisition, announced on October 27, 2020, the company established itself as the industry's leading high-performance and adaptive computing player, with a substantial scale advantage and the strongest portfolio of leading computing, graphics, and adaptive SoC products. AMD expects the acquisition to be accretive to non-GAAP margins, non-GAAP EPS and free cash flow generation in the first year. By acquiring Xilinx, NXP will be able to create the industry's leading high-performance and adaptive computing company by putting together complementary products, customers, and markets.
  • In February 2022, AMD announced the launch of next-generation RDNA GPUs later this year. With the implementation of their current products and the launch of their next wave of Zen 4 CPUs and RDNA 3 GPUs, the company is looking forward to another year of significant growth and share gains. The launch date of AMD's RDNA 3 GPU was not provided. However, the products are likely to arrive in the fall, two years after the Radeon 6000 series debuted.
  • In March 2022,  Intel launched Intel Arc, a new graphics technology that aims to compete with Nvidia and AMD as part of its own website and featured a video previewing the first graphics card in the series that will be released in 2022. With the announcement of the first Intel Arc graphics cards in late March 2022, Intel kept its word. Intel's first graphics-enabled laptops bring gaming prowess to ultrabooks, including desktop cards in development.

Key Players

Key Segments Covered In The Computer Graphics Market Report

Computer Graphics by Component:

  • Computer Graphics Hardware
  • Computer Graphics Application software

Computer Graphics by Application:

  • Computer Graphics for CAD
  • Computer Graphics for Image Processing
  • Computer Graphics for Entertainment (3D/Animation/Visual Effects (VFX))
  • Computer Graphics for User Interfaces
  • Computer Graphics for Other Applications (Education Graphics, etc.)

Computer Graphics by Region:

  • North America Computer Graphics Market
  • Europe Computer Graphics Market
  • Asia Pacific (APAC) Computer Graphics Market
  • Middle East and Africa (MEA) Computer Graphics Market
  • South America Computer Graphics Market

Frequently Asked Questions

The Computer Graphics market is expected to grow at a steady CAGR of 8% over the forecast period.

The global market for Computer Graphics was valued at US$ 178.7 Million in 2021

Hardware is projected to have the highest market with a CAGR of 7.9% during the forecast period

China leads the global Computer Graphics market with a CAGR of 9.5% during the forecast period.

The market for Computer Graphics is expected to grow by nearly US$ 406.3 Million by 2032.

The entertainment (3D/animated/visual effects (VFX)) segment is expected to grow at a CAGR of more than 8.2% over the next five years.

The rapidly growing 3D movie industry, VFX gaming and visual facilities, and advertising industries drive the growth of the computer graphics market.

Table of Content

1. Preface

    1.1. Report Scope and Market Segmentation

    1.2. Research Highlights

2. Assumptions and Research Methodology

3. Executive Summary: Computer Graphics Market

4. Computer Graphics Market Overview

    4.1. Introduction

        4.1.1. Key Industry Developments

    4.2. Market Dynamics

        4.2.1. Drivers

        4.2.2. Restraints

        4.2.3. Opportunities

    4.3. Global Computer Graphics Market Analysis and Forecasts, 2022 – 2032

    4.4. Global VFX Industry Analysis

        4.4.1. Key Technology Trends

        4.4.2. Key Challenges

        4.4.3. Opportunities, By Region

        4.4.4. Global VFX Industry Market Size and Growth Rate, 2021 (US$ Mn)

        4.4.5. Production Cost of VFX

        4.4.6. Key VFX Technology Tool Providers

        4.4.7. Major Global VFX Players and Gross Earning/Sales

    4.5. Porter’s Five Force Analysis

    4.6. Ecosystem Analysis: Computer Graphics market

    4.7. Market Outlook

    4.8. Key Findings

5. Global Computer Graphics Market Analysis and Forecast, by Component

    5.1. Introduction & Definition

    5.2. Global Computer Graphics Market Size (US$ Mn) and Forecast, by Component, 2022 – 2032

        5.2.1. Hardware

        5.2.2. Application software

    5.3. Component Comparison Matrix

    5.4. Market Value Share & Market Attractiveness, by Component

6. Global Computer Graphics Market Analysis and Forecast, by Application

    6.1. Introduction & Definition

    6.2. Global Computer Graphics Market Size (US$ Mn) and Forecast, by Application, 2022 – 2032

        6.2.1. CAD

        6.2.2. Image Processing

        6.2.3. Entertainment (3D/Animation/Visual Effects (VFX))

        6.2.4. User Interfaces

        6.2.5. Others (Education Graphics, etc.)

    6.3. Application Comparison Matrix

    6.4. Market Value Share & Market Attractiveness, by Application

7. Global Computer Graphics Market Analysis and Forecast by Region

    7.1. Global Computer Graphics Market Size (US$ Mn) and Forecast by Region, 2022 – 2032

        7.1.1. North America

        7.1.2. Europe

        7.1.3. Asia Pacific

        7.1.4. Middle East and Africa

        7.1.5. South America

    7.2. Region Comparison Matrix

    7.3. Market Value Share & Market Attractiveness by Region

8. North America Computer Graphics Market Analysis, 2022 – 2032 (US$ Mn)

    8.1. Key Findings

    8.2. North America Computer Graphics Market Analysis, by Component, 2022 – 2032 (US$ Mn)

        8.2.1. Hardware

        8.2.2. Application software

    8.3. North America Computer Graphics Market Analysis, by Application, 2022 – 2032 (US$ Mn)

        8.3.1. CAD

        8.3.2. Image Processing

        8.3.3. Entertainment (3D/Animation/Visual Effects (VFX))

        8.3.4. User Interfaces

        8.3.5. Others (Education Graphics, etc.)

    8.4. North America Computer Graphics Market Analysis, by Country, 2022 – 2032 (US$ Mn)

        8.4.1. The U.S.

        8.4.2. Canada

        8.4.3. Rest of North America

    8.5. Market Value Share Analysis

        8.5.1. By Country

        8.5.2. By Component

        8.5.3. By Application

    8.6. Market Attractiveness Analysis

        8.6.1. By Country

        8.6.2. By Component

        8.6.3. By Application

9. Europe Computer Graphics Market Analysis, 2022 – 2032 (US$ Mn)

    9.1. Key Findings

    9.2. Europe Computer Graphics Market Analysis, by Component, 2022 – 2032 (US$ Mn)

        9.2.1. Hardware

        9.2.2. Application software

    9.3. Europe Computer Graphics Market Analysis, by Application, 2022 – 2032 (US$ Mn)

        9.3.1. CAD

        9.3.2. Image Processing

        9.3.3. Entertainment (3D/Animation/Visual Effects (VFX))

        9.3.4. User Interfaces

        9.3.5. Others (Education Graphics, etc.)

    9.4. Europe Computer Graphics Market Analysis, by Country, 2022 – 2032 (US$ Mn)

        9.4.1. Germany

        9.4.2. France

        9.4.3. UK

        9.4.4. Italy

        9.4.5. Spain

        9.4.6. Rest of Europe

    9.5. Market Share Analysis

        9.5.1. By Country

        9.5.2. By Component

        9.5.3. By Application

    9.6. Market Attractiveness Analysis

        9.6.1. By Country

        9.6.2. By Component

        9.6.3. By Application

10. Asia Pacific (APAC) Computer Graphics Market Analysis, 2022 – 2032 (US$ Mn)

    10.1. Key Findings

    10.2. Asia Pacific Computer Graphics Market Analysis, by Component, 2022 – 2032 (US$ Mn)

        10.2.1. Hardware

        10.2.2. Application software

    10.3. Asia Pacific Computer Graphics Market Analysis, by Application, 2022 – 2032 (US$ Mn)

        10.3.1. CAD

        10.3.2. Image Processing

        10.3.3. Entertainment (3D/Animation/Visual Effects (VFX))

        10.3.4. User Interfaces

        10.3.5. Others (Education Graphics, etc.)

    10.4. Asia Pacific Computer Graphics Market Analysis, by Country, 2022 – 2032 (US$ Mn)

        10.4.1. China

        10.4.2. India

        10.4.3. Japan

        10.4.4. Australia

        10.4.5. Rest of APAC

    10.5. Market Share Analysis

        10.5.1. By Country

        10.5.2. By Component

        10.5.3. By Application

    10.6. Market Attractiveness Analysis

        10.6.1. By Country

        10.6.2. By Component

        10.6.3. By Application

11. Middle-East and Africa (MEA) Computer Graphics Market Analysis, 2022 – 2032 (US$ Mn)

    11.1. Key Findings

    11.2. Middle East and Africa Computer Graphics Market Analysis, By Component, 2022 – 2032 (US$ Mn)

        11.2.1. Hardware

        11.2.2. Application software

    11.3. Middle East and Africa Computer Graphics Market Analysis, by Application, 2022 – 2032 (US$ Mn)

        11.3.1. CAD

        11.3.2. Image Processing

        11.3.3. Entertainment (3D/Animation/Visual Effects (VFX))

        11.3.4. User Interfaces

        11.3.5. Others (Education Graphics, etc.)

    11.4. MEA Computer Graphics Market Analysis, by Country, 2022 – 2032 (US$ Mn)

        11.4.1. UAE

        11.4.2. Saudi Arabia

        11.4.3. South Africa

        11.4.4. Rest of MEA

    11.5. Market Share Analysis

        11.5.1. By Country

        11.5.2. By Component

        11.5.3. By Application

    11.6. Market Attractiveness Analysis

        11.6.1. By Country

        11.6.2. By Component

        11.6.3. By Application

12. South America Computer Graphics Market Analysis, 2022 – 2032 (US$ Mn)

    12.1. Key Findings

    12.2. South America Computer Graphics Market Analysis, by Component, 2022 – 2032 (US$ Mn)

        12.2.1. Hardware

        12.2.2. Application software

    12.3. South America Computer Graphics Market Analysis, by Application, 2022 – 2032 (US$ Mn)

        12.3.1. CAD

        12.3.2. Image Processing

        12.3.3. Entertainment (3D/Animation/Visual Effects (VFX))

        12.3.4. User Interfaces

        12.3.5. Others (Education Graphics, etc.)

    12.4. South America Computer Graphics Market Analysis, by Country, 2022 – 2032 (US$ Mn)

        12.4.1. Brazil

        12.4.2. Rest of South America

    12.5. Market Share Analysis

        12.5.1. By Country

        12.5.2. By Component

        12.5.3. By Application

    12.6. Market Attractiveness Analysis

        12.6.1. By Country

        12.6.2. By Component

        12.6.3. By Application

13. Competition Landscape

    13.1. Market Player – Competition Matrix

    13.2. Market Share Analysis by Company (2021)

    13.3. Company Profiles

        13.3.1. Advanced Micro Devices (AMD), Inc.

            13.3.1.1. Company Details (HQ, Foundation Year, Employee Strength)

            13.3.1.2. Market Presence, By Segment

            13.3.1.3. Strategy

            13.3.1.4. Revenue and Operating Profits

            13.3.1.5. SWOT Analysis

        13.3.2. ARM Ltd.

            13.3.2.1. Company Details (HQ, Foundation Year, Employee Strength)

            13.3.2.2. Market Presence, By Segment

            13.3.2.3. Strategy

            13.3.2.4. Revenue and Operating Profits

            13.3.2.5. SWOT Analysis

        13.3.3. Intel Corporation

            13.3.3.1. Company Details (HQ, Foundation Year, Employee Strength)

            13.3.3.2. Market Presence, By Segment

            13.3.3.3. Strategy

            13.3.3.4. Revenue and Operating Profits

            13.3.3.5. SWOT Analysis

        13.3.4. Imagination Technologies Limited

            13.3.4.1. Company Details (HQ, Foundation Year, Employee Strength)

            13.3.4.2. Market Presence, By Segment

            13.3.4.3. Strategy

            13.3.4.4. Revenue and Operating Profits

            13.3.4.5. SWOT Analysis

        13.3.5. NVIDIA Corporation

            13.3.5.1. Company Details (HQ, Foundation Year, Employee Strength)

            13.3.5.2. Market Presence, By Segment

            13.3.5.3. Strategy

            13.3.5.4. Revenue and Operating Profits

            13.3.5.5. SWOT Analysis

        13.3.6. Sony Corporation

            13.3.6.1. Company Details (HQ, Foundation Year, Employee Strength)

            13.3.6.2. Market Presence, By Segment

            13.3.6.3. Strategy

            13.3.6.4. Revenue and Operating Profits

            13.3.6.5. SWOT Analysis

        13.3.7. Adobe Systems Ltd.

            13.3.7.1. Company Details (HQ, Foundation Year, Employee Strength)

            13.3.7.2. Market Presence, By Segment

            13.3.7.3. Strategy

            13.3.7.4. Revenue and Operating Profits

            13.3.7.5. SWOT Analysis

        13.3.8. Siemens PLM Software

            13.3.8.1. Company Details (HQ, Foundation Year, Employee Strength)

            13.3.8.2. Market Presence, By Segment

            13.3.8.3. Strategy

            13.3.8.4. Revenue and Operating Profits

            13.3.8.5. SWOT Analysis

        13.3.9. Autodesk Inc.

            13.3.9.1. Company Details (HQ, Foundation Year, Employee Strength)

            13.3.9.2. Market Presence, By Segment

            13.3.9.3. Strategy

            13.3.9.4. Revenue and Operating Profits

            13.3.9.5. SWOT Analysis

        13.3.10. Microsoft Corporation

            13.3.10.1. Company Details (HQ, Foundation Year, Employee Strength)

            13.3.10.2. Market Presence, By Segment

            13.3.10.3. Strategy

            13.3.10.4. Revenue and Operating Profits

            13.3.10.5. SWOT Analysis

        13.3.11. Dassault Systems SA

            13.3.11.1. Company Details (HQ, Foundation Year, Employee Strength)

            13.3.11.2. Market Presence, By Segment

            13.3.11.3. Strategy

            13.3.11.4. Revenue and Operating Profits

            13.3.11.5. SWOT Analysis

14. Key Takeaways
Customize this Report

Let us know your requirement to get
100% FREE customization

List of Tables

Table 1: Movie – Average Estimated Production Cost/Shot

Table 2: 3D Animated Movie – Average Estimated Production Cost/Second

Table 3: Key Players

Table 4: Key Players

Table 5: Global Computer Graphics Market Revenue (US$ Mn) Forecast and CAGR, by Component, 2022–2032

Table 6: Global Computer Graphics Market Size (US$ Mn) Forecast and CAGR, by Application, 2022 – 2032

Table 7: Global Computer Graphics Market Revenue (US$ Mn) Forecast and CAGR, by Region, 2022–2032

Table 8: North America Computer Graphics Market Revenue (US$ Mn) Forecast and CAGR, by Component, 2022–2032

Table 9: North America Computer Graphics Market Revenue (US$ Mn) Forecast and CAGR, by Application, 2022–2032

Table 10: North America Computer Graphics Market Revenue (US$ Mn) Forecast and CAGR, by Country, 2022 – 2032

Table 11: Europe Computer Graphics Market Revenue (US$ Mn) Forecast and CAGR, by Component, 2022–2032

Table 12: Europe Computer Graphics Market Size (US$ Mn) Forecast and CAGR, by Application, 2022–2032

Table 13: Europe Computer Graphics Market Revenue (US$ Mn) Forecast and CAGR, by Country, 2022 – 2032

Table 14: Asia Pacific Computer Graphics Market Revenue (US$ Mn) Forecast and CAGR, by Component, 2022–2032

Table 15: Asia Pacific Computer Graphics Market Revenue (US$ Mn) Forecast and CAGR, by Application, 2022–2032

Table 16: Asia Pacific Computer Graphics Market Revenue (US$ Mn) Forecast and CAGR, by Country, 2022 – 2032

Table 17: Middle East and Africa Computer Graphics Market Revenue (US$ Mn) Forecast and CAGR, by Component, 2022–2032

Table 18: Middle East and Africa Computer Graphics Market Revenue (US$ Mn) Forecast and CAGR, by Application, 2022–2032

Table 19: Middle East & Africa Computer Graphics Market Revenue (US$ Mn) Forecast and CAGR, by Country, 2022 – 2032

Table 20: South America Computer Graphics Market Revenue (US$ Mn) Forecast and CAGR, by Component, 2022–2032

Table 21: South America Computer Graphics Market Revenue (US$ Mn) Forecast and CAGR, by Application, 2022–2032

Table 22: South America Computer Graphics Market Revenue (US$ Mn) Forecast and CAGR, by Country, 2022 – 2032
Sudip Saha
Principal Consultant
LinkedIn
Talk to Analyst

Find your sweet spots for generating winning opportunities in this market.

Talk to Analyst

List of Charts

Figure 01: Global Computer Graphics Market - Share Analysis

Figure 02: Global Computer Graphics Market Share, By Region, 2021

Figure 03: Global Computer Graphics Market Revenue Projection (US$ Mn), 2022 – 2032

Figure 04: Global Computer Graphics Market Y-o-Y Growth (Value %) Forecast, 2022 - 2032

Figure 05: Global Computer Graphics Market Revenue Projection (US$ Mn), by Region, 2022 – 2032

Figure 06: Global VFX Market Size and CAGR, 2022 & 2032 (US$ Mn and Value %)

Figure 07: Key Steps Involved in Animation/VFX Creation 

Figure 08: Ecosystem Analysis

Figure 09: Market Value Share by Component (2021)

Figure 10: Market Value Share by Application (2021)

Figure 11: Market Value Share by Region (2021)

Figure 12: Global Market CAGR by Component (2022 – 2032)

Figure 13: Global Market CAGR by Application (2022 – 2032)

Figure 14: Global Market CAGR by Region (2022 – 2032)

Figure 15: Global Computer Graphics Market Revenue and Y-o-Y Growth, by Component– Hardware, 2022 – 2032, (US$ Mn and Value %)

Figure 16: Global Computer Graphics Market Revenue and Y-o-Y Growth, by Component– Application Software, 2022 – 2032, (US$ Mn and Value %)

Figure 17: Global Computer Graphics Market Component Comparison Matrix

Figure 18: Global Computer Graphics Market Value Share Analysis by Component, 2021 and 2032

Figure 19: Global Computer Graphics Market Attractiveness Analysis by Component

Figure 20: Global Computer Graphics Market Revenue and Y-o-Y Growth, by Application – CAD, 2022 – 2032, (US$ Mn and Value %)

Figure 21: Global Computer Graphics Market Revenue and Y-o-Y Growth, by Application – Image Processing, 2022 – 2032, (US$ Mn and Value %)

Figure 22: Global Computer Graphics Market Revenue and Y-o-Y Growth, by Application – Entertainment, 2022 – 2032, (US$ Mn and Value %)

Figure 23: Global Computer Graphics Market Revenue and Y-o-Y Growth, by Application – User Interfaces, 2022 – 2032, (US$ Mn and Value %)

Figure 24: Global Computer Graphics Market Revenue and Y-o-Y Growth, by Application – Others, 2022–2032,(US$ Mn and Value %)

Figure 25: Global Computer Graphics Market Application Comparison Matrix

Figure 26: Global Computer Graphics Market Value Share Analysis by Application, 2021 and 2032

Figure 27: Global Computer Graphics Market Attractiveness Analysis by Application

Figure 28: Global Computer Graphics Market Region Comparison Matrix

Figure 29: Global Computer Graphics Market Value Share Analysis by Region, 2021 and 2032

Figure 30: Global Computer Graphics Market Attractiveness Analysis, by Region

Figure 31: North America Computer Graphics Market Revenue (US$ Mn), 2022 – 2032

Figure 32: North America Computer Graphics Market Y-o-Y Growth, 2022 - 2032

Figure 33: North America Computer Graphics Market Value Share Analysis by Component, 2021 and 2032

Figure 34: North America Computer Graphics Market Value Share Analysis by Application, 2021 and 2032

Figure 35: North America Computer Graphics Market Share Analysis, by Country, 2021 and 2032

Figure 36: North America Computer Graphics Market Attractiveness Analysis, by Country (2021)

Figure 37: North America Computer Graphics Market Attractiveness Analysis, by Component (2021)

Figure 38: North America Computer Graphics Market Attractiveness Analysis, by Application (2021)

Figure 39: Europe Computer Graphics Market Revenue (US$ Mn), 2022 – 2032

Figure 40: Europe Computer Graphics Market Y-o-Y Growth, 2022 - 2032

Figure 41: Europe Computer Graphics Market Value Share Analysis by Component, 2021 and 2032

Figure 42: Europe Computer Graphics Market Value Share Analysis by Application, 2021 and 2032

Figure 43: Europe Computer Graphics Market Value Share Analysis, by Country, 2021 and 2032

Figure 44: Europe Computer Graphics Market Attractiveness Analysis, by Country (2021)

Figure 45: Europe Computer Graphics Market Attractiveness Analysis, by Component (2021)

Figure 46: Europe Computer Graphics Market Attractiveness Analysis, by Application (2021)

Figure 47: Asia Pacific Computer Graphics Market Revenue, 2022 – 2032, (US$ Mn)

Figure 48: Asia Pacific Computer Graphics Market Y-o-Y Growth, 2022 - 2032

Figure 49: Asia Pacific Computer Graphics Market Value Share Analysis by Component, 2021 and 2032

Figure 50: Asia Pacific Computer Graphics Market Value Share Analysis by Application, 2021 and 2032

Figure 51: Asia Pacific Computer Graphics Market Value Share Analysis, by Country, 2021 & 2032

Figure 52: Asia Pacific Computer Graphics Market Attractiveness Analysis, by Country (2021)

Figure 53: Asia Pacific Computer Graphics Market Attractiveness Analysis, by Component (2021)

Figure 54: Asia Pacific Computer Graphics Market Attractiveness Analysis, by Application (2021)

Figure 55: Middle East and Africa Computer Graphics Market Revenue, 2022 – 2032, (US$ Mn)

Figure 56: Middle East and Africa Computer Graphics Market Y-o-Y Growth, 2022 - 2032

Figure 57: Middle East and Africa Computer Graphics Market Value Share Analysis by Component, 2021 and 2032

Figure 58: Middle East and Africa Computer Graphics Market Value Share Analysis by Application, 2021 and 2032

Figure 59: Middle East & Africa Computer Graphics Market Value Share Analysis by Country, 2021 and 2032

Figure 60: Middle East & Africa Computer Graphics Market Attractiveness Analysis, by Country (2021)

Figure 61: Middle East & Africa Computer Graphics Market Attractiveness Analysis, by Component (2021)

Figure 62: Middle East & Africa Computer Graphics Market Attractiveness Analysis, by Application (2021)

Figure 63: South America Computer Graphics Market Revenue, 2022 – 2032, (US$ Mn)

Figure 64: South America Computer Graphics Market Y-o-Y Growth (%), 2022 - 2032

Figure 65: South America Computer Graphics Market Value Share Analysis by Component, 2021 and 2032

Figure 66: South America Computer Graphics Market Value Share Analysis by Application, 2021 and 2032

Figure 67: South America Computer Graphics Market Value Share Analysis, by Country, 2021 and 2032

Figure 68: South America Computer Graphics Market Attractiveness Analysis, by Country (2021)

Figure 69: South America Computer Graphics Market Attractiveness Analysis, by Component (2021)

Figure 70: South America Computer Graphics Market Attractiveness Analysis, by Application (2021)

Figure 71: Global Computer Graphics Market Share Analysis by Company (2021)

Need specific information?

Request Customization

Explore Technology Insights

View Reports

Recommendations

Technology

GPU as a Service Market

Published : August 2022

Technology

Integrated Graphics Chipset Market

Published : January 2018

Technology

Natural Language Processing NLP Market

Published : March 2022

Technology

Heterogeneous Mobile Processing and Computing Market

Published : January 1970

Google translate

Computer Graphics Market