The computer keyboard market stands at the verge of a decade-long continued growth, poised to transform workspace ergonomics, professional gaming, and personal computing input solutions. The sector’s journey from USD 6.7 billion in 2025 to USD 9.6 billion in 2035 indicates steady momentum, reflecting continuous adoption of advanced gaming, ergonomic, and wireless keyboards by consumers, corporations, and educational institutions worldwide.
The first half of the decade (2025–2030) will witness the market advancing from USD 6.74 billion to approximately USD 8.02 billion, contributing USD 1.28 billion—35.1% of the forecasted total growth for the period. This phase will see the rapid adoption of gaming and wireless keyboards, propelled by remote work, e-sports, and increasing online education. Enhanced performance, connectivity, and product customization are becoming standard consumer expectations.
The latter half (2030–2035) will maintain robust growth, surging from USD 8.02 billion to USD 9.58 billion, a rise of USD 1.56 billion or 64.9% of the decade’s total expansion. This period will feature mass market penetration of sophisticated ergonomic and multi-device keyboards, seamless integration with next-generation PCs and smart computing environments, and expanded presence in Asia-Pacific and emerging markets.
Processing operations reveal significant coordination difficulties between research and development teams pursuing enhanced tactile feedback mechanisms and regulatory affairs personnel ensuring compliance with electromagnetic compatibility testing standards. R&D personnel develop advanced mechanical switch technologies, wireless communication protocols, and RGB lighting systems to maximize user experience and gaming performance, while regulatory teams enforce testing protocols that may require expensive anechoic chamber validation studies. Operations managers navigate these competing priorities against product launch timelines when electromagnetic compatibility certification processes require extensive testing periods during competitive gaming peripheral release cycles.
Manufacturing constraints in wireless gaming keyboard operations demonstrate cross-functional coordination difficulties between radio frequency engineering teams optimizing low-latency communication protocols and electromagnetic compatibility teams ensuring emission compliance. RF engineers develop advanced 2.4GHz wireless systems and Bluetooth connectivity features providing enhanced responsiveness for competitive gaming applications, while EMC teams enforce testing protocols ensuring devices do not interfere with other wireless equipment. These competing requirements create operational bottlenecks when gaming performance optimization requires higher transmission power that may exceed regulatory emission limits during certification testing.
Supply chain coordination challenges emerge from geographic dispersion between specialized component suppliers and keyboard assembly facilities serving global markets with different regulatory requirements. Mechanical switch manufacturing concentrates in regions with precision manufacturing capabilities, while wireless communication modules originate from specialized semiconductor facilities with radio frequency design expertise. Integration coordination between these dispersed suppliers requires sophisticated quality management systems when component electromagnetic characteristics affect overall keyboard certification compliance during diverse regional testing requirements.
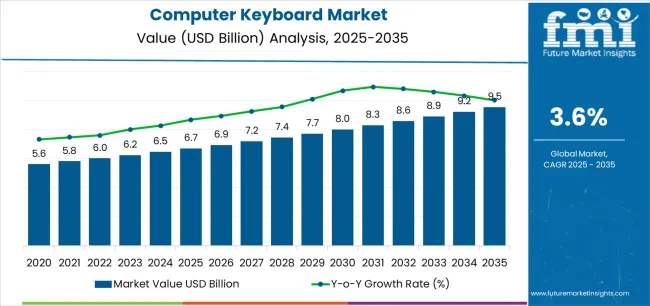
The computer keyboard market showcases distinct phases of development and evolving competitive dynamics throughout the forecast period. Between 2025 and 2030, the industry will be in its innovation adoption phase, growing from USD 6.74 billion to approximately USD 8.02 billion. During this first half of the decade, the market maintains steady annual increments of around 3–4% per year, with the period contributing about USD 1.28 billion or 35% of total decade expansion. This phase features the mainstreaming of gaming, wireless, and ergonomic keyboards these categories increasingly become industry standards. Key drivers include the rapid spread of remote work, gaming e-sports expansion, and enhanced wireless connectivity.
The broader market transition is characterized by standardization of ergonomic design protocols, cost reductions in wireless technologies, and greater consumer literacy about the benefits and health advantages of specialized input devices. By the end of this period, ergonomic and gaming keyboards reach over 35–40% penetration in consumer and enterprise procurement. Competitive dynamics see established leaders like Logitech, Microsoft, and Dell deepening their offerings with advanced customization, while emerging players target value-centric and compact keyboard segments.
From 2030 to 2035, market momentum shifts to advanced integration and multi-device compatibility, with size climbing from USD 8.02 billion to 9.58 billion, representing USD 1.56 billion or about 65% of the decade’s expansion. In this phase, smart keyboards incorporating touch, sensors, multi-platform connectivity, and cloud-updatable firmware become commonplace. Seamless integration with smart office environments, gaming consoles, and hybrid workspaces distinguishes top players. The competitive environment matures into comprehensive digital interaction ecosystems, and leading brands focus on eco-friendly materials and AI-driven customization. The market’s trajectory signals fundamental shifts in how professionals, consumers, and enterprises interact with technology peripherals, driving demand spanning all major end-user segments.
| Metric | Value |
|---|---|
| Market Value (2025) | USD 6.7 billion |
| Market Forecast (2035) | USD 9.6 billion |
| Growth Rate | 3.6% CAGR |
| Leading Type | Standard Keyboards |
| Primary End User Segment | Individuals/Consumers |
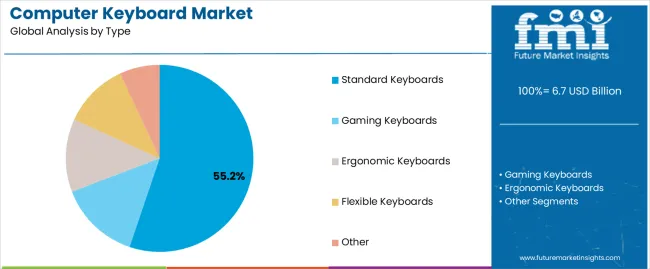
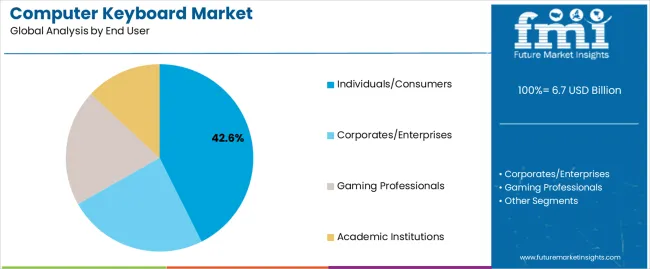
The computer keyboard market shows solid growth fundamentals with Standard Keyboards maintaining a dominant share due to their broad usability and cost-effective production. The Individuals/Consumers segment drives primary demand, encouraged by growing personal computing needs, remote work trends, and gaming industry expansion. Wired keyboards currently lead the connectivity segment, but wireless devices are rapidly gaining traction facilitated by advances in Bluetooth and RF technologies. Geographic growth is prominent in Asia-Pacific with China and India leading, while mature markets in the USA, Germany, and Japan show steady demand supported by ergonomic and premium product adoption. The competitive landscape includes major players like Logitech, Microsoft, Dell, Lenovo, and CHICONY GLOBAL INC., who are strengthening product innovation and market penetration strategies.
Challenges persist:
These dynamics collectively shape a competitive market environment where innovation, brand reputation, and affordability play critical roles in driving growth and overcoming market barriers.
The computer keyboard market presents significant growth avenues, projected to expand from USD 6.74 billion in 2025 to USD 9.58 billion by 2035 at a CAGR of 3.6%. As digital transformation accelerates across enterprises, gaming sectors, and personal computing, keyboards have evolved into essential, highly specialized tools offering enhanced productivity, ergonomic comfort, and gaming performance. Key growth drivers include widespread adoption of wireless and mechanical keyboards, increasing focus on user experience, and expanding gaming and remote work demands.
The convergence of technology innovation, ergonomic awareness, and regional market expansion creates promising opportunities. Advanced features like customizable keys, RGB lighting, wireless multi-device connectivity, and ergonomic designs will continue defining premium market segments. Geographic expansion is led by Asia-Pacific with China and India rapidly adopting innovative keyboards, while North America and Europe maintain steady growth driven by premium and specialized product demand.
These strategic pathways offer diversified opportunities for keyboard manufacturers, technology developers, and distributors to capitalize on evolving user needs, connectivity, and regional dynamics, fostering growth and innovation through 2035.
Primary Classification by Type:
The computer keyboard market segments into Standard Keyboards, Gaming Keyboards, Ergonomic Keyboards, Flexible Keyboards, and Other types, reflecting a spectrum from traditional input devices to specialized and adaptable models tailored for diverse user needs and environments.
Secondary Breakdown by End User:
End users include Individuals/Consumers, Corporates/Enterprises, Gaming Professionals, and Academic Institutions. This segmentation addresses differing usage patterns, with individuals driving volume demand, corporates emphasizing productivity and ergonomics, gamers requiring advanced features, and educational sectors focusing on cost-efficiency and durability.
Regional Classification:
Geographically, market distribution spans Asia-Pacific, North America, Europe, Latin America, and the Middle East & Africa. Mature markets like the USA, Germany, and Japan lead adoption of premium and gaming keyboards, while Asia-Pacific powers growth through rapid digital infrastructure development and expanding consumer bases in China and India.
Key characteristics include:
Application dynamics include:
The computer keyboard market is driven by several key growth accelerators. The rise of remote work and digital learning environments has increased demand for versatile and ergonomic keyboards that enhance productivity and comfort. The booming gaming and eSports industries fuel the need for high-performance mechanical keyboards with features like customizable keys and advanced lighting. Continuous technological innovations in wireless connectivity, multi-device compatibility, and ergonomic design further expand the market's appeal. Geographic expansion, particularly in Asia-Pacific with strong growth in China and India, alongside steady mature market demand in North America and Europe, supports robust global growth.
Despite these growth opportunities, the market faces some inhibitors. Premium keyboards with advanced features come with higher prices, which may discourage adoption among budget-conscious consumers. Compatibility issues due to varying device standards and legacy systems can also hinder widespread use of newer wireless or multifunctional keyboards, especially in enterprise settings. Furthermore, the market is highly fragmented with many players and diverse product offerings, leading to intense competition and pressure on profit margins.
Market evolution trends show diversification across keyboard types such as standard, gaming, ergonomic, and flexible designs, meeting a wide range of user needs. Innovation is moving beyond basic typing devices to smart keyboards that feature AI-assisted customization, cloud-based updates, and enhanced connectivity. Geographically, while well-established markets favor premium and ergonomic products, emerging regions tend to prioritize affordable and basic wireless keyboards, resulting in tailored regional strategies. Environmental responsibility is also becoming a focal point, with manufacturers increasingly adopting eco-friendly materials and production processes to meet growing consumer demand for responsible products.
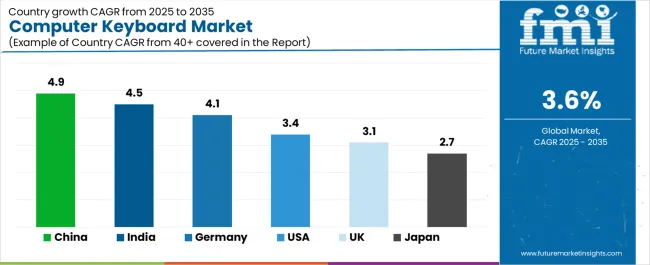
The computer keyboard market demonstrates varied regional dynamics, with Growth Leaders including China (4.9% CAGR) and India (4.5% CAGR), driven by strong consumer electronics demand, large-scale manufacturing capacity, and rapid adoption of gaming and ergonomic keyboards. Steady Performers encompass Germany (4.1% CAGR) and the USA (3.4% CAGR), where established IT infrastructure, professional workspace upgrades, and gaming peripherals withstand growth. Emerging Markets include the UK (3.1% CAGR) and Japan (2.7% CAGR), where demand is supported by niche adoption in gaming, specialty keyboards for language-specific layouts, and premium ergonomic solutions.
| Country | CAGR (2025–2035) |
|---|---|
| China | 4.9% |
| India | 4.5% |
| Germany | 4.1% |
| USA | 3.4% |
| UK | 3.1% |
| Japan | 2.7% |
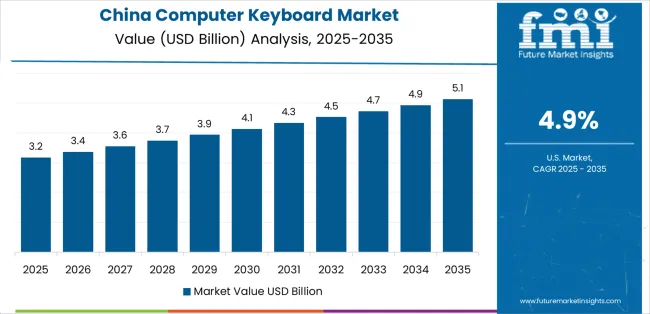
China establishes market leadership in the computer keyboard market through its dominant consumer electronics industry, large-scale PC manufacturing, and strong demand for both mainstream and specialized keyboards. The country’s 4.9% CAGR through 2035 reflects rapid digital adoption, a booming gaming culture, and widespread remote work trends. Growth is concentrated in major technology and manufacturing hubs such as Shenzhen, Guangzhou, and Shanghai, where domestic producers and international brands operate large-scale production facilities. Chinese manufacturers are leveraging cost-effective production advantages while expanding into premium mechanical, wireless, and gaming keyboards to capture evolving consumer preferences.
Distribution channels through e-commerce platforms (JD.com, Tmall, Pinduoduo) and large retail electronics chains ensure deep penetration across urban and rural markets. Government support for digital infrastructure, smart manufacturing, and export-led electronics growth further enhances China’s leadership position, while exports of keyboards to North America, Europe, and Southeast Asia remain a key driver of global supply.
Strategic Market Indicators:
India demonstrates strong potential in the Computer Keyboard Market with a CAGR of 4.5% through 2035, driven by rapid PC adoption, the expansion of IT-enabled services, and rising demand for affordable accessories. Growth is concentrated in Bengaluru, Hyderabad, Pune, and Delhi NCR, where IT hubs and a young digital workforce fuel rising demand for both office and gaming keyboards. Local manufacturers are increasingly producing cost-effective wired and wireless keyboards to meet demand, while global brands target the premium segment with mechanical and ergonomic designs. Distribution is expanding rapidly through e-commerce platforms (Flipkart, Amazon India), which now dominate sales.
Strategic Market Indicators:
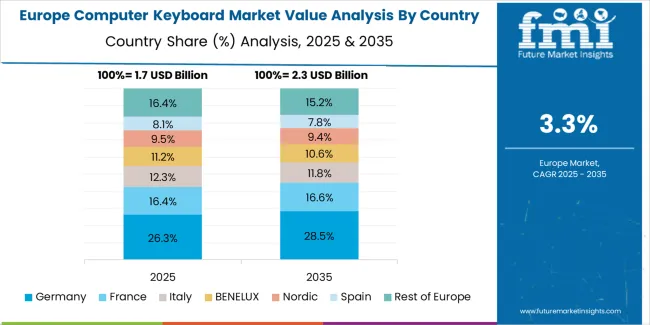
Germany records a 4.1% CAGR through 2035, reflecting steady demand from professional workplaces, industrial applications, and gaming enthusiasts. Growth is concentrated in Bavaria, Berlin, and North Rhine-Westphalia, where high adoption of ergonomic and mechanical keyboards is driven by workplace health regulations and consumer preference for high-quality peripherals. German consumers favor durability and precision engineering, supporting premium-priced products. The country also plays a leading role in European gaming markets, where advanced keyboards with customizable features are in high demand.
Strategic Market Indicators:
The USA grows at a 3.4% CAGR through 2035, supported by a mature consumer electronics base, established IT infrastructure, and strong gaming adoption. Growth is concentrated in California, Texas, and New York, where large gaming communities and enterprise IT upgrades steady demand. USA consumers show a strong preference for wireless, Bluetooth, and mechanical keyboards, particularly those integrated with productivity software or gaming ecosystems. Domestic demand is further driven by work-from-home setups, fueling consistent sales of mid- to premium-tier models.
Strategic Market Indicators:
The UK posts a 3.1% CAGR through 2035, with growth driven by e-commerce retailing, office adoption, and niche demand for ergonomic and compact keyboards. Demand is concentrated in London, Manchester, and Birmingham, where urban consumers are more likely to invest in wireless and premium designs. Gaming adoption continues to rise, though price-sensitive consumers lean toward mid-range products. Post-Brexit trade shifts have increased reliance on imports from Asia and the EU, but strong online sales through Amazon UK, Currys, and Argos provide steady access.
Strategic Market Indicators:
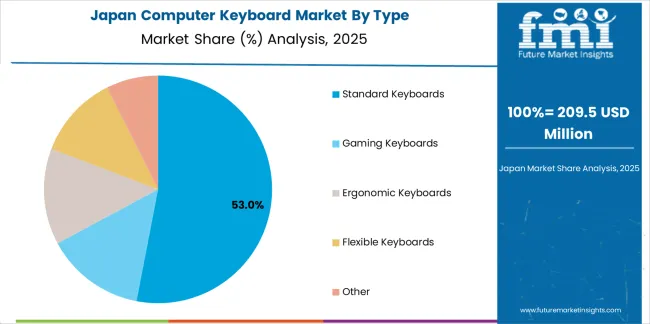
Japan grows at a 2.7% CAGR through 2035, reflecting its conservative but steady consumer electronics market. Demand is concentrated in Tokyo, Osaka, and Nagoya, where aging office infrastructure is gradually being upgraded with modern peripherals. Japanese consumers prefer compact, high-precision keyboards, particularly for language-specific layouts, and exhibit strong demand for ergonomic and durable products. Gaming adoption is slower compared to China and the USA, but niche demand for premium mechanical keyboards is expanding in e-sports communities. Japan’s market is import-reliant, with most supply sourced from China, Taiwan, and South Korea.
Strategic Market Indicators:
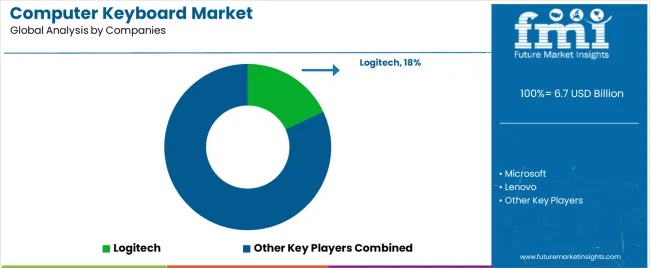
The Computer Keyboard Market is expanding steadily as demand rises from both mainstream consumers and specialized user groups such as gamers, programmers, and remote workers. The shift toward hybrid work environments has boosted interest in ergonomic designs, wireless connectivity, and multi-device compatibility. At the same time, gaming keyboards — particularly mechanical models — continue to gain traction thanks to advances in switches, RGB lighting, and customization software. With the growing adoption of laptops and tablets, compact and portable keyboards are also seeing heightened demand.
Logitech, Microsoft, and HP lead the global landscape with broad portfolios ranging from budget-friendly membrane keyboards to high-performance wireless and ergonomic models. Their emphasis on comfort, durability, and long battery life keeps them dominant in office and productivity-focused segments. Dell Inc. and Lenovo complement this leadership by offering keyboards integrated into broader enterprise accessory ecosystems, making them popular in business and institutional environments.
In the gaming segment, Razer, Corsair, SteelSeries, and HyperX remain key innovators, pushing enhancements in mechanical switches, customizable macros, and software-driven performance tuning. CHICONY GLOBAL INC. plays a critical manufacturing role as a major OEM supplier powering many global brands.
Premium players like Apple, with its low-profile Magic Keyboard line, and AmazonBasics, offering economical everyday options, help widen accessibility across price ranges. As personalization, wireless performance, and cross-platform compatibility continue to define user expectations, these companies are shaping the next generation of computer keyboard technology.
| Item | Value |
|---|---|
| Quantitative Units(2025) | USD 6.74 billion |
| System Type | Standard Keyboards, Gaming Keyboards, Ergonomic Keyboards, Flexible Keyboards, Other |
| Application (End User) | Individuals/Consumers, Corporates/Enterprises, Gaming Professionals, Academic Institutions |
| Connectivity | Wired Keyboards, Wireless Keyboards |
| Regions Covered | Asia Pacific, North America, Europe, Latin America, Middle East & Africa |
| Countries Covered | China, India, Germany, Brazil, United States, United Kingdom, Japan, South Korea, Australia & New Zealand, and 25+ additional countries |
| Key Companies Profiled | Logitech, Microsoft, Lenovo, Dell Inc., CHICONY GLOBAL INC., Razer, SteelSeries, Corsair, HyperX, HP, Apple, AmazonBasics |
| Additional Attributes | Sales data segmented by keyboard type, end user, and connectivity. Regional adoption trends analyzed across Asia Pacific, North America, and Europe. Competitive landscape encompassing leading peripheral technology providers and gaming specialists. User preferences include ergonomic design, wireless capabilities, gaming performance, and smart device integration. Focus on innovations such as mechanical switch technology, customizability, wireless connectivity, and software-driven features. Development of advanced solutions emphasizing durability, performance, and multi-device support caters to evolving consumer and enterprise needs. |
The global computer keyboard market is estimated to be valued at USD 6.7 billion in 2025.
The market size for the computer keyboard market is projected to reach USD 9.5 billion by 2035.
The computer keyboard market is expected to grow at a 3.6% CAGR between 2025 and 2035.
The key product types in computer keyboard market are standard keyboards , gaming keyboards, ergonomic keyboards, flexible keyboards and other.
In terms of end user, individuals/consumers segment to command 42.6% share in the computer keyboard market in 2025.


Our Research Products

The "Full Research Suite" delivers actionable market intel, deep dives on markets or technologies, so clients act faster, cut risk, and unlock growth.

The Leaderboard benchmarks and ranks top vendors, classifying them as Established Leaders, Leading Challengers, or Disruptors & Challengers.

Locates where complements amplify value and substitutes erode it, forecasting net impact by horizon

We deliver granular, decision-grade intel: market sizing, 5-year forecasts, pricing, adoption, usage, revenue, and operational KPIs—plus competitor tracking, regulation, and value chains—across 60 countries broadly.

Spot the shifts before they hit your P&L. We track inflection points, adoption curves, pricing moves, and ecosystem plays to show where demand is heading, why it is changing, and what to do next across high-growth markets and disruptive tech

Real-time reads of user behavior. We track shifting priorities, perceptions of today’s and next-gen services, and provider experience, then pace how fast tech moves from trial to adoption, blending buyer, consumer, and channel inputs with social signals (#WhySwitch, #UX).

Partner with our analyst team to build a custom report designed around your business priorities. From analysing market trends to assessing competitors or crafting bespoke datasets, we tailor insights to your needs.
Supplier Intelligence
Discovery & Profiling
Capacity & Footprint
Performance & Risk
Compliance & Governance
Commercial Readiness
Who Supplies Whom
Scorecards & Shortlists
Playbooks & Docs
Category Intelligence
Definition & Scope
Demand & Use Cases
Cost Drivers
Market Structure
Supply Chain Map
Trade & Policy
Operating Norms
Deliverables
Buyer Intelligence
Account Basics
Spend & Scope
Procurement Model
Vendor Requirements
Terms & Policies
Entry Strategy
Pain Points & Triggers
Outputs
Pricing Analysis
Benchmarks
Trends
Should-Cost
Indexation
Landed Cost
Commercial Terms
Deliverables
Brand Analysis
Positioning & Value Prop
Share & Presence
Customer Evidence
Go-to-Market
Digital & Reputation
Compliance & Trust
KPIs & Gaps
Outputs
Full Research Suite comprises of:
Market outlook & trends analysis
Interviews & case studies
Strategic recommendations
Vendor profiles & capabilities analysis
5-year forecasts
8 regions and 60+ country-level data splits
Market segment data splits
12 months of continuous data updates
DELIVERED AS:
PDF EXCEL ONLINE
Computer Keyboard Industry Analysis in East Asia Size and Share Forecast Outlook 2025 to 2035
Demand for Computer Keyboard in Japan Size and Share Forecast Outlook 2025 to 2035
Demand for Computer Keyboard in USA Size and Share Forecast Outlook 2025 to 2035
Computer Vision in Healthcare Market Size and Share Forecast Outlook 2025 to 2035
Computer Aided Facility Management (CAFM) Market Size and Share Forecast Outlook 2025 to 2035
Computerized Physician Order Entry (CPOE) Market Size and Share Forecast Outlook 2025 to 2035
Computer Graphics Market Size and Share Forecast Outlook 2025 to 2035
Computer Peripherals Market Size and Share Forecast Outlook 2025 to 2035
Computer-aided Design (CAD) Market Analysis - Size, Share, & Forecast Outlook 2025 to 2035
Computer Microchips Market Size and Share Forecast Outlook 2025 to 2035
Computer-aided Engineering Market Analysis - Size, Share, and Forecast 2025 to 2035
Computerized Maintenance Management Systems (CMMS) Market Trends – Size, Share & Growth 2025–2035
Computer Assisted Coding Software Market Analysis by Solution, Deployment, Application, and Region Through 2035
Computer Vision Market Insights – Trends & Forecast 2025 to 2035
Computer Aided Trauma Fixators Market
Computer-To-Plate And Computer-To-Press Systems Market
Dive Computer Market Forecast and Outlook 2025 to 2035
Flow Computer Market Size and Share Forecast Outlook 2025 to 2035
Brain-Computer Interface Implant Market Analysis Size and Share Forecast Outlook 2025 to 2035
Mechanical Keyboard Market

Thank you!
You will receive an email from our Business Development Manager. Please be sure to check your SPAM/JUNK folder too.
Chat With
MaRIA