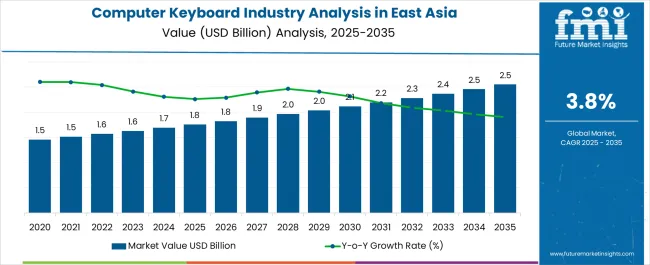
The Computer Keyboard Industry Analysis in East Asia is estimated to be valued at USD 1.8 billion in 2025 and is projected to reach USD 2.5 billion by 2035, registering a compound annual growth rate (CAGR) of 3.8% over the forecast period.
| Metric | Value |
|---|---|
| Computer Keyboard Industry Analysis in East Asia Estimated Value in (2025 E) | USD 1.8 billion |
| Computer Keyboard Industry Analysis in East Asia Forecast Value in (2035 F) | USD 2.5 billion |
| Forecast CAGR (2025 to 2035) | 3.8% |
The computer keyboard industry in East Asia is experiencing robust growth. Rising adoption of personal computers, gaming systems, and office automation tools is driving demand. Current market dynamics are characterized by strong consumer preference for ergonomic and high-performance keyboards.
Technological advancements in manufacturing, including improved key switch mechanisms and material innovations, are enhancing product durability and user experience. The future outlook is shaped by increasing digitalization, growth in the gaming sector, and expansion of remote working culture, which are expected to elevate demand for both standard and specialized keyboards.
Growth rationale is anchored on the ability of manufacturers to offer diverse product portfolios catering to varying user requirements, integration of advanced features such as backlighting and mechanical switches, and the presence of efficient distribution networks ensuring product availability These factors are collectively underpinning consistent market expansion and driving adoption across commercial, educational, and consumer segments in the region.
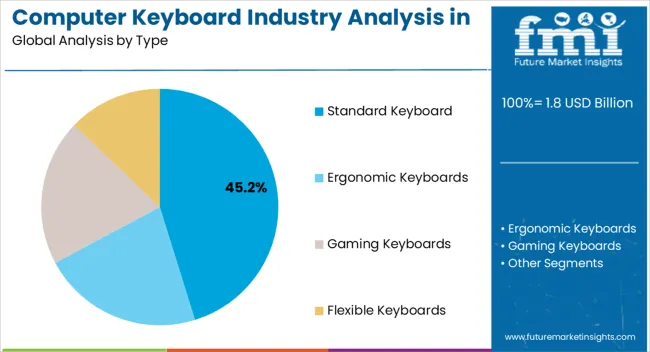
The standard keyboard segment, representing 45.20% of the type category, has maintained leadership due to its wide applicability in office, home, and educational environments. Adoption has been supported by its affordability, ease of use, and compatibility with various computing systems.
Manufacturing improvements and quality assurance measures have reinforced product reliability, while stable supply chains have ensured consistent availability. Market acceptance has been strengthened by ergonomic designs and incremental feature enhancements, catering to prolonged usage and user comfort.
Continued emphasis on cost-effective production and meeting regional compliance standards is expected to sustain the segment’s market share, ensuring it remains the preferred choice for mass-market adoption.
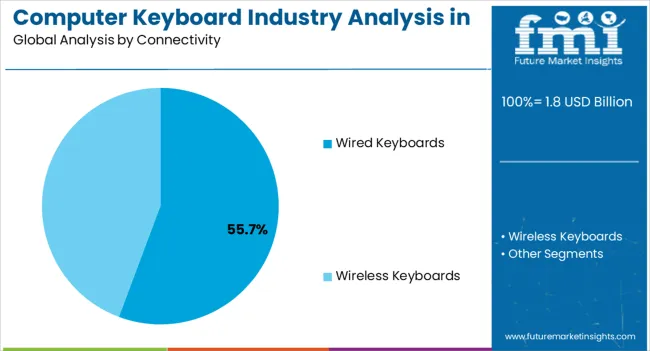
The wired keyboards segment, holding 55.70% of the connectivity category, has emerged as the leading segment due to its reliability, low latency, and stable performance across commercial and gaming applications. Adoption has been reinforced by consistent demand from office setups and professional environments where uninterrupted connectivity is critical.
Technological enhancements in cable durability and key responsiveness have improved user experience. Supply chain efficiency and adherence to quality standards have further strengthened market preference.
Continued deployment in institutional and commercial settings, combined with cost competitiveness, is expected to maintain the segment’s dominance within the connectivity category over the forecast period.
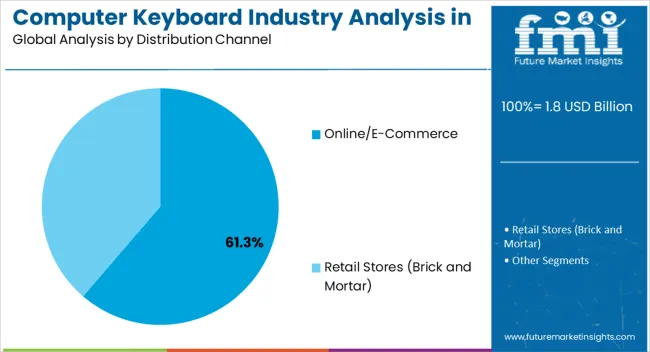
The online/e-commerce segment, accounting for 61.30% of the distribution channel category, has established market leadership owing to convenience, broader product accessibility, and competitive pricing. Adoption has been driven by growing internet penetration, mobile commerce growth, and enhanced digital payment solutions.
E-commerce platforms have enabled manufacturers to reach both urban and semi-urban consumers efficiently, while strategic partnerships with logistics providers have improved delivery speed and reliability. The segment’s prominence has been reinforced by user preference for direct-to-consumer purchases and product comparison tools.
Continued expansion of online marketplaces and targeted digital marketing strategies are expected to sustain the segment’s market share and facilitate wider regional penetration.
From 2020 to 2025, the computer keyboard industry experienced a CAGR of 3.8%, reaching a size of USD 1,623 million in 2025.
| Historical CAGR (2020 to 2025) | 3.8% |
|---|---|
| Forecast CAGR (2025 to 2035) | 4.0% |
East Asia is moving toward technical advancements such as mechanical keyboards and gaming professionals. The rise of remote work during the COVID-19 epidemic enhanced demand for computer keyboard as people sought to outfit their home offices with high-quality peripherals.
The gaming industry, especially in East Asia, significantly increased the demand for high-performance keyboards. Economic conditions throughout this period also played a role, with periods of expansion, supporting rising purchasing power.
Several factors are expected to impact the development of East Asia’s computer keyboard demand. Continued technical advancement is projected to bring even more complex and customizable features that appeal to several consumers.
The gaming industry is expected to rise, ensuring an adequate demand for gaming keyboards. Environmental concerns can gain popularity, impacting customer preferences for environmentally friendly products and sustainable industrial techniques.
Uncertainties such as supply chain interruptions and geopolitical events can pose hurdles to the sector. Understanding these dynamics is critical for enterprises and stakeholders navigating East Asia's computer keyboard industry in the forecast period.
Future Forecast for East Asia Computer Keyboard Industry
The computer keyboard industry in East Asia is expected to rise at a CAGR of 4.0% from 2025 to 2035. The industry size is expected to reach USD 2,392 million by 2035.
The computer keyboard industry in East Asia is undergoing transformational technology, such as ergonomic design, to improve user experience and effectiveness. Technological advancements will likely push the development of lightweight yet durable keyboards.
Such keyboards would help incorporate advanced components that provide a satisfying sensory experience while ensuring longevity. Touch-sensitive surfaces and haptic feedback systems could improve typing by offering consumers a more intuitive and responsive interaction.
Artificial intelligence (AI) is experiencing a significant demand in the field of computer keyboards. AI-driven predictive typing algorithms will continue to improve individual user preferences and language nuances.
Enhanced voice recognition capabilities can also become integral to these keyboards. These would enable users to dictate text seamlessly and foster a more inclusive & accessible computing environment.
East Asia's computer keyboards integrate innovations, ergonomic designs, and better utility. With an emphasis on user-centric features and seamless integration with future technologies, these keyboards will change how people interact with their digital devices in the assessment period. This is projected to lead the way for a more efficient and delightful computing experience.
The table presents the expected CAGR for East Asia’s computer keyboard industry over several semi-annual periods spanning from 2025 to 2035. In the first half (H1) of the decade from 2025 to 2035, the field is predicted to surge at a CAGR of 3.6%, followed by a slightly lower growth rate of 3.5% in the second half (H2) of the same decade. Moving into the subsequent period, from H1 2025 to H2 2035, the CAGR is projected to increase slightly to 3.9% in the first half and remain relatively moderate at 3.7% in the second half.
| Particular | Value CAGR |
|---|---|
| H1 | 3.6% (2025 to 2035) |
| H2 | 3.5% (2025 to 2035) |
| H1 | 3.9% (2025 to 2035) |
| H2 | 3.7% (2025 to 2035) |
The below section highlights the projected CAGR of key segments, including type, connectivity, distribution channel, technology, and end-user:
| Type | Value CAGR |
|---|---|
| Standard Keyboards | 3.4% |
| Ergonomic Keyboards | 4.7% |
| Gaming Keyboards | 5.0% |
| Flexible Keyboards | 4.4% |
East Asia’s computer keyboard industry is seeing a surge in demand for gaming keyboards, owing to the region's strong gaming culture and growing popularity of sports. East Asia-based manufacturers are designing and integrating gaming-centric features into their keyboards.
They are striving to prevent ghosting and incorporating n-key rollover technology, which ensures that every input is correctly registered, even during complex gaming movements. Moreover, combining adjustable keycaps and software-driven setups allows players to customize their keyboards to specific gaming genres or individual play styles.
East Asia’s computer keyboard industry is experiencing a considerable increase in demand for gaming keyboards, driven by the need for high-performance devices. As gaming plays an essential part in entertainment culture, demand for advanced gaming keyboards is expected to remain a significant segment in East Asia’s computer accessory industry.
| Connectivity | Value CAGR |
|---|---|
| Wired Keyboards | 3.4% |
| Wireless Keyboards | 5.4% |
East Asia’s computer keyboard industry is seeing a significant increase in demand for wireless keyboards, announcing a new era of improved mobility and convenience for users across the region. Several variables that connect with the increasing needs of customers support the emerging growth potential for wireless keyboards.
The emergence of small and portable computer devices, such as laptops, tablets, and 2-in-1 gadgets, which value an organized workstation, is one significant cause. Wireless keyboards allow the creation of a clean and orderly workplace by eliminating the need for tangled cables, contributing to the trend for minimalist and ergonomic work arrangements.
Wireless technological advancements, such as Bluetooth and RF communication, have substantially enhanced the reliability & responsiveness of wireless keyboards. Low-latency connections provide minimum delays, making wireless keyboards a viable option for gamers and professionals.
| Distribution channel | Value CAGR |
|---|---|
| Online/E-commerce | 4.9% |
| Retail Stores (Brick & Mortar) | 3.4% |
With the growing popularity of the internet and e-commerce channels, East Asia’s computer keyboard industry is undergoing a revolutionary shift. As digital connectivity spreads throughout the region, customers increasingly use internet platforms to research, compare, and buy computer keyboards. The ease of online buying, combined with a wide range of product options and competitive prices, has spurred the rise of e-commerce in East Asia’s computer keyboard industry.
E-commerce platforms also serve as a central location for new product launches and advances in the computer keyboard sector. Manufacturers and retailers use virtual events & displays to promote new models, highlight special features, and communicate with customers. This digital presence allows firms to reach a larger audience and interact proficiently with East Asia’s consumers.
Digital marketing initiatives, social media promotions, and online reviews are essential in creating consumer impressions and influencing purchasing decisions. As East Asia embraces digital transformation, the online presence of computer keyboard items is projected to play an essential role in influencing the progression. This would help in offering consumers a seamless and efficient way to interact with the latest technology.
| Technology | Value CAGR |
|---|---|
| Mechanical Keyboards | 5.4% |
| Membrane Keyboards | 3.7% |
| Scissor-switch Keyboards | 3.6% |
| Capacitive Keyboards | 3.4% |
| Others | 2.7% |
Mechanical keyboards are gaining ground in East Asia’s computer keyboard industry, emerging as the favored option for tactile and high-performance typing experience for customers. These keyboards, differentiated by unique mechanical switches under each keycap, provide individual tactile feedback and sensory clicks.
They help in giving users a responsive and gratifying typing experience. Owing to several crucial variables, East Asia, known for its discriminating proficiency in technology customers, is seeing an increasing demand for mechanical keyboards.
The advent of internet platforms and e-commerce in the region has made a varied choice of mechanical keyboards from both local & foreign manufacturers easily accessible. Consumers can research and compare different models, read reviews, and make informed decisions. This is projected to result in increasing mechanical keyboard adoption in East Asia’s computer keyboard industry.
Mechanical keyboards are projected to maintain their pace as the demand grows. This is set to play a critical role in influencing the future of East Asia’s computer peripheral industry as demand for a premium and personalized typing experience grows.
| End-user | Value CAGR |
|---|---|
| Individual/Consumers | 3.8% |
| Corporate/Enterprise | 4.2% |
| Gaming Professionals | 4.7% |
| Academic Institutions | 3.8% |
| Others | 3.1% |
Gaming professionals in East Asia’s computer keyboard industry are wielding significant power, driving demand for high-performance and specialized devices. As gaming gains traction in the region, gaming professionals such as competitive players, streamers, and content makers prioritize precision, responsiveness, and customization in their gaming settings. The computer keyboard, essential for in-game communication and complex operations, has become a crucial tool for these specialists.
East Asia’s gaming experts are increasingly drawn to mechanical keyboards for their tactile feedback and rapid activation, which can significantly impact fast-paced, competitive gaming conditions. Mechanical keyboards with configurable switches, programmable macro keys, and anti-ghosting technology cater to the specific needs of gamers, giving them a competitive advantage and a customized gaming experience.
To summarize, gaming professionals are shaping East Asia’s computer keyboard industry, influencing trends, and driving demand for high-performance peripherals. As gaming continues to gain high popularity, collaboration between gaming pros and keyboard makers will likely result in additional innovations, ensuring that the industry remains dynamic and sensitive to the unique needs of this influential segment.
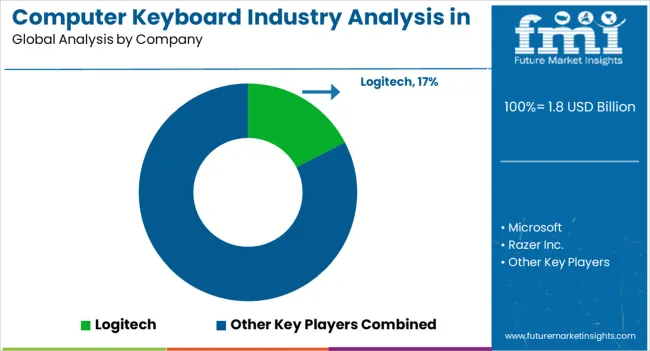
Key players are constantly evolving & adapting to the dynamic industry landscape by employing several growth strategies to remain competitive and meet the changing needs of their clients.
Key Developments-
Product Innovation
Companies are investing in research & development to create cutting-edge solutions that improve efficiency in the measurement, allocation, and reporting of the computer keyboard industry. This innovation includes mechanical keyboards, wireless connectivity, and gaming professionals.
Strategic Partnerships and Collaborations
Strategic partnerships and collaborations are another critical strategy for computer keyboard vendors. By forming alliances with other technology providers, software companies, or industry experts, they expand their offerings and provide comprehensive solutions to their clients. These partnerships enhance the integration of their solutions with other systems, improving interoperability and providing end-to-end solutions for clients in the computer keyboard industry.
Expansion
Vendors seek opportunities in emerging industries where regulatory and compliance requirements are evolving, offering their expertise and solutions to meet the needs of these industries. This expansion also helps diversify their client base and reduce dependence on established industries.
Mergers and Acquisitions
Mergers and acquisitions (M&A) represent a strategic move to consolidate the computer keyboard industry. Vendors acquire smaller competitors, specialized technology companies, or complementary services to expand their product portfolio and customer base. M&A activities enable them to broaden their product portfolio, access new customer segments, and leverage acquired entities' expertise & intellectual property to maintain a competitive edge in the rapidly evolving computer keyboard industry.
| Attribute | Details |
|---|---|
| Estimated Value (2025) | USD 1.8 billion |
| Projected Value (2035) | USD 2.5 billion |
| Anticipated Growth Rate (2025 to 2035) | 3.8% CAGR |
| Historical Data | 2020 to 2025 |
| Forecast Period | 2025 to 2035 |
| Quantitative Units | Revenue in USD million, Volume in Units, and CAGR from 2025 to 2035 |
| Report Coverage | Revenue Forecast, Volume Forecast, Company Ranking, Competitive Landscape, Growth Factors, Trends and Pricing Analysis |
| Segments Covered | Type, Connectivity, Distribution Channel, Technology, End-user, Region |
| Key Companies Profiled | Logitech; Microsoft; Razer Inc.; Corsair; Dell Technologies; HP; Lenovo; AsusTek Computer Inc.; Huawe |
The global computer keyboard industry analysis in East Asia is estimated to be valued at USD 1.8 billion in 2025.
The market size for the computer keyboard industry analysis in East Asia is projected to reach USD 2.6 billion by 2035.
The computer keyboard industry analysis in East Asia is expected to grow at a 3.8% CAGR between 2025 and 2035.
The key product types in computer keyboard industry analysis in East Asia are standard keyboard, ergonomic keyboards, gaming keyboards and flexible keyboards.
In terms of connectivity, wired keyboards segment to command 55.7% share in the computer keyboard industry analysis in East Asia in 2025.


Full Research Suite comprises of:
Market outlook & trends analysis
Interviews & case studies
Strategic recommendations
Vendor profiles & capabilities analysis
5-year forecasts
8 regions and 60+ country-level data splits
Market segment data splits
12 months of continuous data updates
DELIVERED AS:
PDF EXCEL ONLINE
Computer Aided Facility Management (CAFM) Market Size and Share Forecast Outlook 2025 to 2035
Computerized Physician Order Entry (CPOE) Market Size and Share Forecast Outlook 2025 to 2035
Computer Graphics Market Size and Share Forecast Outlook 2025 to 2035
Computer Peripherals Market Size and Share Forecast Outlook 2025 to 2035
Computer-aided Design (CAD) Market Analysis - Size, Share, & Forecast Outlook 2025 to 2035
Computer Microchips Market Size and Share Forecast Outlook 2025 to 2035
Computer Vision Market Insights – Trends & Forecast 2025 to 2035
Computer Aided Trauma Fixators Market
Computer-To-Plate And Computer-To-Press Systems Market
Computerized Maintenance Management Systems (CMMS) Market Trends – Size, Share & Growth 2025–2035
Computer Vision in Healthcare Market Size and Share Forecast Outlook 2025 to 2035
Computer-aided Engineering Market Analysis - Size, Share, and Forecast 2025 to 2035
Computer Assisted Coding Software Market Analysis by Solution, Deployment, Application, and Region Through 2035
Computer Keyboard Market Size and Share Forecast Outlook 2025 to 2035
Flow Computer Market Size and Share Forecast Outlook 2025 to 2035
Dive Computer Market Growth – Industry Trends & Forecast 2024-2034
Brain-Computer Interface Implant Market Analysis Size and Share Forecast Outlook 2025 to 2035
Refurbished Computers and Laptops Market Analysis - Size, Share, & Forecast Outlook 2025 to 2035
Single Board Computer Market Size and Share Forecast Outlook 2025 to 2035
Healthcare AI Computer Vision Market Size and Share Forecast Outlook 2025 to 2035

Thank you!
You will receive an email from our Business Development Manager. Please be sure to check your SPAM/JUNK folder too.
Chat With
MaRIA