Computer Vision in Healthcare Market Size and Share Forecast Outlook From 2024 to 2034

The global Computer Vision In Healthcare Market is expected to expand from USD 2.5 billion in 2024 to USD 56.1 billion by 2034. By 2034, the market is projected to surge at 36.7% CAGR.

Attributes Key Insights
Estimated Global Computer Vision in Healthcare Market Size (2024E) USD 2.5 billion
Projected Computer Vision in Healthcare Market Value (2034F) USD 56.1 billion
Value-based CAGR (2024 to 2034) 36.7%

Top Market Dynamics and Industry Trends in the Global Computer Vision in Healthcare Sector

  • Increasing government initiatives to encourage the use of AI-based technologies, incorporation of big data into healthcare procedures, and use of computer vision in precision medicine are driving computer vision in the healthcare market.
  • The healthcare sector is expected to change dramatically due to the ongoing development of machine learning (ML) models, particularly in computer vision. A more effective system for diagnosis and treatment is anticipated to emerge from this progression, improving patient care outcomes in the process.
  • Computer vision systems provide accurate medical diagnoses to reduce false positives and avoid unnecessary surgery and expensive treatments.
  • Medical providers use computer vision technology to assess fitness and health parameters, enabling patients to make better-informed medical decisions more quickly.
  • Blood loss during surgeries, especially C-sections, is measured using computer vision in healthcare settings. This capacity is essential for timely action when blood loss reaches critical proportions.
  • Body fat percentage is also calculated using computer vision by utilizing pictures from regular cameras, demonstrating the technology's adaptability.

The diverse use of technology illustrates how well computer vision supports thorough healthcare assessments and improves medical decision-making procedures.

Comparison of Historical vs Future Outlook on Changing Consumer Trends for Computer Vision in Healthcare Industry

The global computer vision in healthcare sales grew at a CAGR of 38.4% from 2019 to 2023. The growth of computer vision in healthcare from 2019 to 2023 can be attributed to a convergence of factors:

  • Applications for computer vision have been created to help medical practitioners with diagnosis procedures. These programs assist in identifying anomalies and illnesses by automatically analyzing and interpreting medical images.
  • The adoption of deep learning techniques, particularly convolutional neural networks (CNNs), was a key trend. These sophisticated algorithms have proven to perform better in tasks including object detection, classification, and picture segmentation, which has increased the accuracy of medical image analysis.
  • Computer vision applications in remote patient monitoring have grown, enabling medical professionals to monitor patients outside conventional hospital settings. The increased focus on telemedicine and virtual healthcare solutions has accelerated this trend.
  • Wearable technology has integrated computer vision capabilities for health monitoring.
  • Smartphone computer vision technology has been used for several healthcare applications, such as vital sign monitoring and helping with vision-related diagnosis.

Key Trends Shaping the Global Computer Vision in Healthcare Market

  • Computer vision analyzes video data to enable remote patient monitoring, allowing medical personnel to evaluate patients' conditions without physically visiting them. It favors expanding telemedicine services, particularly where access to medical resources is scarce.
  • Computer vision assists in finding new drugs by automating the examination of molecular and cellular structures. It helps scientists comprehend intricate biological relationships and find promising therapeutic possibilities.
  • Computer vision technologies are being used to improve the patient experience by facilitating better communication between patients & healthcare professionals and offering individualized care. Applications in this field include facial recognition for patient identification and virtual health aids.

Factors Restraining the Demand for Computer Vision in Healthcare Solutions

  • Using patient information and sensitive medical photos raises privacy and security issues.
  • Ensuring adherence to laws like the Health Insurance Portability and Accountability Act is essential, as violation is expected to result in legal ramifications.
  • Medical imaging data needs to have common formats and protocols, which is set to make it more difficult for various systems and equipment to communicate with one another.
  • Implementing computer vision systems frequently requires a substantial financial commitment. The expenses include developing or buying complex algorithms, hiring staff, and obtaining cutting-edge imaging equipment.

Analysis of Top Countries, Deploying, Certifying, and Utilizing Computer Vision in Healthcare

The table below shows the estimated growth rates of the top five countries. South Korea, the United Kingdom, and Japan are set to record high CAGRs of 37.9%, 37.5%, and 37.2%, respectively, through 2034.

Countries Projected CAGR (2034)
United States 36.8%
United Kingdom 37.5%
China 36.9%
South Korea 37.9%
Japan 37.2%

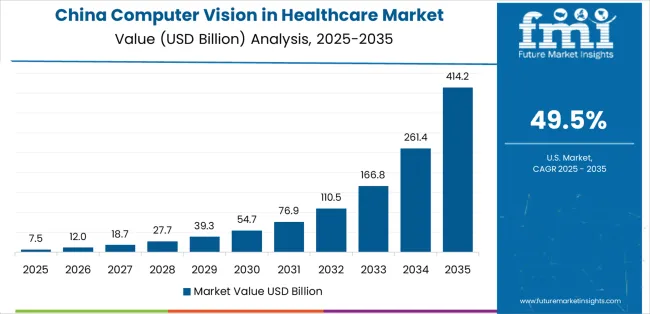
The table below explains the computer vision in the healthcare market size of the leading five countries for 2034. Among them, the United States is anticipated to remain at the forefront by reaching a valuation of USD 9.9 billion. Japan is expected to reach around USD 5.6 billion by 2034, less than China's USD 8.2 billion.

Countries Market Value (2034)
United States USD 9.9 billion
United Kingdom USD 2.2 billion
China USD 8.2 billion
South Korea USD 3.7 billion
Japan USD 5.6 billion

Growth for Companies of Computer Vision in Healthcare in the United States

The United States computer vision in the healthcare industry is poised to exhibit a CAGR of 36.8% during the assessment period. In 2034, the United States market is expected to reach USD 9.9 billion. The key factors supporting the market growth are:

  • Computer vision technologies are widely used in diagnostic and imaging medicine in the United States.
  • Data privacy and security are critical issues in the United States due to the sensitivity of healthcare data, especially medical imaging.
  • The regulatory landscape, including FDA regulation, is a key factor in determining how computer vision technologies are adopted in the healthcare industry of the United States.

Growing Start-ups and Innovation Propelling Demand in China

China is anticipated to rise at a steady CAGR of 36.9% during the forecast period. This is attributable to a combination of factors, including:

  • In China, computer vision is used in surgical operations to give surgeons real-time guidance. Computer vision technologies are increasingly used to guide robotic-assisted operations, improving surgical outcomes.
  • A strong ecosystem of start-ups and leading manufacturers in China focuses on developing and using computer vision solutions in healthcare. These organizations stimulate innovation by introducing novel applications and technologies to the market.

Technological Innovations in Japan Paving the Road for Success

Japan's computer vision in the healthcare market is expected to reach a valuation of around USD 5.6 billion by 2034. Top factors supporting the market expansion in the country include:

  • Integrating computer vision systems with electronic health records (EHR) in Japan’s healthcare sector is gaining traction.
  • Advances in computer vision for healthcare are being fostered in Japan through collaboration between academic centers, research institutes, and healthcare providers.

Rapid Growth of Computer Vision in Healthcare in the United Kingdom

The demand for computer vision in healthcare is increasing in the United Kingdom, with a projected CAGR of 37.5% through 2034. Emerging patterns in the United Kingdom’s market are as follows:

  • Seamless integration into computer vision systems and healthcare workflow guarantees the accessibility and usefulness of the insights produced by computer vision technology.
  • The COVID-19 epidemic has contributed to a notable increase in telemedicine and remote patient monitoring in the United Kingdom.
  • Computer vision technologies enable visual data analysis for remote patient monitoring, contributing to remote healthcare.

Rising Presence of Local and Foreign Manufacturers to Surge Sales in South Korea

The computer vision in healthcare market is projected to increase in South Korea at a CAGR of 37.9% through 2034. The factors driving the market growth are as follows:

  • The healthcare industry in South Korea is competitive, with both local and foreign companies providing computer vision solutions.
  • Innovation and the creation of cutting-edge technology suited to the demands of the market are fueled by this competition.

Computer Vision in Healthcare Industry Analysis by Top Investment Segments

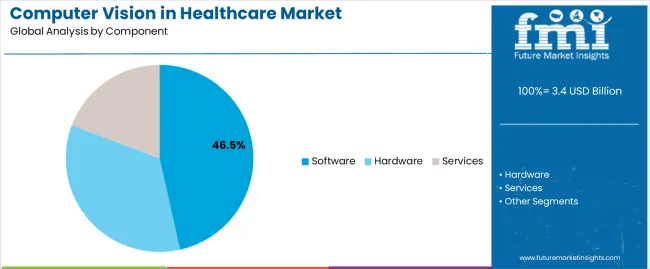
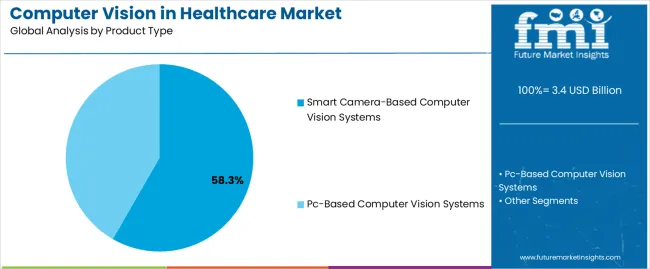
The section below shows the hardware segment dominated by components. It is predicted to surge at a CAGR of 36.5% by 2034. Based on product type, the smart camera-based computer vision systems segment is anticipated to generate a dominant share through 2024. It is set to rise at 36.4% CAGR by 2034.

Segment Projected CAGR (2034)
Hardware (Component) 36.5%
Smart Camera-based Computer Vision Systems (Product Type) 36.4%

Hardware Segment Tops the Component Category

Based on components, demand for hardware is expected to remain high during the valuation period.

  • Advanced imaging devices and sensors are the essential hardware components in the healthcare computer vision sector.
  • Hardware technology is always improving, which leads to better image quality and diagnostic capabilities.
  • Medical imaging devices such as CT scans, MRIs, and X-rays are crucial to the healthcare industry. Hardware components play a key role in these systems' ability to take and process images, which is necessary for diagnosis and treatment planning.
  • Wearable technology with computer vision capabilities is gaining traction in the healthcare sector, allowing for patient health monitoring.

Adoption of Smart Camera-based Computer Vision Systems to Surge Through 2034

Based on product type, smart camera-based computer vision systems are expected to surge at 36.4% CAGR by 2034.

  • The open-embedded processing technology in smart camera-based computer vision systems eliminates the need for external devices such as frame-capture cards or external computers.
  • Smart camera-based computer vision system’s growth is ascribed to its affordability, small size, and straightforward computer vision system integration using smart cameras.

Leading Suppliers of Computer Vision in Healthcare Technologies

Leading companies have increased their market share primarily through product launches and developments, which are followed by expansions, mergers & acquisitions, contracts, agreements, partnerships, and collaborations. Key companies are employing several strategies to improve market penetration and strengthen their position in the cutthroat sector.

For instance:

  • In May 2023, Landing AI unveiled its LandingLens platform's validation-ready iteration.
  • In 2023, NVIDIA announced the launch of the Next-Generation GH200 Grace Hopper Superchip Platform for the accelerated generative AI era and computing.
  • In 2023, Google unveiled Projectd IDX, an AI-based browser.

Key Players and Market Concentration in the Global Computer Vision in Healthcare Industry

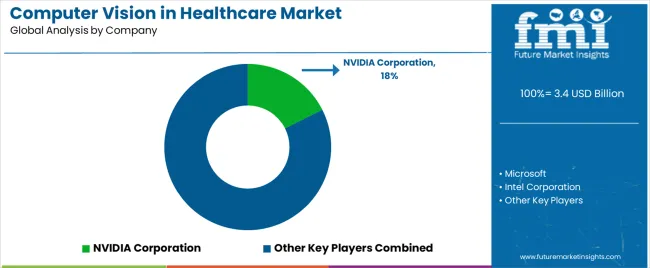
  • NVIDIA Corporation
  • Microsoft
  • Intel Corporation
  • IBM Corporation
  • Google LLC
  • Basler AG
  • Arterys Inc.
  • AiCure
  • iCAD, Inc.
  • SenseTime

Analysis of Key Product Categories in the Computer Vision in Healthcare Market

By Component:

  • Hardware
  • Software
  • Services

By Product Type:

  • Smart Camera-based Computer Vision Systems
  • PC-based Computer Vision Systems

By Application:

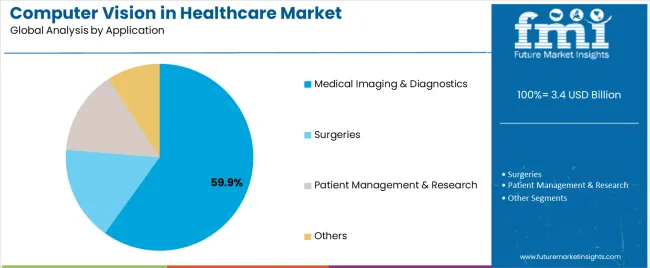
  • Medical Imaging & Diagnostics
  • Surgeries
  • Patient Management & Research
  • Others

By End-user:

  • Healthcare Providers
  • Diagnostic Centers
  • Academic Research Institutes
  • Others

By Region:

  • North America
  • Latin America
  • Europe
  • East Asia
  • South Asia
  • Oceania
  • Middle East and Africa

Table of Content

  • 1. Executive Summary
  • 2. Market Overview
  • 3. Market Background
  • 4. Global Market Analysis 2019 to 2023 and Forecast, 2024 to 2034
  • 5. Global Market Analysis 2019 to 2023 and Forecast 2024 to 2034, By Component
    • 5.1. Hardware
    • 5.2. Software
    • 5.3. Services
  • 6. Global Market Analysis 2019 to 2023 and Forecast 2024 to 2034, By Product Type
    • 6.1. Smart Camera-based Computer Vision Systems
    • 6.2. PC-based Computer Vision Systems
  • 7. Global Market Analysis 2019 to 2023 and Forecast 2024 to 2034, By Application
    • 7.1. Medical Imaging and Diagnostics
    • 7.2. Surgeries
    • 7.3. Patient Management and Research
    • 7.4. Others
  • 8. Global Market Analysis 2019 to 2023 and Forecast 2024 to 2034, By End-user
    • 8.1. Healthcare Providers
    • 8.2. Diagnostic Centers
    • 8.3. Academic Research Institutes
    • 8.4. Others
  • 9. Global Market Analysis 2019 to 2023 and Forecast 2024 to 2034, By Region
    • 9.1. North America
    • 9.2. Latin America
    • 9.3. Western Europe
    • 9.4. Eastern Europe
    • 9.5. South Asia and Pacific
    • 9.6. East Asia
    • 9.7. Middle East and Africa
  • 10. North America Market Analysis 2019 to 2023 and Forecast 2024 to 2034, By Country
  • 11. Latin America Market Analysis 2019 to 2023 and Forecast 2024 to 2034, By Country
  • 12. Western Europe Market Analysis 2019 to 2023 and Forecast 2024 to 2034, By Country
  • 13. Eastern Europe Market Analysis 2019 to 2023 and Forecast 2024 to 2034, By Country
  • 14. South Asia and Pacific Market Analysis 2019 to 2023 and Forecast 2024 to 2034, By Country
  • 15. East Asia Market Analysis 2019 to 2023 and Forecast 2024 to 2034, By Country
  • 16. Middle East and Africa Market Analysis 2019 to 2023 and Forecast 2024 to 2034, By Country
  • 17. Key Countries Market Analysis
  • 18. Market Structure Analysis
  • 19. Competition Analysis
    • 19.1. NVIDIA Corporation
    • 19.2. Microsoft
    • 19.3. Intel Corporation
    • 19.4. IBM Corporation
    • 19.5. Google LLC
    • 19.6. Basler AG
    • 19.7. Arterys Inc.
    • 19.8. AiCure
    • 19.9. iCAD, Inc.
    • 19.10. SenseTime
  • 20. Assumptions & Acronyms Used
  • 21. Research Methodology

List of Tables

Table 1: Global Market Value (US$ billion) Forecast by Region, 2019 to 2034

Table 2: Global Market Value (US$ billion) Forecast by Component, 2019 to 2034

Table 3: Global Market Value (US$ billion) Forecast by Product Type, 2019 to 2034

Table 4: Global Market Value (US$ billion) Forecast by Application, 2019 to 2034

Table 5: Global Market Value (US$ billion) Forecast by End-user, 2019 to 2034

Table 6: North America Market Value (US$ billion) Forecast by Country, 2019 to 2034

Table 7: North America Market Value (US$ billion) Forecast by Component, 2019 to 2034

Table 8: North America Market Value (US$ billion) Forecast by Product Type, 2019 to 2034

Table 9: North America Market Value (US$ billion) Forecast by Application, 2019 to 2034

Table 10: North America Market Value (US$ billion) Forecast by End-user, 2019 to 2034

Table 11: Latin America Market Value (US$ billion) Forecast by Country, 2019 to 2034

Table 12: Latin America Market Value (US$ billion) Forecast by Component, 2019 to 2034

Table 13: Latin America Market Value (US$ billion) Forecast by Product Type, 2019 to 2034

Table 14: Latin America Market Value (US$ billion) Forecast by Application, 2019 to 2034

Table 15: Latin America Market Value (US$ billion) Forecast by End-user, 2019 to 2034

Table 16: Western Europe Market Value (US$ billion) Forecast by Country, 2019 to 2034

Table 17: Western Europe Market Value (US$ billion) Forecast by Component, 2019 to 2034

Table 18: Western Europe Market Value (US$ billion) Forecast by Product Type, 2019 to 2034

Table 19: Western Europe Market Value (US$ billion) Forecast by Application, 2019 to 2034

Table 20: Western Europe Market Value (US$ billion) Forecast by End-user, 2019 to 2034

Table 21: Eastern Europe Market Value (US$ billion) Forecast by Country, 2019 to 2034

Table 22: Eastern Europe Market Value (US$ billion) Forecast by Component, 2019 to 2034

Table 23: Eastern Europe Market Value (US$ billion) Forecast by Product Type, 2019 to 2034

Table 24: Eastern Europe Market Value (US$ billion) Forecast by Application, 2019 to 2034

Table 25: Eastern Europe Market Value (US$ billion) Forecast by End-user, 2019 to 2034

Table 26: South Asia and Pacific Market Value (US$ billion) Forecast by Country, 2019 to 2034

Table 27: South Asia and Pacific Market Value (US$ billion) Forecast by Component, 2019 to 2034

Table 28: South Asia and Pacific Market Value (US$ billion) Forecast by Product Type, 2019 to 2034

Table 29: South Asia and Pacific Market Value (US$ billion) Forecast by Application, 2019 to 2034

Table 30: South Asia and Pacific Market Value (US$ billion) Forecast by End-user, 2019 to 2034

Table 31: East Asia Market Value (US$ billion) Forecast by Country, 2019 to 2034

Table 32: East Asia Market Value (US$ billion) Forecast by Component, 2019 to 2034

Table 33: East Asia Market Value (US$ billion) Forecast by Product Type, 2019 to 2034

Table 34: East Asia Market Value (US$ billion) Forecast by Application, 2019 to 2034

Table 35: East Asia Market Value (US$ billion) Forecast by End-user, 2019 to 2034

Table 36: Middle East and Africa Market Value (US$ billion) Forecast by Country, 2019 to 2034

Table 37: Middle East and Africa Market Value (US$ billion) Forecast by Component, 2019 to 2034

Table 38: Middle East and Africa Market Value (US$ billion) Forecast by Product Type, 2019 to 2034

Table 39: Middle East and Africa Market Value (US$ billion) Forecast by Application, 2019 to 2034

Table 40: Middle East and Africa Market Value (US$ billion) Forecast by End-user, 2019 to 2034

List of Figures

Figure 1: Global Market Value (US$ billion) by Component, 2024 to 2034

Figure 2: Global Market Value (US$ billion) by Product Type, 2024 to 2034

Figure 3: Global Market Value (US$ billion) by Application, 2024 to 2034

Figure 4: Global Market Value (US$ billion) by End-user, 2024 to 2034

Figure 5: Global Market Value (US$ billion) by Region, 2024 to 2034

Figure 6: Global Market Value (US$ billion) Analysis by Region, 2019 to 2034

Figure 7: Global Market Value Share (%) and BPS Analysis by Region, 2024 to 2034

Figure 8: Global Market Y-o-Y Growth (%) Projections by Region, 2024 to 2034

Figure 9: Global Market Value (US$ billion) Analysis by Component, 2019 to 2034

Figure 10: Global Market Value Share (%) and BPS Analysis by Component, 2024 to 2034

Figure 11: Global Market Y-o-Y Growth (%) Projections by Component, 2024 to 2034

Figure 12: Global Market Value (US$ billion) Analysis by Product Type, 2019 to 2034

Figure 13: Global Market Value Share (%) and BPS Analysis by Product Type, 2024 to 2034

Figure 14: Global Market Y-o-Y Growth (%) Projections by Product Type, 2024 to 2034

Figure 15: Global Market Value (US$ billion) Analysis by Application, 2019 to 2034

Figure 16: Global Market Value Share (%) and BPS Analysis by Application, 2024 to 2034

Figure 17: Global Market Y-o-Y Growth (%) Projections by Application, 2024 to 2034

Figure 18: Global Market Value (US$ billion) Analysis by End-user, 2019 to 2034

Figure 19: Global Market Value Share (%) and BPS Analysis by End-user, 2024 to 2034

Figure 20: Global Market Y-o-Y Growth (%) Projections by End-user, 2024 to 2034

Figure 21: Global Market Attractiveness by Component, 2024 to 2034

Figure 22: Global Market Attractiveness by Product Type, 2024 to 2034

Figure 23: Global Market Attractiveness by Application, 2024 to 2034

Figure 24: Global Market Attractiveness by End-user, 2024 to 2034

Figure 25: Global Market Attractiveness by Region, 2024 to 2034

Figure 26: North America Market Value (US$ billion) by Component, 2024 to 2034

Figure 27: North America Market Value (US$ billion) by Product Type, 2024 to 2034

Figure 28: North America Market Value (US$ billion) by Application, 2024 to 2034

Figure 29: North America Market Value (US$ billion) by End-user, 2024 to 2034

Figure 30: North America Market Value (US$ billion) by Country, 2024 to 2034

Figure 31: North America Market Value (US$ billion) Analysis by Country, 2019 to 2034

Figure 32: North America Market Value Share (%) and BPS Analysis by Country, 2024 to 2034

Figure 33: North America Market Y-o-Y Growth (%) Projections by Country, 2024 to 2034

Figure 34: North America Market Value (US$ billion) Analysis by Component, 2019 to 2034

Figure 35: North America Market Value Share (%) and BPS Analysis by Component, 2024 to 2034

Figure 36: North America Market Y-o-Y Growth (%) Projections by Component, 2024 to 2034

Figure 37: North America Market Value (US$ billion) Analysis by Product Type, 2019 to 2034

Figure 38: North America Market Value Share (%) and BPS Analysis by Product Type, 2024 to 2034

Figure 39: North America Market Y-o-Y Growth (%) Projections by Product Type, 2024 to 2034

Figure 40: North America Market Value (US$ billion) Analysis by Application, 2019 to 2034

Figure 41: North America Market Value Share (%) and BPS Analysis by Application, 2024 to 2034

Figure 42: North America Market Y-o-Y Growth (%) Projections by Application, 2024 to 2034

Figure 43: North America Market Value (US$ billion) Analysis by End-user, 2019 to 2034

Figure 44: North America Market Value Share (%) and BPS Analysis by End-user, 2024 to 2034

Figure 45: North America Market Y-o-Y Growth (%) Projections by End-user, 2024 to 2034

Figure 46: North America Market Attractiveness by Component, 2024 to 2034

Figure 47: North America Market Attractiveness by Product Type, 2024 to 2034

Figure 48: North America Market Attractiveness by Application, 2024 to 2034

Figure 49: North America Market Attractiveness by End-user, 2024 to 2034

Figure 50: North America Market Attractiveness by Country, 2024 to 2034

Figure 51: Latin America Market Value (US$ billion) by Component, 2024 to 2034

Figure 52: Latin America Market Value (US$ billion) by Product Type, 2024 to 2034

Figure 53: Latin America Market Value (US$ billion) by Application, 2024 to 2034

Figure 54: Latin America Market Value (US$ billion) by End-user, 2024 to 2034

Figure 55: Latin America Market Value (US$ billion) by Country, 2024 to 2034

Figure 56: Latin America Market Value (US$ billion) Analysis by Country, 2019 to 2034

Figure 57: Latin America Market Value Share (%) and BPS Analysis by Country, 2024 to 2034

Figure 58: Latin America Market Y-o-Y Growth (%) Projections by Country, 2024 to 2034

Figure 59: Latin America Market Value (US$ billion) Analysis by Component, 2019 to 2034

Figure 60: Latin America Market Value Share (%) and BPS Analysis by Component, 2024 to 2034

Figure 61: Latin America Market Y-o-Y Growth (%) Projections by Component, 2024 to 2034

Figure 62: Latin America Market Value (US$ billion) Analysis by Product Type, 2019 to 2034

Figure 63: Latin America Market Value Share (%) and BPS Analysis by Product Type, 2024 to 2034

Figure 64: Latin America Market Y-o-Y Growth (%) Projections by Product Type, 2024 to 2034

Figure 65: Latin America Market Value (US$ billion) Analysis by Application, 2019 to 2034

Figure 66: Latin America Market Value Share (%) and BPS Analysis by Application, 2024 to 2034

Figure 67: Latin America Market Y-o-Y Growth (%) Projections by Application, 2024 to 2034

Figure 68: Latin America Market Value (US$ billion) Analysis by End-user, 2019 to 2034

Figure 69: Latin America Market Value Share (%) and BPS Analysis by End-user, 2024 to 2034

Figure 70: Latin America Market Y-o-Y Growth (%) Projections by End-user, 2024 to 2034

Figure 71: Latin America Market Attractiveness by Component, 2024 to 2034

Figure 72: Latin America Market Attractiveness by Product Type, 2024 to 2034

Figure 73: Latin America Market Attractiveness by Application, 2024 to 2034

Figure 74: Latin America Market Attractiveness by End-user, 2024 to 2034

Figure 75: Latin America Market Attractiveness by Country, 2024 to 2034

Figure 76: Western Europe Market Value (US$ billion) by Component, 2024 to 2034

Figure 77: Western Europe Market Value (US$ billion) by Product Type, 2024 to 2034

Figure 78: Western Europe Market Value (US$ billion) by Application, 2024 to 2034

Figure 79: Western Europe Market Value (US$ billion) by End-user, 2024 to 2034

Figure 80: Western Europe Market Value (US$ billion) by Country, 2024 to 2034

Figure 81: Western Europe Market Value (US$ billion) Analysis by Country, 2019 to 2034

Figure 82: Western Europe Market Value Share (%) and BPS Analysis by Country, 2024 to 2034

Figure 83: Western Europe Market Y-o-Y Growth (%) Projections by Country, 2024 to 2034

Figure 84: Western Europe Market Value (US$ billion) Analysis by Component, 2019 to 2034

Figure 85: Western Europe Market Value Share (%) and BPS Analysis by Component, 2024 to 2034

Figure 86: Western Europe Market Y-o-Y Growth (%) Projections by Component, 2024 to 2034

Figure 87: Western Europe Market Value (US$ billion) Analysis by Product Type, 2019 to 2034

Figure 88: Western Europe Market Value Share (%) and BPS Analysis by Product Type, 2024 to 2034

Figure 89: Western Europe Market Y-o-Y Growth (%) Projections by Product Type, 2024 to 2034

Figure 90: Western Europe Market Value (US$ billion) Analysis by Application, 2019 to 2034

Figure 91: Western Europe Market Value Share (%) and BPS Analysis by Application, 2024 to 2034

Figure 92: Western Europe Market Y-o-Y Growth (%) Projections by Application, 2024 to 2034

Figure 93: Western Europe Market Value (US$ billion) Analysis by End-user, 2019 to 2034

Figure 94: Western Europe Market Value Share (%) and BPS Analysis by End-user, 2024 to 2034

Figure 95: Western Europe Market Y-o-Y Growth (%) Projections by End-user, 2024 to 2034

Figure 96: Western Europe Market Attractiveness by Component, 2024 to 2034

Figure 97: Western Europe Market Attractiveness by Product Type, 2024 to 2034

Figure 98: Western Europe Market Attractiveness by Application, 2024 to 2034

Figure 99: Western Europe Market Attractiveness by End-user, 2024 to 2034

Figure 100: Western Europe Market Attractiveness by Country, 2024 to 2034

Figure 101: Eastern Europe Market Value (US$ billion) by Component, 2024 to 2034

Figure 102: Eastern Europe Market Value (US$ billion) by Product Type, 2024 to 2034

Figure 103: Eastern Europe Market Value (US$ billion) by Application, 2024 to 2034

Figure 104: Eastern Europe Market Value (US$ billion) by End-user, 2024 to 2034

Figure 105: Eastern Europe Market Value (US$ billion) by Country, 2024 to 2034

Figure 106: Eastern Europe Market Value (US$ billion) Analysis by Country, 2019 to 2034

Figure 107: Eastern Europe Market Value Share (%) and BPS Analysis by Country, 2024 to 2034

Figure 108: Eastern Europe Market Y-o-Y Growth (%) Projections by Country, 2024 to 2034

Figure 109: Eastern Europe Market Value (US$ billion) Analysis by Component, 2019 to 2034

Figure 110: Eastern Europe Market Value Share (%) and BPS Analysis by Component, 2024 to 2034

Figure 111: Eastern Europe Market Y-o-Y Growth (%) Projections by Component, 2024 to 2034

Figure 112: Eastern Europe Market Value (US$ billion) Analysis by Product Type, 2019 to 2034

Figure 113: Eastern Europe Market Value Share (%) and BPS Analysis by Product Type, 2024 to 2034

Figure 114: Eastern Europe Market Y-o-Y Growth (%) Projections by Product Type, 2024 to 2034

Figure 115: Eastern Europe Market Value (US$ billion) Analysis by Application, 2019 to 2034

Figure 116: Eastern Europe Market Value Share (%) and BPS Analysis by Application, 2024 to 2034

Figure 117: Eastern Europe Market Y-o-Y Growth (%) Projections by Application, 2024 to 2034

Figure 118: Eastern Europe Market Value (US$ billion) Analysis by End-user, 2019 to 2034

Figure 119: Eastern Europe Market Value Share (%) and BPS Analysis by End-user, 2024 to 2034

Figure 120: Eastern Europe Market Y-o-Y Growth (%) Projections by End-user, 2024 to 2034

Figure 121: Eastern Europe Market Attractiveness by Component, 2024 to 2034

Figure 122: Eastern Europe Market Attractiveness by Product Type, 2024 to 2034

Figure 123: Eastern Europe Market Attractiveness by Application, 2024 to 2034

Figure 124: Eastern Europe Market Attractiveness by End-user, 2024 to 2034

Figure 125: Eastern Europe Market Attractiveness by Country, 2024 to 2034

Figure 126: South Asia and Pacific Market Value (US$ billion) by Component, 2024 to 2034

Figure 127: South Asia and Pacific Market Value (US$ billion) by Product Type, 2024 to 2034

Figure 128: South Asia and Pacific Market Value (US$ billion) by Application, 2024 to 2034

Figure 129: South Asia and Pacific Market Value (US$ billion) by End-user, 2024 to 2034

Figure 130: South Asia and Pacific Market Value (US$ billion) by Country, 2024 to 2034

Figure 131: South Asia and Pacific Market Value (US$ billion) Analysis by Country, 2019 to 2034

Figure 132: South Asia and Pacific Market Value Share (%) and BPS Analysis by Country, 2024 to 2034

Figure 133: South Asia and Pacific Market Y-o-Y Growth (%) Projections by Country, 2024 to 2034

Figure 134: South Asia and Pacific Market Value (US$ billion) Analysis by Component, 2019 to 2034

Figure 135: South Asia and Pacific Market Value Share (%) and BPS Analysis by Component, 2024 to 2034

Figure 136: South Asia and Pacific Market Y-o-Y Growth (%) Projections by Component, 2024 to 2034

Figure 137: South Asia and Pacific Market Value (US$ billion) Analysis by Product Type, 2019 to 2034

Figure 138: South Asia and Pacific Market Value Share (%) and BPS Analysis by Product Type, 2024 to 2034

Figure 139: South Asia and Pacific Market Y-o-Y Growth (%) Projections by Product Type, 2024 to 2034

Figure 140: South Asia and Pacific Market Value (US$ billion) Analysis by Application, 2019 to 2034

Figure 141: South Asia and Pacific Market Value Share (%) and BPS Analysis by Application, 2024 to 2034

Figure 142: South Asia and Pacific Market Y-o-Y Growth (%) Projections by Application, 2024 to 2034

Figure 143: South Asia and Pacific Market Value (US$ billion) Analysis by End-user, 2019 to 2034

Figure 144: South Asia and Pacific Market Value Share (%) and BPS Analysis by End-user, 2024 to 2034

Figure 145: South Asia and Pacific Market Y-o-Y Growth (%) Projections by End-user, 2024 to 2034

Figure 146: South Asia and Pacific Market Attractiveness by Component, 2024 to 2034

Figure 147: South Asia and Pacific Market Attractiveness by Product Type, 2024 to 2034

Figure 148: South Asia and Pacific Market Attractiveness by Application, 2024 to 2034

Figure 149: South Asia and Pacific Market Attractiveness by End-user, 2024 to 2034

Figure 150: South Asia and Pacific Market Attractiveness by Country, 2024 to 2034

Figure 151: East Asia Market Value (US$ billion) by Component, 2024 to 2034

Figure 152: East Asia Market Value (US$ billion) by Product Type, 2024 to 2034

Figure 153: East Asia Market Value (US$ billion) by Application, 2024 to 2034

Figure 154: East Asia Market Value (US$ billion) by End-user, 2024 to 2034

Figure 155: East Asia Market Value (US$ billion) by Country, 2024 to 2034

Figure 156: East Asia Market Value (US$ billion) Analysis by Country, 2019 to 2034

Figure 157: East Asia Market Value Share (%) and BPS Analysis by Country, 2024 to 2034

Figure 158: East Asia Market Y-o-Y Growth (%) Projections by Country, 2024 to 2034

Figure 159: East Asia Market Value (US$ billion) Analysis by Component, 2019 to 2034

Figure 160: East Asia Market Value Share (%) and BPS Analysis by Component, 2024 to 2034

Figure 161: East Asia Market Y-o-Y Growth (%) Projections by Component, 2024 to 2034

Figure 162: East Asia Market Value (US$ billion) Analysis by Product Type, 2019 to 2034

Figure 163: East Asia Market Value Share (%) and BPS Analysis by Product Type, 2024 to 2034

Figure 164: East Asia Market Y-o-Y Growth (%) Projections by Product Type, 2024 to 2034

Figure 165: East Asia Market Value (US$ billion) Analysis by Application, 2019 to 2034

Figure 166: East Asia Market Value Share (%) and BPS Analysis by Application, 2024 to 2034

Figure 167: East Asia Market Y-o-Y Growth (%) Projections by Application, 2024 to 2034

Figure 168: East Asia Market Value (US$ billion) Analysis by End-user, 2019 to 2034

Figure 169: East Asia Market Value Share (%) and BPS Analysis by End-user, 2024 to 2034

Figure 170: East Asia Market Y-o-Y Growth (%) Projections by End-user, 2024 to 2034

Figure 171: East Asia Market Attractiveness by Component, 2024 to 2034

Figure 172: East Asia Market Attractiveness by Product Type, 2024 to 2034

Figure 173: East Asia Market Attractiveness by Application, 2024 to 2034

Figure 174: East Asia Market Attractiveness by End-user, 2024 to 2034

Figure 175: East Asia Market Attractiveness by Country, 2024 to 2034

Figure 176: Middle East and Africa Market Value (US$ billion) by Component, 2024 to 2034

Figure 177: Middle East and Africa Market Value (US$ billion) by Product Type, 2024 to 2034

Figure 178: Middle East and Africa Market Value (US$ billion) by Application, 2024 to 2034

Figure 179: Middle East and Africa Market Value (US$ billion) by End-user, 2024 to 2034

Figure 180: Middle East and Africa Market Value (US$ billion) by Country, 2024 to 2034

Figure 181: Middle East and Africa Market Value (US$ billion) Analysis by Country, 2019 to 2034

Figure 182: Middle East and Africa Market Value Share (%) and BPS Analysis by Country, 2024 to 2034

Figure 183: Middle East and Africa Market Y-o-Y Growth (%) Projections by Country, 2024 to 2034

Figure 184: Middle East and Africa Market Value (US$ billion) Analysis by Component, 2019 to 2034

Figure 185: Middle East and Africa Market Value Share (%) and BPS Analysis by Component, 2024 to 2034

Figure 186: Middle East and Africa Market Y-o-Y Growth (%) Projections by Component, 2024 to 2034

Figure 187: Middle East and Africa Market Value (US$ billion) Analysis by Product Type, 2019 to 2034

Figure 188: Middle East and Africa Market Value Share (%) and BPS Analysis by Product Type, 2024 to 2034

Figure 189: Middle East and Africa Market Y-o-Y Growth (%) Projections by Product Type, 2024 to 2034

Figure 190: Middle East and Africa Market Value (US$ billion) Analysis by Application, 2019 to 2034

Figure 191: Middle East and Africa Market Value Share (%) and BPS Analysis by Application, 2024 to 2034

Figure 192: Middle East and Africa Market Y-o-Y Growth (%) Projections by Application, 2024 to 2034

Figure 193: Middle East and Africa Market Value (US$ billion) Analysis by End-user, 2019 to 2034

Figure 194: Middle East and Africa Market Value Share (%) and BPS Analysis by End-user, 2024 to 2034

Figure 195: Middle East and Africa Market Y-o-Y Growth (%) Projections by End-user, 2024 to 2034

Figure 196: Middle East and Africa Market Attractiveness by Component, 2024 to 2034

Figure 197: Middle East and Africa Market Attractiveness by Product Type, 2024 to 2034

Figure 198: Middle East and Africa Market Attractiveness by Application, 2024 to 2034

Figure 199: Middle East and Africa Market Attractiveness by End-user, 2024 to 2034

Figure 200: Middle East and Africa Market Attractiveness by Country, 2024 to 2034

Frequently Asked Questions

How big is computer vision in the healthcare market?

The market is set to reach USD 2.5 billion in 2024.

What is the forecast for computer vision in the healthcare market?

Demand for computer vision in healthcare is slated to expand at a 36.7% CAGR by 2034.

What is the outlook for computer vision in the healthcare market?

The market is expected to reach USD 56.1 billion in 2034.

Who are the key players in computer vision in the healthcare market?

NVIDIA Corporation, Microsoft, and Intel Corporation are the key players.

Which component would lead to computer vision in the healthcare market?

Hardware is estimated to hold a significant market share in 2024.

Explore Healthcare IT Insights

Future Market Insights

Computer Vision in Healthcare Market