Reports

- Global Locations -

Headquarters

Future Market Insights, Inc.

Christiana Corporate, 200
Continental Drive, Suite 401,
Newark, Delaware - 19713,
United States

T: +1-845-579-5705

Americas

Future Market Insights, Inc.

616 Corporate Way, Suite 2-9018,
Valley Cottage, NY 10989, United States

T: +1-347-918-3531

MEA

Future Market Insights

1602-6 Jumeirah Bay X2 Tower, Plot No: JLT-PH2-X2A,
Jumeirah Lakes Towers, Dubai,
United Arab Emirates

Europe

Future Market Insights

3rd Floor, 207 Regent Street,
W1B 3HH London
United Kingdom

T: + 44 (0) 20 8123 9659
D: +44 (0) 20 3287 4268

Asia Pacific

Future Market Insights

IndiaLand Global Tech Park, Unit UG-1, Behind Grand HighStreet, Phase 1, Hinjawadi, MH, Pune – 411057, India

Brain Implants Market Outlook (2022 – 2032)

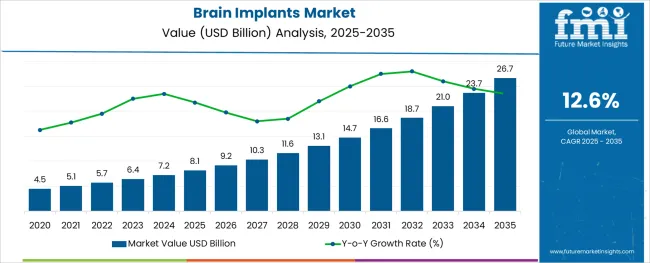
[250 Pages Report] Global brain implants market worth is expected to rise at a CAGR of 12.3% to US$ 18 Billion by 2032, supported by:

  • Rising reports of nervous system cancer among the general mass
  • Increasing geriatric population in developed countries, particularly in the US.
  • Integration of modern technologies to make brain implants single-patient oriented.

Globally, there were approximately 308,102 cases reported of brain and nervous system cancer in 2020, according to statistics from GLOBOCAN 2020. Manifestations for cranial abnormalities include trauma, malignant tumours, external decompression of intracranial hypertension, and congenital deformities. The rise in such disorders has presented new opportunities for the brain implant market players that can be instrumental for the further development of the technology and its adoption.

Attributes Details
Brain Implants Market CAGR (2022 - 2032) 12.3%
Brain Implants Market Size (2022) US$ 5.7 Billion
Brain Implants Market Size (2032) US$ 18 Billion
USA Market CAGR (2022 - 2032) 12.6%
Key Companies Covered
  • Abbott Laboratories
  • Medtronic PLC
  • NeuroPace Incorporation
  • Nevro Corporation
  • Aleva Neurotherapeutics SA
  • Synapse Biomedical Incorporation
  • Boston Scientific Corporation
  • Sapiens Neuro
  • Edwards Lifesciences Corporation

Though the increase in the population of older people is the major reason for the deployment of brain implants, in recent years, children have been observed in need of this technology in higher amounts. One of the most prevalent birth defects in infants, craniosynostosis, which often manifests during the infancy or first year of life, is what needs to be properly monitored and is achieved by brain implants.

Additionally, regenerative medicine improvements are being supported by the adoption of technological developments like computer-aided design and 3D printed products. Today, patient-specific implants made from a range of polymer, ceramic, or metal components may be 3D printed, which has substantially brought down the manufacturing cost of microchips.

Don't pay for what you don't need

Customize your report by selecting specific countries or regions and save 30%!

Opportunities and Efforts by Market Participants

Key players are focussing on marketing the implants that can be customized according to the patient's anatomy and have benefits, including offering exactly restored shapes, which produce superior cosmetic outcomes. This is crucial for addressing the major flaws in particular and is anticipated to generate higher demand for brain implants in the coming years. Secondly, because insertion of the implant takes less time with tailored implants, operating room time is reduced and is expected to provide some better brain implant market opportunities.

The very first human brain-computer interface (BCI) implantation in the United States was announced by Synchron in July 2022. This method, which is the first to use an endovascular BCI approach and does not necessitate invasive open-brain surgery, marks a key technological milestone for scalable BCI devices. As the United States is the country with the most demand for brain implants any advancement in this sector is expected to be a major success in this region and become a lucrative opportunity for the market participants in the following years.

Clinical studies of implanting brain chips in people to enable thought-to-thought communication with computers were launched by Elon Musk's Neuralink in January 2022. This development is poised to be a watershed movement for all the brain implants market players, as a substantial amount of money has already been invested for this purpose. However, this technology is yet to be marketed, giving some leeway for smaller players involved in the brain implants business to promote the conventional technology.

Until now, the massive prices of implantation and procedures involved in it have restricted the growth of the market in third-world economies. Moreover, the danger involved with surgical operations and the lack of the necessary healthcare infrastructure and qualified experts in emerging nations may, however, prove to be major growth barriers for the market for brain or cranial implants.

Also, after sensing the necessity for regular maintenance of implanted chips and recognizing any side-effects arising therein, many prominent brain implants market players have come up with new models of business by integrating services for it. And the new start-ups that have entered the market recently are also vying to capitalize on this particular front of the global brain implants market.

Revenue Of Brain Implants Market From 2017 To 2021 Compared To Demand Outlook For 2022 To 2032

As per the Global Brain Implants Market research by Future Market Insights - a market research and competitive intelligence provider, historically, from 2017 to 2021, market value of the Brain Implants Market increased at around 10.1% CAGR.

The key revenue drivers which affected the Brain Implants Market are increase in the awareness among individuals regarding mental health, lifestyle, rise in the number of various neurological ailments like depression, anxiety, chronic pain, epilepsy, Alzheimer’s, Parkinson’s, etc. In 2020, the chronic pain sector dominated the brain implant therapeutics market, accounting for 58.8 percent of total revenue.

Rising consciousness among the public, technological advancements like BCIs (Brain-Computer Interfaces), which are implanted into the brain and use microscopic electrodes to track the activity of neurons, boost the demand for advanced brain implants. With such a huge population belonging to the aging category, they are more prone to the diseases like Parkinson’s, leading to a high brain implants market demand.

Brain Implant treatment will continue to see rising trend in demand as they could be used as a source to relieve chronic pain and enhance body movements. And also, to improve the patient’s mobility, technologies for brain implants such as motor neuron prostheses, Brain Computer Interfaces and micro electrode arrays will be extensively used in the near future. Besides, brain implants for seizures is also expected to grow in the years to come.

Sabyasachi Ghosh
Sabyasachi Ghosh

Principal Consultant

Talk to Analyst

Find your sweet spots for generating winning opportunities in this market.

What Factors Are Propelling Brain Implants Demand?

The rising numbers of neurological ailments contributes to the growth of brain implant surgery. These disorders have heightened the clinical need for long term alternatives like spinal cord stimulators and deep brain stimulators. The emergence of stress related and obesity related depression is also rising all over the world.

Due to these reasons, advanced brain implants technologies have been shown to play a significant role in giving depression treatment options. These diseases fuel the growth of global market for brain implant.

The inception of Magnetic Resonance Imaging(MRI) and Neurowave Medical Technologies are expected to shape up the market. To increase the patient’s mobility, technologies such as motor neuron prostheses, Brain Computer Interfaces (BCI) and micro electrode arrays are used.

What Could Be The Most Serious Issue With Brain Implantation In The Future?

Americans are far more likely to voice reservations about implanting computer chips in human brains than to express enthusiasm for the notion. The brain implant chip manufacturers are also exerting their efforts to bring more technologically advanced solutions. And roughly twice of them have opinion that they would not be willing to utilize this technology among them as those who say they would.

Furthermore, adults in the United States are likewise more inclined to view this form of technology as morally undesirable, while many are unsure about the moral implications. There are significant variances in religious organizations’ perspectives on this technology. Americans with strong religious devotion, including those who believe in gene editing, are more inclined to perceive such a device as "meddling with nature."

Get the data you need at a Fraction of the cost

Personalize your report by choosing insights you need
and save 40%!

Region-Wise Insights

Which Region is projected to Offer the Largest Brain Implants Market Opportunity?

During the projection period, North American Brain Implants Market is predicted to be the leading market for Brain Implants. According to the reports presented by Alzheimer’s disease Facts and Figures, with the increase in the number of senior citizens in the United States, the number of new and current instances of Alzheimer's disease will also surge.

Unless medical breakthroughs to prevent, halt, or cure Alzheimer's disease are developed, the number of persons aged 65 and older with Alzheimer's disease is expected to rise to 12.7 Mn by 2050.

In addition, a rise in government spending and programs on rising awareness of motion disorders are projected to boost demand for brain implant devices in the region. The Parkinson's Foundation, for example, invested US$ 3.5 Mn in 2020 to sponsor over 34 Parkinson's disease research initiatives. These factors are likely to increase the demand for brain implants in the region.
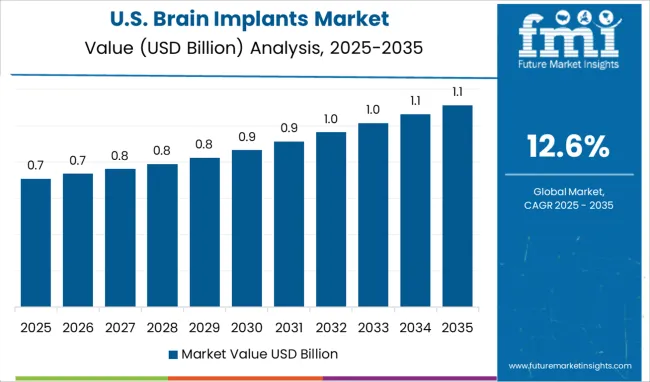
Country-Wise Analysis

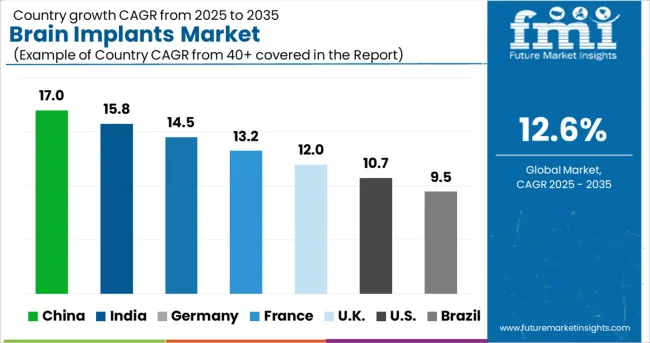
Which Country Lies at the Centerstage for Brain Implants Market Revenue?

The United States is expected to account for the highest market of US$ 6.6 Bn by the end of 2032. Currently, the U.S. market is estimated at US$ 2 Mn.

This is due to several factors such as an increase in the incidence of neurological disorders, high awareness of various medical options, developed healthcare facilities and presence of well-virtuous physicians. It is proclaimed that brain implants has proved to provide the best treatment for depression in the U.S.

Category-Wise Insights

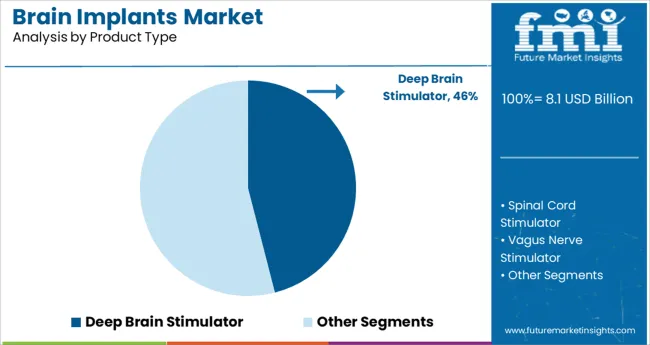
Why Deep Brain Stimulator is projected to Witness Fastest Growth among Brain Implants Product Type?

Market revenue through Deep Brain Stimulator is forecasted to grow at a CAGR of over 14.4% during 2022-32. The contributing factors for such growth are technological advancements like rechargeable implantable pulse generators, robot-assisted implantation, and a rise in the adoption of advanced Deep Brain Stimulator systems in healthcare units and neuro centers.

Market growth will also be stimulated due to the increase in the elderly population and innovative products in the future. However, the high cost of DBS (Deep Brain Stimulator) devices, restricted access to advanced therapy, and side effects may hamper the brain implant market dynamics during the projection period.

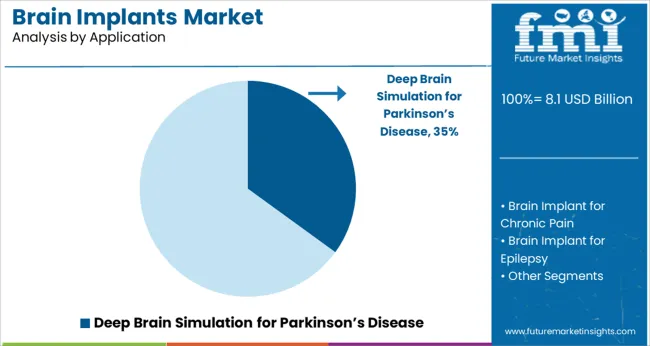
Market through which Disease is expected to Score Highest Growth in Revenue in the Coming Years?

Chronic Pain accounted for the highest revenue as well as a CAGR of around 13.4% for the demand for brain implants during the forecast period. Chronic pain is one of the core reasons as why individuals, mainly adults seek medical care. It hinders mobility, day to day activities, causes panic attacks and depressions and destroys lifestyle.

People suffering from chronic pain are more prone to have psychological disorders than those who do not experience it. According to research, 6%-35% of the individuals suffering from chronic pain also have comorbid anxiety illness, and almost 50% of patients have anxiety and depression symptoms.
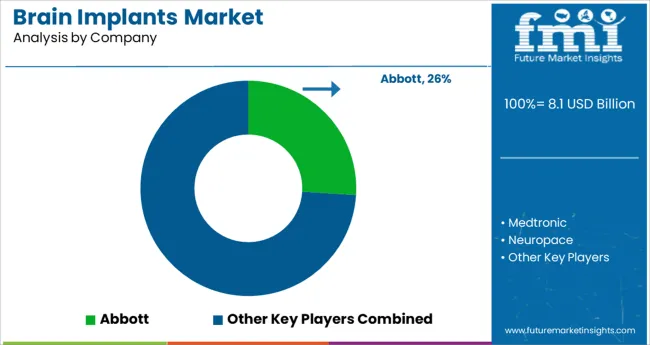
Competitive Analysis

Players in the market are constantly developing improved analytical solutions as well as extending their product offerings. The companies in brain implants market are focused on their alliances, technology collaborations, and product launch strategies. The Tier 2 Players in the market are targeting to increase their brain implant market share.

Some of the recent developments of key Neural Implants providers are as follows:

  • In April 2022, the FDA approved brain stimulation software for use in Parkinson's disease. Vercise Neural Navigator with Stimview XT will allow clinicians to visualize the lead placement and stimulation modelling, and is designed to provide patient-specific 3D modeling for therapeutic customization. The software is intended to aid in the placement of leads, minimise programming time, and allow for more informed treatment.
  • In June 2021, Medtronic plc received FDA approval for its SenSight Directional Lead System, which is used for deep brain stimulation therapy.
  • In March 2021, Abbott announced the launch of NeuroSphere Virtual Clinic. Deep brain stimulation patients can get programmed their devices and reset them remotely, from the comfort of their own homes, without travelling to a specialist, owing to a newly launched FDA-approved tool.
  • In December 2019, Aleva Neurotherapeutics received CE approval for its Deep Brain Stimulation Devices and raised USD 8 Mn in private equity funding. Aleva's ground-breaking DBS system uses directional electrode technology and is intended to be more precise and efficient, with tailored stimulation that may lessen side effects. The company claims that it is the only emerging technology company that has received the CE-Mark for Deep Brain Stimulation.
  • In February 2019, Medtronic PLC released a ‘brain pacemaker’ device to help people with epilepsy. This device was somewhat similar to cardiac pacemaker. Brain Pacemaker was also approved by Food and Drugs Administration, U.S.

Similarly, recent developments related to companies in Brain Implants Market have been tracked by the team at Future Market Insights, which are available in the full report.

Brain Implants Market Report Scope

Attribute Details
Forecast Period 2022-2032
Historical Data Available for 2017-2021
Market Analysis US$ Million for Value
Key Regions Covered North America, Latin America, Europe, Asia Pacific, Middle East & Africa
Key Countries Covered United States, Canada, Brazil, Mexico, Germany, UK, France, Spain, Italy, Russia, China, Japan, South Korea, India, Australia, South Africa, Saudi Arabia, UAE and Israel.
Key Market Segments Covered Product Type, Application, Region
Key Companies Profiled
  • Abbott Laboratories
  • Medtronic PLC
  • NeuroPace Incorporation
  • Nevro Corporation
  • Aleva Neurotherapeutics SA
  • Synapse Biomedical Incorporation
  • Boston Scientific Corporation
  • Sapiens Neuro
  • Edwards Lifesciences Corporation
Pricing Available upon Request

Brain Implants Market Segmentation

By Product Type:

  • Deep Brain Stimulator
  • Spinal Cord Stimulator
  • Vagus Nerve Stimulator

By Application:

  • Brain Implant for Chronic Pain
  • Brain Implant for Epilepsy
  • Deep Brain Simulation for Parkinson’s Disease
  • Brain Implant for Depression
  • Brain Implant for Essential tremor
  • Brain Implant for Alzheimer’s Disease

By Region:

  • North America
  • Latin America
  • Europe
  • APAC
  • MEA

Frequently Asked Questions

How much is the current worth of the Brain Implants Market?

The global Brain Implants Market is worth more than US$ 5.1 Bn at present.

What is the sales forecast for Brain Implants Market?

The value of Brain Implants Market is projected to increase at a CAGR of around 12.3% during 2022 – 2032.

What was the last 5 year’s market CAGR?

The value of Brain Implants Market increased at a CAGR of around 10.1% during 2017 – 2021.

What are the key Brain Implants Market Trends?

The demand for stimulation devices has increased tremendously. The global demand for brain implants is being fueled by a considerable increase in the ageing populations and the resulting age-related neurological illnesses.

At what percentage is sales of Brain Implants Market going to register growth in China?

The growth of the market for Brain Implants in China is projected to expand at a CAGR of around 13.8% during 2022 – 2032.

What do statistics for South Korea and Japan reveal?

While the market in South Korea is expected to grow at nearly 16%, the market in Japan is projected to register a CAGR of nearly 16.1% during 2022 - 2032.

Table of Content

1. Executive Summary

    1.1. Global Market Outlook

    1.2. Demand-side Trends

    1.3. Supply-side Trends

    1.4. Technology Roadmap Analysis

    1.5. Analysis and Recommendations

2. Market Overview

    2.1. Market Coverage / Taxonomy

    2.2. Market Definition / Scope / Limitations

3. Market Background

    3.1. Market Dynamics

        3.1.1. Drivers

        3.1.2. Restraints

        3.1.3. Opportunity

        3.1.4. Trends

    3.2. Scenario Forecast

        3.2.1. Demand in Optimistic Scenario

        3.2.2. Demand in Likely Scenario

        3.2.3. Demand in Conservative Scenario

    3.3. Opportunity Map Analysis

    3.4. Product Life Cycle Analysis

    3.5. Investment Feasibility Matrix

    3.6. PESTLE and Porter’s Analysis

    3.7. Regulatory Landscape

        3.7.1. By Key Regions

        3.7.2. By Key Countries

    3.8. Regional Parent Market Outlook

4. Global Market Analysis 2017-2021 and Forecast, 2022-2032

    4.1. Historical Market Size Value (US$ Mn) Analysis, 2017-2021

    4.2. Current and Future Market Size Value (US$ Mn) Projections, 2022-2032

        4.2.1. Y-o-Y Growth Trend Analysis

        4.2.2. Absolute $ Opportunity Analysis

5. Global Market Analysis 2017-2021 and Forecast 2022-2032, By Product Type

    5.1. Introduction / Key Findings

    5.2. Historical Market Size Value (US$ Mn) Analysis By Product Type, 2017-2021

    5.3. Current and Future Market Size Value (US$ Mn) Analysis and Forecast By Product Type, 2022-2032

        5.3.1. Deep Brain Stimulator

        5.3.2. Spinal Cord Stimulator

        5.3.3. Vagus Nerve Stimulator

    5.4. Y-o-Y Growth Trend Analysis By Product Type, 2017-2021

    5.5. Absolute $ Opportunity Analysis By Product Type, 2022-2032

6. Global Market Analysis 2017-2021 and Forecast 2022-2032, By Application

    6.1. Introduction / Key Findings

    6.2. Historical Market Size Value (US$ Mn) Analysis By Application, 2017-2021

    6.3. Current and Future Market Size Value (US$ Mn) Analysis and Forecast By Application, 2022-2032

        6.3.1. Chronic Pain

        6.3.2. Epilepsy

        6.3.3. Parkinson’s Disease

        6.3.4. Depression

        6.3.5. Essential Tremor

        6.3.6. Alzheimer’s Disease

    6.4. Y-o-Y Growth Trend Analysis By Application, 2017-2021

    6.5. Absolute $ Opportunity Analysis By Application, 2022-2032

7. Global Market Analysis 2017-2021 and Forecast 2022-2032, By Region

    7.1. Introduction

    7.2. Historical Market Size Value (US$ Mn) Analysis By Region, 2017-2021

    7.3. Current Market Size Value (US$ Mn) Analysis and Forecast By Region, 2022-2032

        7.3.1. North America

        7.3.2. Latin America

        7.3.3. Europe

        7.3.4. Asia Pacific

        7.3.5. Middle East and Africa

    7.4. Market Attractiveness Analysis By Region

8. North America Market Analysis 2017-2021 and Forecast 2022-2032, By Country

    8.1. Historical Market Size Value (US$ Mn) Trend Analysis By Market Taxonomy, 2017-2021

    8.2. Market Size Value (US$ Mn) Forecast By Market Taxonomy, 2022-2032

        8.2.1. By Country

            8.2.1.1. U.S.

            8.2.1.2. Canada

        8.2.2. By Product Type

        8.2.3. By Application

    8.3. Market Attractiveness Analysis

        8.3.1. By Country

        8.3.2. By Product Type

        8.3.3. By Application

    8.4. Key Takeaways

9. Latin America Market Analysis 2017-2021 and Forecast 2022-2032, By Country

    9.1. Historical Market Size Value (US$ Mn) Trend Analysis By Market Taxonomy, 2017-2021

    9.2. Market Size Value (US$ Mn) Forecast By Market Taxonomy, 2022-2032

        9.2.1. By Country

            9.2.1.1. Brazil

            9.2.1.2. Mexico

            9.2.1.3. Rest of Latin America

        9.2.2. By Product Type

        9.2.3. By Application

    9.3. Market Attractiveness Analysis

        9.3.1. By Country

        9.3.2. By Product Type

        9.3.3. By Application

    9.4. Key Takeaways

10. Europe Market Analysis 2017-2021 and Forecast 2022-2032, By Country

    10.1. Historical Market Size Value (US$ Mn) Trend Analysis By Market Taxonomy, 2017-2021

    10.2. Market Size Value (US$ Mn) Forecast By Market Taxonomy, 2022-2032

        10.2.1. By Country

            10.2.1.1. Germany

            10.2.1.2. U.K.

            10.2.1.3. France

            10.2.1.4. Spain

            10.2.1.5. Italy

            10.2.1.6. Russia

            10.2.1.7. Rest of Europe

        10.2.2. By Product Type

        10.2.3. By Application

    10.3. Market Attractiveness Analysis

        10.3.1. By Country

        10.3.2. By Product Type

        10.3.3. By Application

    10.4. Key Takeaways

11. Asia Pacific Market Analysis 2017-2021 and Forecast 2022-2032, By Country

    11.1. Historical Market Size Value (US$ Mn) Trend Analysis By Market Taxonomy, 2017-2021

    11.2. Market Size Value (US$ Mn) Forecast By Market Taxonomy, 2022-2032

        11.2.1. By Country

            11.2.1.1. China

            11.2.1.2. Japan

            11.2.1.3. India

            11.2.1.4. South Korea

            11.2.1.5. Australia

            11.2.1.6. Rest of APAC

        11.2.2. By Product Type

        11.2.3. By Application

    11.3. Market Attractiveness Analysis

        11.3.1. By Country

        11.3.2. By Product Type

        11.3.3. By Application

    11.4. Key Takeaways

12. Middle East and Africa Market Analysis 2017-2021 and Forecast 2022-2032, By Country

    12.1. Historical Market Size Value (US$ Mn) Trend Analysis By Market Taxonomy, 2017-2021

    12.2. Market Size Value (US$ Mn) Forecast By Market Taxonomy, 2022-2032

        12.2.1. By Country

            12.2.1.1. South Africa

            12.2.1.2. Saudi Arabia

            12.2.1.3. UAE

            12.2.1.4. Israel

            12.2.1.5. Rest of MEA

        12.2.2. By Product Type

        12.2.3. By Application

    12.3. Market Attractiveness Analysis

        12.3.1. By Country

        12.3.2. By Product Type

        12.3.3. By Application

    12.4. Key Takeaways

13. Key Countries Market Analysis

    13.1. U.S.

        13.1.1. Pricing Analysis

        13.1.2. Market Share Analysis, 2021

            13.1.2.1. By Product Type

            13.1.2.2. By Application

    13.2. Canada

        13.2.1. Pricing Analysis

        13.2.2. Market Share Analysis, 2021

            13.2.2.1. By Product Type

            13.2.2.2. By Application

    13.3. Brazil

        13.3.1. Pricing Analysis

        13.3.2. Market Share Analysis, 2021

            13.3.2.1. By Product Type

            13.3.2.2. By Application

    13.4. Mexico

        13.4.1. Pricing Analysis

        13.4.2. Market Share Analysis, 2021

            13.4.2.1. By Product Type

            13.4.2.2. By Application

    13.5. Germany

        13.5.1. Pricing Analysis

        13.5.2. Market Share Analysis, 2021

            13.5.2.1. By Product Type

            13.5.2.2. By Application

    13.6. U.K.

        13.6.1. Pricing Analysis

        13.6.2. Market Share Analysis, 2021

            13.6.2.1. By Product Type

            13.6.2.2. By Application

    13.7. France

        13.7.1. Pricing Analysis

        13.7.2. Market Share Analysis, 2021

            13.7.2.1. By Product Type

            13.7.2.2. By Application

    13.8. Spain

        13.8.1. Pricing Analysis

        13.8.2. Market Share Analysis, 2021

            13.8.2.1. By Product Type

            13.8.2.2. By Application

    13.9. Italy

        13.9.1. Pricing Analysis

        13.9.2. Market Share Analysis, 2021

            13.9.2.1. By Product Type

            13.9.2.2. By Application

    13.10. Russia

        13.10.1. Pricing Analysis

        13.10.2. Market Share Analysis, 2021

            13.10.2.1. By Product Type

            13.10.2.2. By Application

    13.11. China

        13.11.1. Pricing Analysis

        13.11.2. Market Share Analysis, 2021

            13.11.2.1. By Product Type

            13.11.2.2. By Application

    13.12. Japan

        13.12.1. Pricing Analysis

        13.12.2. Market Share Analysis, 2021

            13.12.2.1. By Product Type

            13.12.2.2. By Application

    13.13. India

        13.13.1. Pricing Analysis

        13.13.2. Market Share Analysis, 2021

            13.13.2.1. By Product Type

            13.13.2.2. By Application

    13.14. South Korea

        13.14.1. Pricing Analysis

        13.14.2. Market Share Analysis, 2021

            13.14.2.1. By Product Type

            13.14.2.2. By Application

    13.15. Australia

        13.15.1. Pricing Analysis

        13.15.2. Market Share Analysis, 2021

            13.15.2.1. By Product Type

            13.15.2.2. By Application

    13.16. South Africa

        13.16.1. Pricing Analysis

        13.16.2. Market Share Analysis, 2021

            13.16.2.1. By Product Type

            13.16.2.2. By Application

    13.17. Saudi Arabia

        13.17.1. Pricing Analysis

        13.17.2. Market Share Analysis, 2021

            13.17.2.1. By Product Type

            13.17.2.2. By Application

    13.18. UAE

        13.18.1. Pricing Analysis

        13.18.2. Market Share Analysis, 2021

            13.18.2.1. By Product Type

            13.18.2.2. By Application

    13.19. Israel

        13.19.1. Pricing Analysis

        13.19.2. Market Share Analysis, 2021

            13.19.2.1. By Product Type

            13.19.2.2. By Application

14. Market Structure Analysis

    14.1. Competition Dashboard

    14.2. Competition Benchmarking

    14.3. Market Share Analysis of Top Players

        14.3.1. By Regional

        14.3.2. By Product Type

        14.3.3. By Application

15. Competition Analysis

    15.1. Competition Deep Dive

        15.1.1. Abbott

            15.1.1.1. Overview

            15.1.1.2. Product Portfolio

            15.1.1.3. Profitability by Market Segments

            15.1.1.4. Sales Footprint

            15.1.1.5. Strategy Overview

                15.1.1.5.1. Marketing Strategy

        15.1.2. Medtronic

            15.1.2.1. Overview

            15.1.2.2. Product Portfolio

            15.1.2.3. Profitability by Market Segments

            15.1.2.4. Sales Footprint

            15.1.2.5. Strategy Overview

                15.1.2.5.1. Marketing Strategy

        15.1.3. Neuropace

            15.1.3.1. Overview

            15.1.3.2. Product Portfolio

            15.1.3.3. Profitability by Market Segments

            15.1.3.4. Sales Footprint

            15.1.3.5. Strategy Overview

                15.1.3.5.1. Marketing Strategy

        15.1.4. Nevro Corp.

            15.1.4.1. Overview

            15.1.4.2. Product Portfolio

            15.1.4.3. Profitability by Market Segments

            15.1.4.4. Sales Footprint

            15.1.4.5. Strategy Overview

                15.1.4.5.1. Marketing Strategy

        15.1.5. Aleva Neurotherapeutics

            15.1.5.1. Overview

            15.1.5.2. Product Portfolio

            15.1.5.3. Profitability by Market Segments

            15.1.5.4. Sales Footprint

            15.1.5.5. Strategy Overview

                15.1.5.5.1. Marketing Strategy

        15.1.6. Synapse Biomedical Inc.

            15.1.6.1. Overview

            15.1.6.2. Product Portfolio

            15.1.6.3. Profitability by Market Segments

            15.1.6.4. Sales Footprint

            15.1.6.5. Strategy Overview

                15.1.6.5.1. Marketing Strategy

        15.1.7. Boston Scientific Corporation

            15.1.7.1. Overview

            15.1.7.2. Product Portfolio

            15.1.7.3. Profitability by Market Segments

            15.1.7.4. Sales Footprint

            15.1.7.5. Strategy Overview

                15.1.7.5.1. Marketing Strategy

16. Assumptions & Acronyms Used

17. Research Methodology

Don't pay for what you don't need

Customize your report by selecting specific countries or regions and save 30%!

List of Tables

Table 01: Global Market Value (US$ Mn) Forecast by Region, 2017-2032

Table 02: Global Market Value (US$ Mn) Forecast by Product Type, 2017-2032

Table 03: Global Market Value (US$ Mn) Forecast by Application, 2017-2032

Table 04: North America Market Value (US$ Mn) Forecast by Country, 2017-2032

Table 05: North America Market Value (US$ Mn) Forecast by Product Type, 2017-2032

Table 06: North America Market Value (US$ Mn) Forecast by Application, 2017-2032

Table 07: Latin America Market Value (US$ Mn) Forecast by Country, 2017-2032

Table 08: Latin America Market Value (US$ Mn) Forecast by Product Type, 2017-2032

Table 09: Latin America Market Value (US$ Mn) Forecast by Application, 2017-2032

Table 10: Europe Market Value (US$ Mn) Forecast by Country, 2017-2032

Table 11: Europe Market Value (US$ Mn) Forecast by Product Type, 2017-2032

Table 12: Europe Market Value (US$ Mn) Forecast by Application, 2017-2032

Table 13: Asia Pacific Market Value (US$ Mn) Forecast by Country, 2017-2032

Table 14: Asia Pacific Market Value (US$ Mn) Forecast by Product Type, 2017-2032

Table 15: Asia Pacific Market Value (US$ Mn) Forecast by Application, 2017-2032

Table 16: Middle East and Africa Market Value (US$ Mn) Forecast by Country, 2017-2032

Table 17: Middle East and Africa Market Value (US$ Mn) Forecast by Product Type, 2017-2032

Table 18: Middle East and Africa Market Value (US$ Mn) Forecast by Application, 2017-2032
Sabyasachi Ghosh
Sabyasachi Ghosh

Principal Consultant

Talk to Analyst

Find your sweet spots for generating winning opportunities in this market.

List of Charts

Figure 01: Global Market Value (US$ Mn) by Product Type, 2022-2032

Figure 02: Global Market Value (US$ Mn) by Application, 2022-2032

Figure 03: Global Market Value (US$ Mn) by Region, 2022-2032

Figure 04: Global Market Value (US$ Mn) Analysis by Region, 2017-2032

Figure 05: Global Market Value Share (%) and BPS Analysis by Region, 2022-2032

Figure 06: Global Market Y-o-Y Growth (%) Projections by Region, 2022-2032

Figure 07: Global Market Value (US$ Mn) Analysis by Product Type, 2017-2032

Figure 08: Global Market Value Share (%) and BPS Analysis by Product Type, 2022-2032

Figure 09: Global Market Y-o-Y Growth (%) Projections by Product Type, 2022-2032

Figure 10: Global Market Value (US$ Mn) Analysis by Application, 2017-2032

Figure 11: Global Market Value Share (%) and BPS Analysis by Application, 2022-2032

Figure 12: Global Market Y-o-Y Growth (%) Projections by Application, 2022-2032

Figure 13: Global Market Attractiveness by Product Type, 2022-2032

Figure 14: Global Market Attractiveness by Application, 2022-2032

Figure 15: Global Market Attractiveness by Region, 2022-2032

Figure 16: North America Market Value (US$ Mn) by Product Type, 2022-2032

Figure 17: North America Market Value (US$ Mn) by Application, 2022-2032

Figure 18: North America Market Value (US$ Mn) by Country, 2022-2032

Figure 19: North America Market Value (US$ Mn) Analysis by Country, 2017-2032

Figure 20: North America Market Value Share (%) and BPS Analysis by Country, 2022-2032

Figure 21: North America Market Y-o-Y Growth (%) Projections by Country, 2022-2032

Figure 22: North America Market Value (US$ Mn) Analysis by Product Type, 2017-2032

Figure 23: North America Market Value Share (%) and BPS Analysis by Product Type, 2022-2032

Figure 24: North America Market Y-o-Y Growth (%) Projections by Product Type, 2022-2032

Figure 25: North America Market Value (US$ Mn) Analysis by Application, 2017-2032

Figure 26: North America Market Value Share (%) and BPS Analysis by Application, 2022-2032

Figure 27: North America Market Y-o-Y Growth (%) Projections by Application, 2022-2032

Figure 28: North America Market Attractiveness by Product Type, 2022-2032

Figure 29: North America Market Attractiveness by Application, 2022-2032

Figure 30: North America Market Attractiveness by Country, 2022-2032

Figure 31: Latin America Market Value (US$ Mn) by Product Type, 2022-2032

Figure 32: Latin America Market Value (US$ Mn) by Application, 2022-2032

Figure 33: Latin America Market Value (US$ Mn) by Country, 2022-2032

Figure 34: Latin America Market Value (US$ Mn) Analysis by Country, 2017-2032

Figure 35: Latin America Market Value Share (%) and BPS Analysis by Country, 2022-2032

Figure 36: Latin America Market Y-o-Y Growth (%) Projections by Country, 2022-2032

Figure 37: Latin America Market Value (US$ Mn) Analysis by Product Type, 2017-2032

Figure 38: Latin America Market Value Share (%) and BPS Analysis by Product Type, 2022-2032

Figure 39: Latin America Market Y-o-Y Growth (%) Projections by Product Type, 2022-2032

Figure 40: Latin America Market Value (US$ Mn) Analysis by Application, 2017-2032

Figure 41: Latin America Market Value Share (%) and BPS Analysis by Application, 2022-2032

Figure 42: Latin America Market Y-o-Y Growth (%) Projections by Application, 2022-2032

Figure 43: Latin America Market Attractiveness by Product Type, 2022-2032

Figure 44: Latin America Market Attractiveness by Application, 2022-2032

Figure 45: Latin America Market Attractiveness by Country, 2022-2032

Figure 46: Europe Market Value (US$ Mn) by Product Type, 2022-2032

Figure 47: Europe Market Value (US$ Mn) by Application, 2022-2032

Figure 48: Europe Market Value (US$ Mn) by Country, 2022-2032

Figure 49: Europe Market Value (US$ Mn) Analysis by Country, 2017-2032

Figure 50: Europe Market Value Share (%) and BPS Analysis by Country, 2022-2032

Figure 51: Europe Market Y-o-Y Growth (%) Projections by Country, 2022-2032

Figure 52: Europe Market Value (US$ Mn) Analysis by Product Type, 2017-2032

Figure 53: Europe Market Value Share (%) and BPS Analysis by Product Type, 2022-2032

Figure 54: Europe Market Y-o-Y Growth (%) Projections by Product Type, 2022-2032

Figure 55: Europe Market Value (US$ Mn) Analysis by Application, 2017-2032

Figure 56: Europe Market Value Share (%) and BPS Analysis by Application, 2022-2032

Figure 57: Europe Market Y-o-Y Growth (%) Projections by Application, 2022-2032

Figure 58: Europe Market Attractiveness by Product Type, 2022-2032

Figure 59: Europe Market Attractiveness by Application, 2022-2032

Figure 60: Europe Market Attractiveness by Country, 2022-2032

Figure 61: Asia Pacific Market Value (US$ Mn) by Product Type, 2022-2032

Figure 62: Asia Pacific Market Value (US$ Mn) by Application, 2022-2032

Figure 63: Asia Pacific Market Value (US$ Mn) by Country, 2022-2032

Figure 64: Asia Pacific Market Value (US$ Mn) Analysis by Country, 2017-2032

Figure 65: Asia Pacific Market Value Share (%) and BPS Analysis by Country, 2022-2032

Figure 66: Asia Pacific Market Y-o-Y Growth (%) Projections by Country, 2022-2032

Figure 67: Asia Pacific Market Value (US$ Mn) Analysis by Product Type, 2017-2032

Figure 68: Asia Pacific Market Value Share (%) and BPS Analysis by Product Type, 2022-2032

Figure 69: Asia Pacific Market Y-o-Y Growth (%) Projections by Product Type, 2022-2032

Figure 70: Asia Pacific Market Value (US$ Mn) Analysis by Application, 2017-2032

Figure 71: Asia Pacific Market Value Share (%) and BPS Analysis by Application, 2022-2032

Figure 72: Asia Pacific Market Y-o-Y Growth (%) Projections by Application, 2022-2032

Figure 73: Asia Pacific Market Attractiveness by Product Type, 2022-2032

Figure 74: Asia Pacific Market Attractiveness by Application, 2022-2032

Figure 75: Asia Pacific Market Attractiveness by Country, 2022-2032

Figure 76: Middle East and Africa Market Value (US$ Mn) by Product Type, 2022-2032

Figure 77: Middle East and Africa Market Value (US$ Mn) by Application, 2022-2032

Figure 78: Middle East and Africa Market Value (US$ Mn) by Country, 2022-2032

Figure 79: Middle East and Africa Market Value (US$ Mn) Analysis by Country, 2017-2032

Figure 80: Middle East and Africa Market Value Share (%) and BPS Analysis by Country, 2022-2032

Figure 81: Middle East and Africa Market Y-o-Y Growth (%) Projections by Country, 2022-2032

Figure 82: Middle East and Africa Market Value (US$ Mn) Analysis by Product Type, 2017-2032

Figure 83: Middle East and Africa Market Value Share (%) and BPS Analysis by Product Type, 2022-2032

Figure 84: Middle East and Africa Market Y-o-Y Growth (%) Projections by Product Type, 2022-2032

Figure 85: Middle East and Africa Market Value (US$ Mn) Analysis by Application, 2017-2032

Figure 86: Middle East and Africa Market Value Share (%) and BPS Analysis by Application, 2022-2032

Figure 87: Middle East and Africa Market Y-o-Y Growth (%) Projections by Application, 2022-2032

Figure 88: Middle East and Africa Market Attractiveness by Product Type, 2022-2032

Figure 89: Middle East and Africa Market Attractiveness by Application, 2022-2032

Figure 90: Middle East and Africa Market Attractiveness by Country, 2022-2032

Recommendations

Healthcare

Brain Biomarker Market

Published : October 2023

Healthcare

Brain Metastasis Therapeutics Market

Published : July 2023

Healthcare

Brain Tumor Treatment Market

Published : July 2023

Healthcare

Brain Monitoring Systems Market

Published : January 2023

Explore Healthcare Insights

View Reports