Kids’ Brain Health Supplements Market Size and Share Forecast Outlook 2025 to 2035

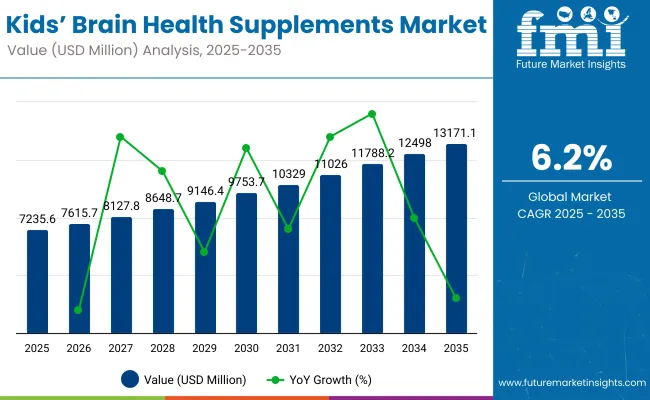
The Kids’ Brain Health Supplements Market is expected to record a valuation of USD 7,235.6 Million in 2025 and USD 13,171.1 Million in 2035, with an increase of USD 5,932 Million, which equals a growth of over 82% over the decade. The overall expansion represents a CAGR of 6.2% and a near doubling of market size.
Quick Stats for Kids’ Brain Health Supplements Market

  • Kids’ Brain Health Supplements Market Value (2025): USD 7,235.6million
  • Kids’ Brain Health Supplements Market Forecast Value (2035): USD 13,171.1million
  • Kids’ Brain Health Supplements Market Forecast CAGR: 6.2%
  • Leading Segment in 2025 (Formulation): Gummies (30%)
  • Key Growth Regions: North America, Asia-Pacific, Europe
  • Top Key Players: Nestlé Health Science, Abbott Nutrition, Reckitt Benckiser (Enfamil), Bayer AG, Herbalife Nutrition, Amway (Nutrilite), Nature’s Way, SmartyPants Vitamins, Nordic Naturals, MegaFood

Kids Brain Health Supplements Market

Kids’ Brain Health Supplements Market Key Takeaways

Metric Value
Market Estimated Value in (2025E) USD 7,235.6 million
Market Forecast Value in (2035F) USD 13,171.1 million
Forecast CAGR (2025 to 2035) 6.2%

This trajectory reflects a growing prioritization of cognitive well-being in early childhood, with functional nutrition increasingly positioned as a preventive tool by health-conscious caregivers. From 2025 to 2030, the market is projected to grow from USD 7,235.6 Million to USD 9,756 Million, contributing USD 2,521 Million, or approximately 43% of the total decade growth.

This growth phase is expected to be shaped by heightened adoption in North America and Europe, where early education outcomes, attention support, and memory enhancement claims are being actively targeted by supplement developers. Gummy and chewable formulations are likely to dominate due to higher child compliance and palatability.

Between 2030 and 2035, an additional USD 3,426 Million is projected to be added, contributing 57% of the forecasted growth. This acceleration is expected to be fueled by expansion into Asia-Pacific and Latin American regions, as market penetration deepens through e-commerce and pediatric practitioner recommendations. Ingredient innovation particularly in nootropics and omega-3 alternatives is anticipated to shift value generation toward clinically backed formulations, with direct-to-consumer (DTC) brands and digital platforms poised to lead in consumer engagement and retention.

From 2020 to 2024, the Kids’ Brain Health Supplements Market expanded from USD 5.61 million to USD 7,235.6 million, fueled by heightened awareness of early-life cognitive development and increased pediatrician-led supplementation. During this period, the competitive landscape was led by major nutrition conglomerates, which accounted for over 60% of the market revenue, with brands like Nestlé, Abbott, and Reckitt dominating through clinically supported DHA and multivitamin offerings. Product differentiation emphasized clean-label claims, allergen-free compliance, and taste innovation.

In 2025, the market is projected to reach USD 7,235.6 million, with consumer demand shifting toward functional blends featuring nootropics, adaptogens, and psychobiotics. By 2035, the value is expected to rise to USD 13,171.1 million, with digital-first players capturing share through e-commerce, personalized subscription kits, and AI-linked recommendation platforms.

Leading incumbents are anticipated to pivot toward hybrid business models that integrate clinical transparency, microbiome-focused personalization, and caregiver education ecosystems. Competitive edge will move beyond formulation efficacy to include delivery format innovation, regulatory foresight, and digital engagement scalability.

Why the Kids’ Brain Health Supplements Market is growing?

Growth in the Kids’ Brain Health Supplements Market is being driven by heightened awareness among parents regarding early cognitive development and preventive brain health strategies. Increased screen exposure and academic pressures have been linked to rising concerns over focus, memory, and mental fatigue in children, prompting demand for targeted nutritional solutions.

A surge in pediatric recommendations and endorsements from healthcare professionals has validated the use of supplements in child wellness routines. Plant-based, allergen-free, and sugar-conscious formulations have been prioritized by formulators to meet evolving consumer expectations.

The expansion of clean-label and clinically backed ingredients such as omega-3s, herbal nootropics, and micronutrients has been instrumental in supporting trust and efficacy claims. Greater accessibility through online retail and personalized e-commerce platforms has allowed niche brands to scale quickly.

Furthermore, innovations in child-friendly formats like gummies and chewables have enhanced compliance, while digital health campaigns have increased caregiver engagement, accelerating sustained category adoption across developed and emerging economies.

Segmental Analysis

The Kids’ Brain Health Supplements Market has been segmented based on ingredient type, formulation type, and health benefit, each contributing uniquely to consumer adoption patterns. Ingredients such as omega-3 fatty acids, nootropics, and micronutrients have been prioritized for their clinically validated roles in neural development and mental performance.

Formulation choices especially gummies and chewables have been guided by child compliance and ease of dosing. Meanwhile, demand has been further segmented by targeted outcomes including cognitive enhancement, attention support, and mood stabilization.

These segments have been shaped by evolving parental expectations, rising scientific backing, and market accessibility. Over the forecast period, segment-level innovation is expected to influence brand differentiation, pricing strategies, and cross-category convergence across pediatric nutrition and mental wellness platforms.
Insights into the Ingredient Segment with Omega‑3 Leading in Market Share

Kids Brain Health Supplements Market By Ingrediant

Ingredient Segment Share (%)
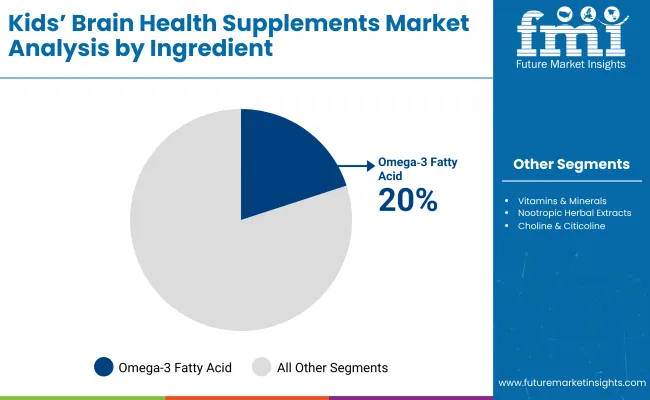
Omega 3 Fatty Acids (DHA, EPA) 20%
Vitamins & Minerals 15%
Nootropic Herbal Extracts 12%
Choline & Citicoline 10%
Phosphatidylserine 8%
Adaptogens 8%
Amino Acids 8%
Antioxidants 7%
Probiotics & Prebiotics 7%
Other Nutrients 5%

Omega‑3 fatty acids are projected to contribute 20% of the Kids’ Brain Health Supplements Market revenue in 2025, maintaining their position as the leading ingredient group. Their dominance has been driven by extensive clinical validation of DHA and EPA in supporting early brain structure, neuron signaling, and long-term memory formation. Pediatricians and health organizations have widely endorsed omega-3s, reinforcing trust among caregivers.

Innovation in taste-masked delivery formats and sustainably sourced algal oils has expanded accessibility, especially in allergen-sensitive populations. As research around long-chain polyunsaturated fatty acids continues to evolve, the omega-3 segment is expected to remain central to pediatric neurodevelopment strategies and is likely to experience sustained investment by both legacy and emerging brands.
Insights into the Formulation Segment with Gummies Dominating the Format Demand

Kids Brain Health Supplements Market By Segment

Formulation Type Share (%)
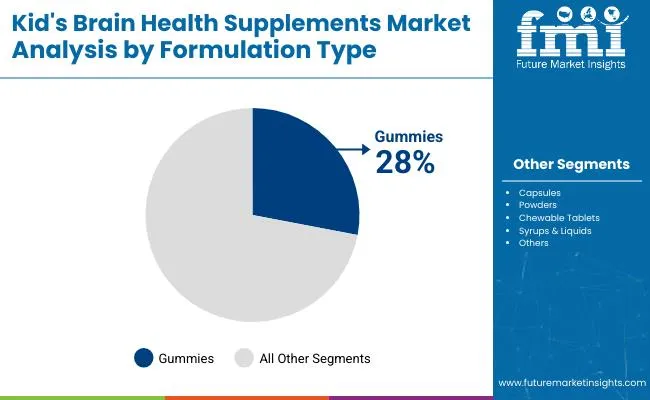
Gummies 28%
Capsules 25%
Powders 20%
Chewable Tablets 15%
Syrups & Liquids 12%

Gummies are forecasted to hold the highest market share in 2025, contributing 28% of total revenue across the formulation segment. Their dominance has been enabled by superior palatability, visual appeal, and ease of administration factors that strongly influence parental purchasing decisions for children. Taste innovation, clean-label certifications, and sugar-conscious formulations have further positioned gummies as the preferred delivery format.

The segment’s rise has also been supported by social media and influencer-led marketing targeting modern parents, while DTC brands have leveraged this format for subscription-based growth. As multinutrient stacking within a single gummy becomes increasingly viable through microencapsulation technologies, this segment is expected to further consolidate its leadership across global markets.

Insights into the Health Benefit Segment with Cognitive Development Leading Demand

Health Benefit Share (%)
Cognitive Development 25%
Memory & Concentration 22%
Attention & Focus 18%
Learning Support 15%
Stress & Mood 12%
Sleep Support 8%

Cognitive development is projected to lead the health benefit segment in 2025 with a 25% revenue share, reflecting its role as the foundational focus of most pediatric supplementation strategies. Market demand has been anchored in early-age brain maturation, language development, and academic performance improvement.

Parents are increasingly seeking solutions that promise long-term developmental advantages, and brands have responded with child-safe formulations backed by neuroscience. Educational institutions and pediatric health practitioners have reinforced the adoption of these products through structured wellness programs. This segment is expected to remain dominant as first-time parents in urban markets prioritize early cognitive milestones, supported by clinical trials and ingredient transparency.

What are the Drivers, Restraints, and Key Trends of the Kids’ Brain Health Supplements Market?

Regulatory scrutiny, evolving parental attitudes, and formulation complexity continue to shape the growth trajectory of the Kids’ Brain Health Supplements Market, even as new research-backed ingredients and digital retail models unlock novel opportunities for targeted, compliant, and scalable neuro-nutrition.

Driver - Pediatric Neurodevelopment Framed as a Public Health Priority

The prioritization of early brain development as a national health objective by governments and public health agencies has significantly influenced the supplement industry’s approach to children’s cognitive nutrition. Policies promoting early-life interventions such as fortification, school-based wellness programs, and maternal-child health linkages have expanded the perceived legitimacy of pediatric brain health supplementation.

As child development becomes intertwined with national educational outcomes and future workforce readiness, investments into evidence-based brain-supporting interventions have been accelerated through public-private collaborations. Scientific endorsement of critical periods in early neurodevelopment has shifted supplement positioning from optional enhancement to preventive necessity. This shift has been further reinforced by pediatricians and developmental psychologists recommending structured nutrition during formative years, thereby embedding supplements into long-term child wellness ecosystems.

Trend - Clinical Trial Integration into Pediatric Nutraceutical Branding

A growing shift has been observed toward the integration of randomized, pediatric-specific clinical trials into supplement branding strategies. Rather than relying on generic adult-derived claims, brands are pursuing proprietary trials to generate child-specific evidence on cognitive, attentional, and behavioral outcomes.

This approach has been driven by increased regulatory expectation, but also by heightened caregiver skepticism toward exaggerated wellness claims. Clinical datasets are now being used not only for formulation validation but also for marketing differentiation in saturated digital environments. As transparency becomes central to consumer trust, clinical-grade documentation is expected to be embedded into product storytelling, platform education, and influencer campaigns, setting new benchmarks for accountability and efficacy.
Analysis of Kids’ Brain Health Supplements Market By Key Countries

Kids Brain Health Supplements Market By Country

Countries CAGR
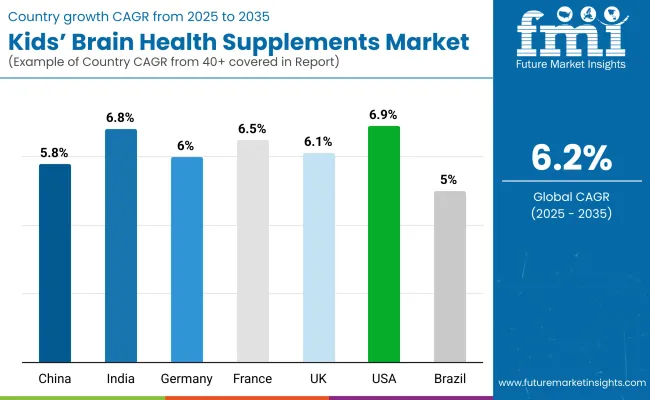
China 5.80%
India 6.87%
Germany 6.08%
France 6.50%
UK 6.10%
USA 6.96%
Brazil 5.05%

Marked disparities in growth dynamics have been observed across major economies in the Kids’ Brain Health Supplements Market, shaped by national health policies, pediatric nutrition awareness, and regulatory infrastructure. The United States is projected to grow at a CAGR of 6.96% through 2035, supported by mainstream integration of functional supplements in child healthcare routines, widespread retail channel maturity, and increasing clinical adoption among pediatricians.

In China, where a 5.8% CAGR has been forecast, growth is being reinforced by government-backed school nutrition programs and rising urban household expenditure on child cognitive wellness, although regulatory bottlenecks around ingredient approvals remain a limiting factor.

India, at 6.87% CAGR, is expected to advance more rapidly, fueled by increasing middle-class access to brain health supplements, aggressive e-commerce penetration, and localized manufacturing investments. Germany (6.08%), France (6.50%), and the UK (6.10%) are projected to maintain steady expansion within Europe, driven by clean-label demand, strong regulatory enforcement, and increasing adoption among holistic wellness-focused parents. European markets are further distinguished by R&D-led innovation in botanical nootropics and DHA alternatives.

Brazil, growing at 5.05%, reflects early-stage adoption, where market penetration remains fragmented but rising awareness through pediatricians and social campaigns is expected to unlock new urban demand. Regionally, market maturity, ingredient trust, and distribution infrastructure are expected to define performance differentials.

Sales Outlook for Kids’ Brain Health Supplements in the United States

Year USA Kids’ Brain Health Supplements market (USD Million)
2025 1736.5
2026 1,833.2
2027 1,930.9
2028 2,028.1
2029 2,138.1
2030 2,265.3
2031 2,416.4
2032 2,547.7
2033 2,704.7
2034 2,855.6
2035 3,004.9

The Kids’ Brain Health Supplements Market in the United States is projected to expand at a CAGR of 5.6% between 2025 and 2035, underpinned by the institutionalization of pediatric wellness and integration of cognitive nutrition into mainstream healthcare.

High trust in clinically substantiated formulations has driven engagement from pediatricians and behavioral health professionals, positioning supplements as integral to early-life developmental support. Policy-driven school nutrition programs and growing collaboration between nutraceutical firms and digital health platforms have further strengthened market visibility.

Academic and behavioral interventions are increasingly being complemented with targeted nootropic blends and omega-rich formulations, tailored to address attention, memory, and learning challenges among school-aged children. The healthcare segment has seen progressive adoption, particularly within functional medicine and child psychology practices.

  • Pediatricians and integrative healthcare practitioners have been central to accelerating supplement uptake.
  • E-commerce platforms have enabled widespread access to DTC supplement brands backed by transparent sourcing and third-party certifications.
  • Educational influencers and wellness campaigns are shaping demand for brain-supportive regimens among first-time parents.
  • Format innovation especially sugar-free gummies and allergen-free capsules has reinforced recurring household purchases.

Growth and Expansion Outlook for Kids’ Brain Health Supplements Market in the United Kingdom

A CAGR of 6.10% has been projected for the UK Kids’ Brain Health Supplements Market between 2025 to 2035, supported by growing integration of cognitive health products into school-age nutrition routines. Institutional trust in functional supplements has been enhanced by NHS-backed preventive health campaigns and rising acceptance among general practitioners.

  • Clean-label and vegan formulations have been prioritized due to heightened regulatory sensitivity and consumer expectations.
  • Brick-and-mortar pharmacies and health retailers have been repositioned as trust-driven advisory hubs for pediatric cognitive products.
  • Academic wellness programs and parent advocacy groups have amplified awareness around early mental health nutrition.
  • DHA and herbal nootropics with EFSA-compliant claims are expected to dominate premium shelf space.

Growth and Expansion Outlook for Kids’ Brain Health Supplements Market in India

A CAGR of 6.87% has been forecast for the Kids’ Brain Health Supplements Market in India, driven by rising urban affluence, digital penetration, and the medicalization of school performance. Pediatricians have increasingly incorporated cognitive formulations into growth and behavior consultations.

  • Tier-1 and Tier-2 city consumers have been increasingly targeted through vernacular marketing and regional influencer outreach.
  • Ayurvedic nootropics and clean-label modern blends are being positioned as culturally relevant solutions with high therapeutic credibility.
  • E-commerce and telemedicine integration has enabled rural reach, driving wider access to cognitive nutrition.
  • Regulatory clarity under FSSAI guidelines has been strengthening manufacturer accountability and consumer trust.

Sales Outlook for Kids’ Brain Health Supplements in China

A CAGR of 5.80% has been projected for China’s Kids’ Brain Health Supplements Market between 2025 to 2035, shaped by state-led child development programs and rising consumer inclination toward early-life functional health. Urban families have increasingly adopted brain supplements as a form of educational advantage.

  • Stringent cross-border e-commerce rules have prompted domestic players to localize formulations with TCM-compliant ingredients.
  • DHA, choline, and zinc-based supplements have gained traction in infant-to-preschool transition stages.
  • Brand credibility is being evaluated through clinical backing, traceability, and alignment with China’s “Blue Hat” certification system.
  • School performance anxiety and screen-related fatigue are accelerating supplement uptake among parents of school-aged children.

In-depth Analysis of Kids’ Brain Health Supplements in Germany

Countries 2025
UK 20.40%
Germany 20.78%
Italy 11.22%
France 14.14%
Spain 9.59%
BENELUX 6.38%
Nordic 5.49%
Rest of Europe 12%
Countries 2035
UK 19.18%
Germany 21.31%
Italy 11.38%
France 14.72%
Spain 9.34%
BENELUX 5.06%
Nordic 5.82%
Rest of Europe 13%

Germany’s Kids’ Brain Health Supplements Market is projected to grow at a CAGR of 6.08% from 2025 to 2035, anchored by its well-established preventive healthcare culture and high functional ingredient standards. Parents have shown increasing preference for clinically validated and allergen-free products.

  • Regulatory alignment with EU health claims has created a strict but trusted environment for supplement usage.
  • Organic and plant-derived nootropics have been prioritized within naturopathic and pediatric care frameworks.
  • Brick-and-click retail platforms have been used to combine professional guidance with convenient access.
  • Child-safe dosage formats with EFSA-backed claims have led adoption in both conventional and specialty stores.

Growth Outlook for Kids’ Brain Health Supplements Market in Japan

Ingredient Segment Share (%)
Omega 3 Fatty Acids (DHA, EPA) 22%
Vitamins & Minerals 14%
Nootropic Herbal Extracts 11%
Choline & Citicoline 10%
Adaptogens 8%
Amino Acids 8%
Phosphatidylserine 7%
Antioxidants 7%
Other Brain Boosting Nutrients 7%
Probiotics & Prebiotics 6%

The Kids’ Brain Health Supplements Market in Japan is projected at USD 470.31 million in 2025, with omega3 fatty acids contributing 22% of the total market value, while vitamins & minerals account for 14%, reflecting a deeply rooted emphasis on foundational nutrition and cognitive precision. The consistent lead of omega-3s has been driven by their integration into prenatal and early-life care protocols, with DHA-rich supplements gaining clinical traction among pediatricians and child development experts.

A strong consumer orientation toward functional foods and evidence-based supplementation has reinforced trust in vitamins, minerals, and nootropic botanicals particularly those aligned with Kampo (traditional Japanese medicine). Increasing preference for amino acids and adaptogens, such as Ltheanine and Rhodiola, has also been observed, supported by their perceived impact on calm focus and stress regulation during academic routines.

  • Japan is estimated to contribute 6.5% share of global market revenues by 2025.
  • Omega3s lead with 22%, followed by vitamins & minerals at 14%.
  • Growth is being supported by clinical adoption, traditional health philosophies, and evidence-led consumer behavior.
  • High trust in ingredient purity and functional precision is expected to drive sustained product innovation and premiumization.

Opportunity Analysis of South Korea Kids’ Brain Health Supplements Market

Formulation Segment Share (%)
Gummies 30%
Capsules 25%
Powders 18%
Chewable Tablets 14%
Syrups & Liquids 13%

The Kids’ Brain Health Supplements Market in South Korea is projected at USD 311.1 million in 2025, with gummies contributing 30% of total market value and capsules holding 25%, reflecting a clear consumer preference for format convenience and child compliance. The rapid rise in gummy adoption has been driven by Korean caregivers' emphasis on visual appeal, flavor masking, and dosage ease particularly for young children undergoing early cognitive development stages.

A robust domestic nutraceutical ecosystem and aggressive product innovation cycles have positioned South Korea as a trendsetter in functional food-tech fusion. Capsules continue to gain traction among older children and teens due to their association with clinical efficacy and measurable outcomes.
  • South Korea holds a 4.3% share in the Global pediatric supplement market in 2025.
  • Gummies lead the formulation segment at 30%, followed by capsules at 25%.
  • Growth is supported by tech-integrated nutrition, child-focused format engineering, and retail channel personalization.
  • Formulation trends are influenced by K-wellness culture, with a focus on aesthetic, functional, and behavioral compliance in child nutrition routines.

Competitive Landscape of Kids’ Brain Health Supplements Market

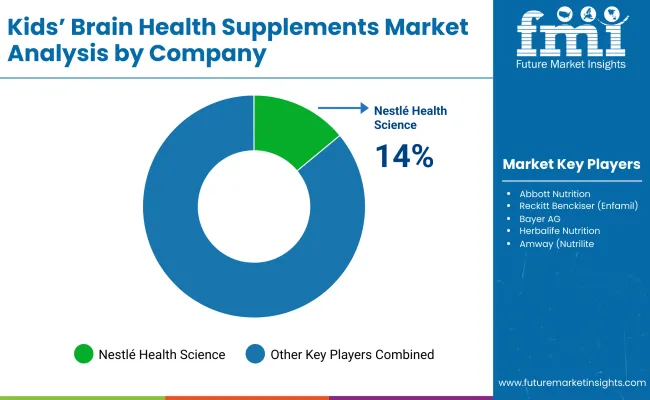
Kids Brain Health Supplements Market By Company

Company Global Value Share 2025
Nestlé Health Science 14%
Others 86%

The Kids’ Brain Health Supplements Market is moderately fragmented, with global nutrition majors, specialized pediatric supplement brands, and clean-label innovators competing across pediatric wellness, education, and clinical nutrition channels.

Global leaders such as Nestlé Health Science, Abbott Nutrition, and Reckitt Benckiser (Enfamil) have retained significant market presence, driven by established pediatric trust, R&D-backed formulations, and integrated distribution through both healthcare systems and retail networks. Their strategies have increasingly prioritized clinical validation, doctor-endorsed product lines, and multi-format offerings tailored to developmental stages.

Mid-sized players including Bayer AG, Amway (Nutrilite), and Herbalife Nutrition have been focused on functional formulation layering, especially in cognitive support blends featuring omega-3s, choline, and adaptogens. These companies are accelerating reach through e-commerce optimization, mobile health platforms, and wellness education campaigns targeted at parents and caregivers.

Specialist brands such as SmartyPants Vitamins, Nordic Naturals, and MegaFood have been differentiated by their commitment to clean-label certifications, allergen-free profiles, and high-transparency sourcing. Regional success has been achieved through flavor innovation, doctor-approved pediatric lines, and influencer-driven parent engagement.

As consumer expectations evolve, competitive advantage is shifting toward clinically supported claims, sustainability-driven sourcing, and personalized product ecosystems, including subscription models and data-linked supplementation paths tailored to children’s age and cognitive needs.

Key Developments in Kids’ Brain Health Supplements Market

  • In June 2025, Bone Science’s fourth-generation “Prime Brain” cognitive supplement for children and adolescents was introduced. It was designed with Alpha‑GPC, L‑theanine, and RhodiolaRosea to support academic focus, memory retention, and stress resilience among school-aged users. The launch was widely highlighted across pediatric wellness channels
  • In January 2025, the industry spotlighted psychobiotics probiotics and prebiotics formulated to enhance mental wellness via the gut-brain axis. This emerging trend was predicted to transform cognitive supplement strategies by addressing mood regulation, attention, and stress through microbiome

Scope of the Report

Item Value
Quantitative Units USD 7,235.6 Million
Ingredient Type Omega 3 Fatty Acids (DHA, EPA), Phosphatidylserine, Nootropic Herbal Extracts, Vitamins & Minerals, Adaptogens, Probiotics & Prebiotics, Amino Acids, Antioxidants, Choline & Citicoline , Other Brain Boosting Nutrients
Formulation Type Gummies, Capsules, Powders, Chewable Tablets, Syrups & Liquids
Health Benefit Cognitive Development, Memory & Concentration, Attention & Focus, Learning Support, Stress & Mood Regulation, Sleep Support
Age Group Toddlers (1-3 years), Preschoolers (4-5 years), School-aged Children (6-12 years), Adolescents (13-17 years)
Sales Channels Online Retail, Pharmacies & Drugstores, Health & Nutrition Stores, DTC Brands, Practitioner Channels
Regions Covered North America, Europe, Asia-Pacific, Latin America, Middle East & Africa
Countries Covered United States, Canada, Germany, France, United Kingdom, China, Japan, India, Brazil, South Korea
Key Companies Profiled Nestlé Health Science, Abbott Nutrition, Reckitt Benckiser (Enfamil), Bayer AG, Herbalife Nutrition, Amway (Nutrilite), Nature’s Way, SmartyPants Vitamins, Nordic Naturals, Mega Food
Additional Attributes Growth driven by cognitive health awareness, child-friendly formulations, regulatory alignment for pediatric claims, rise of psychobiotics and nootropics, e-commerce acceleration, premiumization in developed markets, and ingredient transparency as a competitive differentiator

Key Segments

By Ingredient Type:

  • Omega-3 Fatty Acids (DHA, EPA)
  • Phosphatidylserine
  • Nootropic Herbal Extracts (Ginkgo Biloba, Bacopa Monnieri)
  • Vitamins & Minerals (B Vitamins, Iron, Zinc, Magnesium)
  • Adaptogens (Ashwagandha, Rhodiola)
  • Probiotics & Prebiotics
  • Amino Acids (L-Theanine, Acetyl-L-Carnitine)
  • Antioxidants (Vitamin E, Curcumin)
  • Choline & Citicoline
  • Other Brain-Boosting Nutrients (Lutein, Inositol)

By Formulation Type:

  • Gummies
  • Chewable Tablets
  • Powders
  • Syrups & Liquids
  • Capsules

By Health Benefit:

  • Cognitive Development
  • Memory & Concentration
  • Attention & Focus
  • Learning Support
  • Stress & Mood Regulation
  • Sleep Support

By Age Group:

  • Toddlers (1-3 years)
  • Early Childhood (4-7 years)
  • Pre-teens (8-12 years)

By Sales Channel:

  • Pharmacies & Drugstores
  • Health & Nutrition Stores
  • Online Retail
  • Supermarkets & Hypermarkets
  • Pediatric Clinics & Healthcare Providers

By End User:

  • Children with Typical Development
  • Children with Learning or Attention Challenges
  • Health-Conscious Parents Seeking Preventive Nutrition

By Region:

  • North America
  • Latin America
  • Europe
  • East Asia
  • South Asia & Pacific
  • Middle East & Africa

Table of Content

  1. Executive Summary
    • Global Market Outlook
    • Demand-side Trends
    • Supply-side Trends
    • Technology Roadmap Analysis
    • Analysis and Recommendations
  2. Market Overview
    • Market Coverage / Taxonomy
    • Market Definition / Scope / Limitations
  3. Market Background
    • Market Dynamics
      • Drivers
      • Restraints
      • Opportunity
      • Trends
    • Scenario Forecast
      • Demand in Optimistic Scenario
      • Demand in Likely Scenario
      • Demand in Conservative Scenario
    • Opportunity Map Analysis
    • Product Life Cycle Analysis
    • Supply Chain Analysis
    • Investment Feasibility Matrix
    • Value Chain Analysis
    • PESTLE and Porter’s Analysis
    • Regulatory Landscape
    • Regional Parent Market Outlook
    • Production and Consumption Statistics
    • Import and Export Statistics
  4. Global Market Analysis 2020 to 2024 and Forecast, 2025 to 2035
    • Historical Market Size Value (USD Million) & Volume (MT) Analysis, 2020 to 2024
    • Current and Future Market Size Value (USD Million) & Volume (MT) Projections, 2025 to 2035
      • Y-o-Y Growth Trend Analysis
      • Absolute $ Opportunity Analysis
  5. Global Market Pricing Analysis 2020 to 2024 and Forecast 2025 to 2035
  6. Global Market Analysis 2020 to 2024 and Forecast 2025 to 2035, By Ingredient Type
    • Introduction / Key Findings
    • Historical Market Size Value (USD Million) & Volume (MT) Analysis By Ingredient Type, 2020 to 2024
    • Current and Future Market Size Value (USD Million) & Volume (MT) Analysis and Forecast By Ingredient Type, 2025 to 2035
      • Omega-3 Fatty Acids (DHA, EPA)
      • Phosphatidylserine
      • Nootropic Herbal Extracts (Ginkgo Biloba, Bacopa Monnieri)
      • Vitamins & Minerals (B Vitamins, Iron, Zinc, Magnesium)
      • Adaptogens (Ashwagandha, Rhodiola)
      • Probiotics & Prebiotics
      • Amino Acids (L-Theanine, Acetyl-L-Carnitine)
      • Antioxidants (Vitamin E, Curcumin)
      • Choline & Citicoline
      • Other Brain-Boosting Nutrients (Lutein, Inositol)
    • Y-o-Y Growth Trend Analysis By Ingredient Type, 2020 to 2024
    • Absolute $ Opportunity Analysis By Ingredient Type, 2025 to 2035
  7. Global Market Analysis 2020 to 2024 and Forecast 2025 to 2035, By Formulation Type
    • Introduction / Key Findings
    • Historical Market Size Value (USD Million) & Volume (MT) Analysis By Formulation Type, 2020 to 2024
    • Current and Future Market Size Value (USD Million) & Volume (MT) Analysis and Forecast By Formulation Type, 2025 to 2035
      • Gummies
      • Chewable Tablets
      • Powders
      • Syrups & Liquids
      • Capsules
    • Y-o-Y Growth Trend Analysis By Formulation Type, 2020 to 2024
    • Absolute $ Opportunity Analysis By Formulation Type, 2025 to 2035
  8. Global Market Analysis 2020 to 2024 and Forecast 2025 to 2035, By Health Benefit
    • Introduction / Key Findings
    • Historical Market Size Value (USD Million) & Volume (MT) Analysis By Health Benefit, 2020 to 2024
    • Current and Future Market Size Value (USD Million) & Volume (MT) Analysis and Forecast By Health Benefit, 2025 to 2035
      • Cognitive Development
      • Memory & Concentration
      • Attention & Focus
      • Learning Support
      • Stress & Mood Regulation
      • Sleep Support
    • Y-o-Y Growth Trend Analysis By Health Benefit, 2020 to 2024
    • Absolute $ Opportunity Analysis By Health Benefit, 2025 to 2035
  9. Global Market Analysis 2020 to 2024 and Forecast 2025 to 2035, By Age Group
    • Introduction / Key Findings
    • Historical Market Size Value (USD Million) & Volume (MT) Analysis By Age Group, 2020 to 2024
    • Current and Future Market Size Value (USD Million) & Volume (MT) Analysis and Forecast By Age Group, 2025 to 2035
      • Toddlers (1-3 years)
      • Early Childhood (4-7 years)
      • Pre-teens (8-12 years)
    • Y-o-Y Growth Trend Analysis By Age Group, 2020 to 2024
    • Absolute $ Opportunity Analysis By Age Group, 2025 to 2035
  10. Global Market Analysis 2020 to 2024 and Forecast 2025 to 2035, By Sales Channel
    • Introduction / Key Findings
    • Historical Market Size Value (USD Million) & Volume (MT) Analysis By Sales Channel, 2020 to 2024
    • Current and Future Market Size Value (USD Million) & Volume (MT) Analysis and Forecast By Sales Channel, 2025 to 2035
      • Pharmacies & Drugstores
      • Health & Nutrition Stores
      • Online Retail
      • Supermarkets & Hypermarkets
      • Pediatric Clinics & Healthcare Providers
    • Y-o-Y Growth Trend Analysis By Sales Channel, 2020 to 2024
    • Absolute $ Opportunity Analysis By Sales Channel, 2025 to 2035
  11. Global Market Analysis 2020 to 2024 and Forecast 2025 to 2035, By End User
    • Introduction / Key Findings
    • Historical Market Size Value (USD Million) & Volume (MT) Analysis By End User, 2020 to 2024
    • Current and Future Market Size Value (USD Million) & Volume (MT) Analysis and Forecast By End User, 2025 to 2035
      • Children with Typical Development
      • Children with Learning or Attention Challenges
      • Health-Conscious Parents Seeking Preventive Nutrition
    • Y-o-Y Growth Trend Analysis By End User, 2020 to 2024
    • Absolute $ Opportunity Analysis By End User, 2025 to 2035
  12. Global Market Analysis 2020 to 2024 and Forecast 2025 to 2035, By Region
    • Introduction
    • Historical Market Size Value (USD Million) & Volume (MT) Analysis By Region, 2020 to 2024
    • Current Market Size Value (USD Million) & Volume (MT) Analysis and Forecast By Region, 2025 to 2035
      • North America
      • Latin America
      • Europe
      • East Asia
      • South Asia & Pacific
      • Middle East & Africa
    • Market Attractiveness Analysis By Region
  13. North America Market Analysis 2020 to 2024 and Forecast 2025 to 2035, By Country
    • Historical Market Size Value (USD Million) & Volume (MT) Trend Analysis By Market Taxonomy, 2020 to 2024
    • Market Size Value (USD Million) & Volume (MT) Forecast By Market Taxonomy, 2025 to 2035
      • By Country
        • USA
        • Canada
      • By Ingredient Type
      • By Formulation Type
      • By Health Benefit
      • By Age Group
      • By Sales Channel
      • By End User
    • Market Attractiveness Analysis
      • By Country
      • By Ingredient Type
      • By Formulation Type
      • By Health Benefit
      • By Age Group
      • By Sales Channel
      • By End User
    • Key Takeaways
  14. Latin America Market Analysis 2020 to 2024 and Forecast 2025 to 2035, By Country
    • Historical Market Size Value (USD Million) & Volume (MT) Trend Analysis By Market Taxonomy, 2020 to 2024
    • Market Size Value (USD Million) & Volume (MT) Forecast By Market Taxonomy, 2025 to 2035
      • By Country
        • Brazil
        • Mexico
        • Colombia
        • Rest of Latin America
      • By Ingredient Type
      • By Formulation Type
      • By Health Benefit
      • By Age Group
      • By Sales Channel
      • By End User
    • Market Attractiveness Analysis
      • By Country
      • By Ingredient Type
      • By Formulation Type
      • By Health Benefit
      • By Age Group
      • By Sales Channel
      • By End User
    • Key Takeaways
  15. Europe Market Analysis 2020 to 2024 and Forecast 2025 to 2035, By Country
    • Historical Market Size Value (USD Million) & Volume (MT) Trend Analysis By Market Taxonomy, 2020 to 2024
    • Market Size Value (USD Million) & Volume (MT) Forecast By Market Taxonomy, 2025 to 2035
      • By Country
        • Germany
        • UK
        • France
        • Italy
        • Spain
        • Belgium
        • Netherlands
        • Nordic
        • Switzerland
        • Russia
        • Poland
        • Rest of Europe
      • By Ingredient Type
      • By Formulation Type
      • By Health Benefit
      • By Age Group
      • By Sales Channel
      • By End User
    • Market Attractiveness Analysis
      • By Country
      • By Ingredient Type
      • By Formulation Type
      • By Health Benefit
      • By Age Group
      • By Sales Channel
      • By End User
    • Key Takeaways
  16. East Asia Market Analysis 2020 to 2024 and Forecast 2025 to 2035, By Country
    • Historical Market Size Value (USD Million) & Volume (MT) Trend Analysis By Market Taxonomy, 2020 to 2024
    • Market Size Value (USD Million) & Volume (MT) Forecast By Market Taxonomy, 2025 to 2035
      • By Country
        • China
        • Japan
        • South Korea
      • By Ingredient Type
      • By Formulation Type
      • By Health Benefit
      • By Age Group
      • By Sales Channel
      • By End User
    • Market Attractiveness Analysis
      • By Country
      • By Ingredient Type
      • By Formulation Type
      • By Health Benefit
      • By Age Group
      • By Sales Channel
      • By End User
    • Key Takeaways
  17. South Asia & Pacific Market Analysis 2020 to 2024 and Forecast 2025 to 2035, By Country
    • Historical Market Size Value (USD Million) & Volume (MT) Trend Analysis By Market Taxonomy, 2020 to 2024
    • Market Size Value (USD Million) & Volume (MT) Forecast By Market Taxonomy, 2025 to 2035
      • By Country
        • India
        • Thailand
        • Malaysia
        • Indonesia
        • Singapore
        • Vietnam
        • Australia
        • New Zealand
        • Rest of South Asia
      • By Ingredient Type
      • By Formulation Type
      • By Health Benefit
      • By Age Group
      • By Sales Channel
      • By End User
    • Market Attractiveness Analysis
      • By Country
      • By Ingredient Type
      • By Formulation Type
      • By Health Benefit
      • By Age Group
      • By Sales Channel
      • By End User
    • Key Takeaways
  18. Middle East & Africa Market Analysis 2020 to 2024 and Forecast 2025 to 2035, By Country
    • Historical Market Size Value (USD Million) & Volume (MT) Trend Analysis By Market Taxonomy, 2020 to 2024
    • Market Size Value (USD Million) & Volume (MT) Forecast By Market Taxonomy, 2025 to 2035
      • By Country
        • Kingdom of Saudi Arabia
        • Other GCC Countries
        • Turkiye
        • South Africa
        • Other African Union
        • Rest of Middle East & Africa
      • By Ingredient Type
      • By Formulation Type
      • By Health Benefit
      • By Age Group
      • By Sales Channel
      • By End User
    • Market Attractiveness Analysis
      • By Country
      • By Ingredient Type
      • By Formulation Type
      • By Health Benefit
      • By Age Group
      • By Sales Channel
      • By End User
    • Key Takeaways
  19. Key Countries Market Analysis
    • USA
      • Pricing Analysis
      • Market Share Analysis, 2024
        • By Ingredient Type
        • By Formulation Type
        • By Health Benefit
        • By Age Group
        • By Sales Channel
        • By End User
    • Canada
      • Pricing Analysis
      • Market Share Analysis, 2024
        • By Ingredient Type
        • By Formulation Type
        • By Health Benefit
        • By Age Group
        • By Sales Channel
        • By End User
    • Brazil
      • Pricing Analysis
      • Market Share Analysis, 2024
        • By Ingredient Type
        • By Formulation Type
        • By Health Benefit
        • By Age Group
        • By Sales Channel
        • By End User
    • Mexico
      • Pricing Analysis
      • Market Share Analysis, 2024
        • By Ingredient Type
        • By Formulation Type
        • By Health Benefit
        • By Age Group
        • By Sales Channel
        • By End User
    • Colombia
      • Pricing Analysis
      • Market Share Analysis, 2024
        • By Ingredient Type
        • By Formulation Type
        • By Health Benefit
        • By Age Group
        • By Sales Channel
        • By End User
    • Germany
      • Pricing Analysis
      • Market Share Analysis, 2024
        • By Ingredient Type
        • By Formulation Type
        • By Health Benefit
        • By Age Group
        • By Sales Channel
        • By End User
    • UK
      • Pricing Analysis
      • Market Share Analysis, 2024
        • By Ingredient Type
        • By Formulation Type
        • By Health Benefit
        • By Age Group
        • By Sales Channel
        • By End User
    • France
      • Pricing Analysis
      • Market Share Analysis, 2024
        • By Ingredient Type
        • By Formulation Type
        • By Health Benefit
        • By Age Group
        • By Sales Channel
        • By End User
    • Italy
      • Pricing Analysis
      • Market Share Analysis, 2024
        • By Ingredient Type
        • By Formulation Type
        • By Health Benefit
        • By Age Group
        • By Sales Channel
        • By End User
    • Spain
      • Pricing Analysis
      • Market Share Analysis, 2024
        • By Ingredient Type
        • By Formulation Type
        • By Health Benefit
        • By Age Group
        • By Sales Channel
        • By End User
    • Belgium
      • Pricing Analysis
      • Market Share Analysis, 2024
        • By Ingredient Type
        • By Formulation Type
        • By Health Benefit
        • By Age Group
        • By Sales Channel
        • By End User
    • Netherlands
      • Pricing Analysis
      • Market Share Analysis, 2024
        • By Ingredient Type
        • By Formulation Type
        • By Health Benefit
        • By Age Group
        • By Sales Channel
        • By End User
    • Nordic
      • Pricing Analysis
      • Market Share Analysis, 2024
        • By Ingredient Type
        • By Formulation Type
        • By Health Benefit
        • By Age Group
        • By Sales Channel
        • By End User
    • Switzerland
      • Pricing Analysis
      • Market Share Analysis, 2024
        • By Ingredient Type
        • By Formulation Type
        • By Health Benefit
        • By Age Group
        • By Sales Channel
        • By End User
    • Russia
      • Pricing Analysis
      • Market Share Analysis, 2024
        • By Ingredient Type
        • By Formulation Type
        • By Health Benefit
        • By Age Group
        • By Sales Channel
        • By End User
    • Poland
      • Pricing Analysis
      • Market Share Analysis, 2024
        • By Ingredient Type
        • By Formulation Type
        • By Health Benefit
        • By Age Group
        • By Sales Channel
        • By End User
    • China
      • Pricing Analysis
      • Market Share Analysis, 2024
        • By Ingredient Type
        • By Formulation Type
        • By Health Benefit
        • By Age Group
        • By Sales Channel
        • By End User
    • Japan
      • Pricing Analysis
      • Market Share Analysis, 2024
        • By Ingredient Type
        • By Formulation Type
        • By Health Benefit
        • By Age Group
        • By Sales Channel
        • By End User
    • South Korea
      • Pricing Analysis
      • Market Share Analysis, 2024
        • By Ingredient Type
        • By Formulation Type
        • By Health Benefit
        • By Age Group
        • By Sales Channel
        • By End User
    • India
      • Pricing Analysis
      • Market Share Analysis, 2024
        • By Ingredient Type
        • By Formulation Type
        • By Health Benefit
        • By Age Group
        • By Sales Channel
        • By End User
    • Thailand
      • Pricing Analysis
      • Market Share Analysis, 2024
        • By Ingredient Type
        • By Formulation Type
        • By Health Benefit
        • By Age Group
        • By Sales Channel
        • By End User
    • Indonesia
      • Pricing Analysis
      • Market Share Analysis, 2024
        • By Ingredient Type
        • By Formulation Type
        • By Health Benefit
        • By Age Group
        • By Sales Channel
        • By End User
    • Australia
      • Pricing Analysis
      • Market Share Analysis, 2024
        • By Ingredient Type
        • By Formulation Type
        • By Health Benefit
        • By Age Group
        • By Sales Channel
        • By End User
    • New Zealand
      • Pricing Analysis
      • Market Share Analysis, 2024
        • By Ingredient Type
        • By Formulation Type
        • By Health Benefit
        • By Age Group
        • By Sales Channel
        • By End User
    • Turkey
      • Pricing Analysis
      • Market Share Analysis, 2024
        • By Ingredient Type
        • By Formulation Type
        • By Health Benefit
        • By Age Group
        • By Sales Channel
        • By End User
    • UAE
      • Pricing Analysis
      • Market Share Analysis, 2024
        • By Ingredient Type
        • By Formulation Type
        • By Health Benefit
        • By Age Group
        • By Sales Channel
        • By End User
    • Saudi Arabia
      • Pricing Analysis
      • Market Share Analysis, 2024
        • By Ingredient Type
        • By Formulation Type
        • By Health Benefit
        • By Age Group
        • By Sales Channel
        • By End User
    • Israel
      • Pricing Analysis
      • Market Share Analysis, 2024
        • By Ingredient Type
        • By Formulation Type
        • By Health Benefit
        • By Age Group
        • By Sales Channel
        • By End User
    • North Africa
      • Pricing Analysis
      • Market Share Analysis, 2024
        • By Ingredient Type
        • By Formulation Type
        • By Health Benefit
        • By Age Group
        • By Sales Channel
        • By End User
    • South Africa
      • Pricing Analysis
      • Market Share Analysis, 2024
        • By Ingredient Type
        • By Formulation Type
        • By Health Benefit
        • By Age Group
        • By Sales Channel
        • By End User
  20. Market Structure Analysis
    • Competition Dashboard
    • Competition Benchmarking
    • Market Share Analysis of Top Players
      • By Regional
      • By Ingredient Type
      • By Formulation Type
      • By Health Benefit
      • By Age Group
      • By Sales Channel
      • By End User
  21. Competition Analysis
    • Competition Deep Dive
      • Nestlé Health Science
        • Overview
        • Product Portfolio
        • Profitability by Market Segments (Product/Age /Sales Channel/Region)
        • Sales Footprint
        • Strategy Overview
        • Abbott Nutrition
        • Reckitt Benckiser (Enfamil)
        • Bayer AG
        • Herbalife Nutrition
        • Amway (Nutrilite)
        • Nature’s Way
        • SmartyPants Vitamins
        • Nordic Naturals
        • MegaFood
    • Assumptions & Acronyms Used

Research Methodology

List of Tables

  • Table 1: Global Market Value (USD Million) Forecast by Region, 2020-2035
  • Table 2: Global Market Volume (MT) Forecast by Region, 2020-2035
  • Table 3: Global Market Value (USD Million) Forecast by Ingredient Type, 2020-2035
  • Table 4: Global Market Volume (MT) Forecast by Ingredient Type, 2020-2035
  • Table 5: Global Market Value (USD Million) Forecast by Formulation Type, 2020-2035
  • Table 6: Global Market Volume (MT) Forecast by Formulation Type, 2020-2035
  • Table 7: Global Market Value (USD Million) Forecast by Health Benefit, 2020-2035
  • Table 8: Global Market Volume (MT) Forecast by Health Benefit, 2020-2035
  • Table 9: Global Market Value (USD Million) Forecast by Age Group, 2020-2035
  • Table 10: Global Market Volume (MT) Forecast by Age Group, 2020-2035
  • Table 11: Global Market Value (USD Million) Forecast by Sales Channel, 2020-2035
  • Table 12: Global Market Volume (MT) Forecast by Sales Channel, 2020-2035
  • Table 13: Global Market Value (USD Million) Forecast by End User, 2020-2035
  • Table 14: Global Market Volume (MT) Forecast by End User, 2020-2035
  • Table 15: North America Market Value (USD Million) Forecast by Country, 2020-2035
  • Table 16: North America Market Volume (MT) Forecast by Country, 2020-2035
  • Table 17: North America Market Value (USD Million) Forecast by Ingredient Type, 2020-2035
  • Table 18: North America Market Volume (MT) Forecast by Ingredient Type, 2020-2035
  • Table 19: North America Market Value (USD Million) Forecast by Formulation Type, 2020-2035
  • Table 20: North America Market Volume (MT) Forecast by Formulation Type, 2020-2035
  • Table 21: North America Market Value (USD Million) Forecast by Health Benefit, 2020-2035
  • Table 22: North America Market Volume (MT) Forecast by Health Benefit, 2020-2035
  • Table 23: North America Market Value (USD Million) Forecast by Age Group, 2020-2035
  • Table 24: North America Market Volume (MT) Forecast by Age Group, 2020-2035
  • Table 25: North America Market Value (USD Million) Forecast by Sales Channel, 2020-2035
  • Table 26: North America Market Volume (MT) Forecast by Sales Channel, 2020-2035
  • Table 27: North America Market Value (USD Million) Forecast by End User, 2020-2035
  • Table 28: North America Market Volume (MT) Forecast by End User, 2020-2035
  • Table 29: Latin America Market Value (USD Million) Forecast by Country, 2020-2035
  • Table 30: Latin America Market Volume (MT) Forecast by Country, 2020-2035
  • Table 31: Latin America Market Value (USD Million) Forecast by Ingredient Type, 2020-2035
  • Table 32: Latin America Market Volume (MT) Forecast by Ingredient Type, 2020-2035
  • Table 33: Latin America Market Value (USD Million) Forecast by Formulation Type, 2020-2035
  • Table 34: Latin America Market Volume (MT) Forecast by Formulation Type, 2020-2035
  • Table 35: Latin America Market Value (USD Million) Forecast by Health Benefit, 2020-2035
  • Table 36: Latin America Market Volume (MT) Forecast by Health Benefit, 2020-2035
  • Table 37: Latin America Market Value (USD Million) Forecast by Age Group, 2020-2035
  • Table 38: Latin America Market Volume (MT) Forecast by Age Group, 2020-2035
  • Table 39: Latin America Market Value (USD Million) Forecast by Sales Channel, 2020-2035
  • Table 40: Latin America Market Volume (MT) Forecast by Sales Channel, 2020-2035
  • Table 41: Latin America Market Value (USD Million) Forecast by End User, 2020-2035
  • Table 42: Latin America Market Volume (MT) Forecast by End User, 2020-2035
  • Table 43: Europe Market Value (USD Million) Forecast by Country, 2020-2035
  • Table 44: Europe Market Volume (MT) Forecast by Country, 2020-2035
  • Table 45: Europe Market Value (USD Million) Forecast by Ingredient Type, 2020-2035
  • Table 46: Europe Market Volume (MT) Forecast by Ingredient Type, 2020-2035
  • Table 47: Europe Market Value (USD Million) Forecast by Formulation Type, 2020-2035
  • Table 48: Europe Market Volume (MT) Forecast by Formulation Type, 2020-2035
  • Table 49: Europe Market Value (USD Million) Forecast by Health Benefit, 2020-2035
  • Table 50: Europe Market Volume (MT) Forecast by Health Benefit, 2020-2035
  • Table 51: Europe Market Value (USD Million) Forecast by Age Group, 2020-2035
  • Table 52: Europe Market Volume (MT) Forecast by Age Group, 2020-2035
  • Table 53: Europe Market Value (USD Million) Forecast by Sales Channel, 2020-2035
  • Table 54: Europe Market Volume (MT) Forecast by Sales Channel, 2020-2035
  • Table 55: Europe Market Value (USD Million) Forecast by End User, 2020-2035
  • Table 56: Europe Market Volume (MT) Forecast by End User, 2020-2035
  • Table 57: East Asia Market Value (USD Million) Forecast by Country, 2020-2035
  • Table 58: East Asia Market Volume (MT) Forecast by Country, 2020-2035
  • Table 59: East Asia Market Value (USD Million) Forecast by Ingredient Type, 2020-2035
  • Table 60: East Asia Market Volume (MT) Forecast by Ingredient Type, 2020-2035
  • Table 61: East Asia Market Value (USD Million) Forecast by Formulation Type, 2020-2035
  • Table 62: East Asia Market Volume (MT) Forecast by Formulation Type, 2020-2035
  • Table 63: East Asia Market Value (USD Million) Forecast by Health Benefit, 2020-2035
  • Table 64: East Asia Market Volume (MT) Forecast by Health Benefit, 2020-2035
  • Table 65: East Asia Market Value (USD Million) Forecast by Age Group, 2020-2035
  • Table 66: East Asia Market Volume (MT) Forecast by Age Group, 2020-2035
  • Table 67: East Asia Market Value (USD Million) Forecast by Sales Channel, 2020-2035
  • Table 68: East Asia Market Volume (MT) Forecast by Sales Channel, 2020-2035
  • Table 69: East Asia Market Value (USD Million) Forecast by End User, 2020-2035
  • Table 70: East Asia Market Volume (MT) Forecast by End User, 2020-2035
  • Table 71: South Asia & Pacific Market Value (USD Million) Forecast by Country, 2020-2035
  • Table 72: South Asia & Pacific Market Volume (MT) Forecast by Country, 2020-2035
  • Table 73: South Asia & Pacific Market Value (USD Million) Forecast by Ingredient Type, 2020-2035
  • Table 74: South Asia & Pacific Market Volume (MT) Forecast by Ingredient Type, 2020-2035
  • Table 75: South Asia & Pacific Market Value (USD Million) Forecast by Formulation Type, 2020-2035
  • Table 76: South Asia & Pacific Market Volume (MT) Forecast by Formulation Type, 2020-2035
  • Table 77: South Asia & Pacific Market Value (USD Million) Forecast by Health Benefit, 2020-2035
  • Table 78: South Asia & Pacific Market Volume (MT) Forecast by Health Benefit, 2020-2035
  • Table 79: South Asia & Pacific Market Value (USD Million) Forecast by Age Group, 2020-2035
  • Table 80: South Asia & Pacific Market Volume (MT) Forecast by Age Group, 2020-2035
  • Table 81: South Asia & Pacific Market Value (USD Million) Forecast by Sales Channel, 2020-2035
  • Table 82: South Asia & Pacific Market Volume (MT) Forecast by Sales Channel, 2020-2035
  • Table 83: South Asia & Pacific Market Value (USD Million) Forecast by End User, 2020-2035
  • Table 84: South Asia & Pacific Market Volume (MT) Forecast by End User, 2020-2035
  • Table 99: Middle East & Africa Market Value (USD Million) Forecast by Country, 2020-2035
  • Table 100: Middle East & Africa Market Volume (MT) Forecast by Country, 2020-2035
  • Table 101: Middle East & Africa Market Value (USD Million) Forecast by Ingredient Type, 2020-2035
  • Table 102: Middle East & Africa Market Volume (MT) Forecast by Ingredient Type, 2020-2035
  • Table 103: Middle East & Africa Market Value (USD Million) Forecast by Formulation Type, 2020-2035
  • Table 104: Middle East & Africa Market Volume (MT) Forecast by Formulation Type, 2020-2035
  • Table 105: Middle East & Africa Market Value (USD Million) Forecast by Health Benefit, 2020-2035
  • Table 106: Middle East & Africa Market Volume (MT) Forecast by Health Benefit, 2020-2035
  • Table 107: Middle East & Africa Market Value (USD Million) Forecast by Age Group, 2020-2035
  • Table 108: Middle East & Africa Market Volume (MT) Forecast by Age Group, 2020-2035
  • Table 109: Middle East & Africa Market Value (USD Million) Forecast by Sales Channel, 2020-2035
  • Table 110: Middle East & Africa Market Volume (MT) Forecast by Sales Channel, 2020-2035
  • Table 111: Middle East & Africa Market Value (USD Million) Forecast by End User, 2020-2035
  • Table 112: Middle East & Africa Market Volume (MT) Forecast by End User, 2020-2035

List of Figures

  • Figure 1: Global Market Volume (MT) Forecast 2020-2035
  • Figure 2: Global Market Pricing Analysis
  • Figure 3: Global Market Value (USD Million) Forecast 2020-2035
  • Figure 4: Global Market Value Share and BPS Analysis by Ingredient Type, 2025 and 2035
  • Figure 5: Global Market Y-o-Y Growth Comparison by Ingredient Type, 2025-2035
  • Figure 6: Global Market Attractiveness Analysis by Ingredient Type
  • Figure 7: Global Market Value Share and BPS Analysis by Formulation Type, 2025 and 2035
  • Figure 8: Global Market Y-o-Y Growth Comparison by Formulation Type, 2025-2035
  • Figure 9: Global Market Attractiveness Analysis by Formulation Type
  • Figure 10: Global Market Value Share and BPS Analysis by Health Benefit, 2025 and 2035
  • Figure 11: Global Market Y-o-Y Growth Comparison by Health Benefit, 2025-2035
  • Figure 12: Global Market Attractiveness Analysis by Health Benefit
  • Figure 13: Global Market Value Share and BPS Analysis by Age Group, 2025 and 2035
  • Figure 14: Global Market Y-o-Y Growth Comparison by Age Group, 2025-2035
  • Figure 15: Global Market Attractiveness Analysis by Age Group
  • Figure 16: Global Market Value Share and BPS Analysis by Sales Channel, 2025 and 2035
  • Figure 17: Global Market Y-o-Y Growth Comparison by Sales Channel, 2025-2035
  • Figure 18: Global Market Attractiveness Analysis by Sales Channel
  • Figure 19: Global Market Value Share and BPS Analysis by End User, 2025 and 2035
  • Figure 20: Global Market Y-o-Y Growth Comparison by End User, 2025-2035
  • Figure 21: Global Market Attractiveness Analysis by End User
  • Figure 22: Global Market Value (USD Million) Share and BPS Analysis by Region, 2025 and 2035
  • Figure 23: Global Market Y-o-Y Growth Comparison by Region, 2025-2035
  • Figure 24: Global Market Attractiveness Analysis by Region
  • Figure 25: North America Market Incremental $ Opportunity, 2025-2035
  • Figure 26: Latin America Market Incremental $ Opportunity, 2025-2035
  • Figure 27: Europe Market Incremental $ Opportunity, 2025-2035
  • Figure 28: East Asia Market Incremental $ Opportunity, 2025-2035
  • Figure 29: South Asia & Pacific Market Incremental $ Opportunity, 2025-2035
  • Figure 31: Middle East & Africa Market Incremental $ Opportunity, 2025-2035
  • Figure 32: North America Market Value Share and BPS Analysis by Country, 2025 and 2035
  • Figure 33: North America Market Value Share and BPS Analysis by Ingredient Type, 2025 and 2035
  • Figure 34: North America Market Y-o-Y Growth Comparison by Ingredient Type, 2025-2035
  • Figure 35: North America Market Attractiveness Analysis by Ingredient Type
  • Figure 36: North America Market Value Share and BPS Analysis by Formulation Type, 2025 and 2035
  • Figure 37: North America Market Y-o-Y Growth Comparison by Formulation Type, 2025-2035
  • Figure 38: North America Market Attractiveness Analysis by Formulation Type
  • Figure 39: North America Market Value Share and BPS Analysis by Health Benefit, 2025 and 2035
  • Figure 40: North America Market Y-o-Y Growth Comparison by Health Benefit, 2025-2035
  • Figure 41: North America Market Attractiveness Analysis by Health Benefit
  • Figure 42: North America Market Value Share and BPS Analysis by Age Group, 2025 and 2035
  • Figure 43: North America Market Y-o-Y Growth Comparison by Age Group, 2025-2035
  • Figure 44: North America Market Attractiveness Analysis by Age Group
  • Figure 45: North America Market Value Share and BPS Analysis by Sales Channel, 2025 and 2035
  • Figure 46: North America Market Y-o-Y Growth Comparison by Sales Channel, 2025-2035
  • Figure 47: North America Market Attractiveness Analysis by Sales Channel
  • Figure 48: North America Market Value Share and BPS Analysis by End User, 2025 and 2035
  • Figure 49: North America Market Y-o-Y Growth Comparison by End User, 2025-2035
  • Figure 50: North America Market Attractiveness Analysis by End User
  • Figure 51: Latin America Market Value Share and BPS Analysis by Country, 2025 and 2035
  • Figure 52: Latin America Market Value Share and BPS Analysis by Ingredient Type, 2025 and 2035
  • Figure 53: Latin America Market Y-o-Y Growth Comparison by Ingredient Type, 2025-2035
  • Figure 54: Latin America Market Attractiveness Analysis by Ingredient Type
  • Figure 55: Latin America Market Value Share and BPS Analysis by Formulation Type, 2025 and 2035
  • Figure 56: Latin America Market Y-o-Y Growth Comparison by Formulation Type, 2025-2035
  • Figure 57: Latin America Market Attractiveness Analysis by Formulation Type
  • Figure 58: Latin America Market Value Share and BPS Analysis by Health Benefit, 2025 and 2035
  • Figure 59: Latin America Market Y-o-Y Growth Comparison by Health Benefit, 2025-2035
  • Figure 60: Latin America Market Attractiveness Analysis by Health Benefit
  • Figure 61: Latin America Market Value Share and BPS Analysis by Age Group, 2025 and 2035
  • Figure 62: Latin America Market Y-o-Y Growth Comparison by Age Group, 2025-2035
  • Figure 63: Latin America Market Attractiveness Analysis by Age Group
  • Figure 64: Latin America Market Value Share and BPS Analysis by Sales Channel, 2025 and 2035
  • Figure 65: Latin America Market Y-o-Y Growth Comparison by Sales Channel, 2025-2035
  • Figure 66: Latin America Market Attractiveness Analysis by Sales Channel
  • Figure 67: Latin America Market Value Share and BPS Analysis by End User, 2025 and 2035
  • Figure 68: Latin America Market Y-o-Y Growth Comparison by End User, 2025-2035
  • Figure 69: Latin America Market Attractiveness Analysis by End User
  • Figure 70: Europe Market Value Share and BPS Analysis by Country, 2025 and 2035
  • Figure 71: Europe Market Value Share and BPS Analysis by Ingredient Type, 2025 and 2035
  • Figure 72: Europe Market Y-o-Y Growth Comparison by Ingredient Type, 2025-2035
  • Figure 73: Europe Market Attractiveness Analysis by Ingredient Type
  • Figure 74: Europe Market Value Share and BPS Analysis by Formulation Type, 2025 and 2035
  • Figure 75: Europe Market Y-o-Y Growth Comparison by Formulation Type, 2025-2035
  • Figure 76: Europe Market Attractiveness Analysis by Formulation Type
  • Figure 77: Europe Market Value Share and BPS Analysis by Health Benefit, 2025 and 2035
  • Figure 78: Europe Market Y-o-Y Growth Comparison by Health Benefit, 2025-2035
  • Figure 79: Europe Market Attractiveness Analysis by Health Benefit
  • Figure 80: Europe Market Value Share and BPS Analysis by Age Group, 2025 and 2035
  • Figure 81: Europe Market Y-o-Y Growth Comparison by Age Group, 2025-2035
  • Figure 82: Europe Market Attractiveness Analysis by Age Group
  • Figure 83: Europe Market Value Share and BPS Analysis by Sales Channel, 2025 and 2035
  • Figure 84: Europe Market Y-o-Y Growth Comparison by Sales Channel, 2025-2035
  • Figure 85: Europe Market Attractiveness Analysis by Sales Channel
  • Figure 86: Europe Market Value Share and BPS Analysis by End User, 2025 and 2035
  • Figure 87: Europe Market Y-o-Y Growth Comparison by End User, 2025-2035
  • Figure 88: Europe Market Attractiveness Analysis by End User
  • Figure 89: East Asia Market Value Share and BPS Analysis by Country, 2025 and 2035
  • Figure 90: East Asia Market Value Share and BPS Analysis by Ingredient Type, 2025 and 2035
  • Figure 91: East Asia Market Y-o-Y Growth Comparison by Ingredient Type, 2025-2035
  • Figure 92: East Asia Market Attractiveness Analysis by Ingredient Type
  • Figure 93: East Asia Market Value Share and BPS Analysis by Formulation Type, 2025 and 2035
  • Figure 94: East Asia Market Y-o-Y Growth Comparison by Formulation Type, 2025-2035
  • Figure 95: East Asia Market Attractiveness Analysis by Formulation Type
  • Figure 96: East Asia Market Value Share and BPS Analysis by Health Benefit, 2025 and 2035
  • Figure 97: East Asia Market Y-o-Y Growth Comparison by Health Benefit, 2025-2035
  • Figure 98: East Asia Market Attractiveness Analysis by Health Benefit
  • Figure 99: East Asia Market Value Share and BPS Analysis by Age Group, 2025 and 2035
  • Figure 100: East Asia Market Y-o-Y Growth Comparison by Age Group, 2025-2035
  • Figure 101: East Asia Market Attractiveness Analysis by Age Group
  • Figure 102: East Asia Market Value Share and BPS Analysis by Sales Channel, 2025 and 2035
  • Figure 103: East Asia Market Y-o-Y Growth Comparison by Sales Channel, 2025-2035
  • Figure 104: East Asia Market Attractiveness Analysis by Sales Channel
  • Figure 105: East Asia Market Value Share and BPS Analysis by End User, 2025 and 2035
  • Figure 106: East Asia Market Y-o-Y Growth Comparison by End User, 2025-2035
  • Figure 107: East Asia Market Attractiveness Analysis by End User
  • Figure 108: South Asia & Pacific Market Value Share and BPS Analysis by Country, 2025 and 2035
  • Figure 109: South Asia & Pacific Market Value Share and BPS Analysis by Ingredient Type, 2025 and 2035
  • Figure 110: South Asia & Pacific Market Y-o-Y Growth Comparison by Ingredient Type, 2025-2035
  • Figure 111: South Asia & Pacific Market Attractiveness Analysis by Ingredient Type
  • Figure 112: South Asia & Pacific Market Value Share and BPS Analysis by Formulation Type, 2025 and 2035
  • Figure 113: South Asia & Pacific Market Y-o-Y Growth Comparison by Formulation Type, 2025-2035
  • Figure 114: South Asia & Pacific Market Attractiveness Analysis by Formulation Type
  • Figure 115: South Asia & Pacific Market Value Share and BPS Analysis by Health Benefit, 2025 and 2035
  • Figure 116: South Asia & Pacific Market Y-o-Y Growth Comparison by Health Benefit, 2025-2035
  • Figure 117: South Asia & Pacific Market Attractiveness Analysis by Health Benefit
  • Figure 118: South Asia & Pacific Market Value Share and BPS Analysis by Age Group, 2025 and 2035
  • Figure 119: South Asia & Pacific Market Y-o-Y Growth Comparison by Age Group, 2025-2035
  • Figure 120: South Asia & Pacific Market Attractiveness Analysis by Age Group
  • Figure 121: South Asia & Pacific Market Value Share and BPS Analysis by Sales Channel, 2025 and 2035
  • Figure 122: South Asia & Pacific Market Y-o-Y Growth Comparison by Sales Channel, 2025-2035
  • Figure 123: South Asia & Pacific Market Attractiveness Analysis by Sales Channel
  • Figure 124: South Asia & Pacific Market Value Share and BPS Analysis by End User, 2025 and 2035
  • Figure 125: South Asia & Pacific Market Y-o-Y Growth Comparison by End User, 2025-2035
  • Figure 126: South Asia & Pacific Market Attractiveness Analysis by End User
  • Figure 146: Middle East & Africa Market Value Share and BPS Analysis by Country, 2025 and 2035
  • Figure 147: Middle East & Africa Market Value Share and BPS Analysis by Ingredient Type, 2025 and 2035
  • Figure 148: Middle East & Africa Market Y-o-Y Growth Comparison by Ingredient Type, 2025-2035
  • Figure 149: Middle East & Africa Market Attractiveness Analysis by Ingredient Type
  • Figure 150: Middle East & Africa Market Value Share and BPS Analysis by Formulation Type, 2025 and 2035
  • Figure 151: Middle East & Africa Market Y-o-Y Growth Comparison by Formulation Type, 2025-2035
  • Figure 152: Middle East & Africa Market Attractiveness Analysis by Formulation Type
  • Figure 153: Middle East & Africa Market Value Share and BPS Analysis by Health Benefit, 2025 and 2035
  • Figure 154: Middle East & Africa Market Y-o-Y Growth Comparison by Health Benefit, 2025-2035
  • Figure 155: Middle East & Africa Market Attractiveness Analysis by Health Benefit
  • Figure 156: Middle East & Africa Market Value Share and BPS Analysis by Age Group, 2025 and 2035
  • Figure 157: Middle East & Africa Market Y-o-Y Growth Comparison by Age Group, 2025-2035
  • Figure 158: Middle East & Africa Market Attractiveness Analysis by Age Group
  • Figure 159: Middle East & Africa Market Value Share and BPS Analysis by Sales Channel, 2025 and 2035
  • Figure 160: Middle East & Africa Market Y-o-Y Growth Comparison by Sales Channel, 2025-2035
  • Figure 161: Middle East & Africa Market Attractiveness Analysis by Sales Channel
  • Figure 162: Middle East & Africa Market Value Share and BPS Analysis by End User, 2025 and 2035
  • Figure 163: Middle East & Africa Market Y-o-Y Growth Comparison by End User, 2025-2035
  • Figure 164: Middle East & Africa Market Attractiveness Analysis by End User
  • Figure 165: Global Market - Tier Structure Analysis
  • Figure 166: Global Market - Company Share Analysis

Frequently Asked Questions

How big is the Kids’ Brain Health Supplements Market in 2025?

The global Kids’ Brain Health Supplements Market is estimated to be valued at USD 7,235.6 million in 2025.

What will be the size of the Kids’ Brain Health Supplements Market in 2035?

The market size for the Kids’ Brain Health Supplements Market is projected to reach USD 13,171.1 million by 2035.

How much will the Kids’ Brain Health Supplements Market grow between 2025 and 2035?

The Kids’ Brain Health Supplements Market is expected to grow at a 6.2% CAGR between 2025 and 2035.

What are the key formulation types in the Kids’ Brain Health Supplements Market?

The key formulation types in the Kids’ Brain Health Supplements Market are gummies, capsules, powders, chewable tablets, and syrups & liquids.

Which formulation type will contribute a significant share in the Kids’ Brain Health Supplements Market in 2025?

In terms of formulation, the gummies segment is expected to command 30% share in the Kids’ Brain Health Supplements Market in 2025.

Explore Similar Insights

Future Market Insights

Kids’ Brain Health Supplements market