Implantable Infusion Pump Market
Implantable Infusion Pumps to be significantly deployed in the Oncology Segment
Implantable Infusion Pump Market by Product Type, Application, End User & Region - Forecast 2022 – 2032
Implantable Infusion Pump Market Outlook (2022-2032)
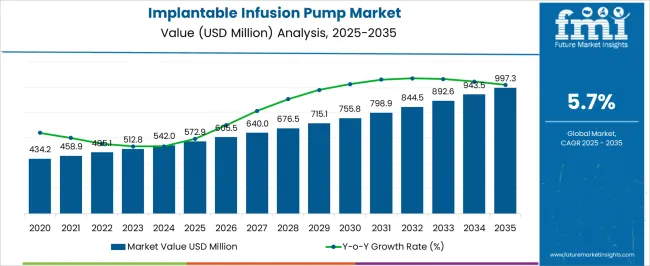
[290 Pages Report] The global implantable infusion pump market is expected to reach a valuation of US$ 485.1 Million in 2022. The increasing incidence of numerous disorders such as diabetes, cancer, and various other disorders among the population, combined with the growing liability of the elderly population, advanced technology are projected to be the market's primary growth drivers. Overall sales of implantable infusion pumps are projected to grow at a robust CAGR of 5.7% between 2022 and 2032, totaling around US$ 892.6 Million by the end of 2032.
An implantable infusion pump is a medical device that administers drugs to patients via intra-arterial, intravenous, subcutaneous, intraperitoneal, intrathecal, and epidural routes. A catheter is strung into the chosen place after the pump is surgically implanted in a subcutaneous pocket in the abdominal wall.
An implantable infusion pump's primary function is to deliver fluids, such as supplements and drugs, into a patient's body in a controllable environment. Implantable infusion pump are frequently used in clinical settings such as hospitals, specialty clinics, ambulatory surgical centers, and so on.
Data Points |
Key Statistics |
Implantable Infusion Pump Market Size (2022) |
US$ 485.1 Million |
Implantable Infusion Pump Market Revenue Forecast (2032) |
US$ 892.6 Million |
Implantable Infusion Pump Market Growth Rate (2022-2032) |
5.7% CAGR |
North America Market Share |
36.7% |
The dosage is customized for each patient. The implantable infusion pump only require recharging every 1 to 3 months. When employed to deliver drugs with FDA approval for this course of obtaining to and for the associated sign for the treatment of cancer, primary liver cancer, primary epithelial ovarian cancer, metastatic colorectal cancer, severe/chronic/intractable pain, and serious spasticity of cerebral origin in patients who are unresponsive to stand for oral baclofen therapeutic interventions, these medical devices are evaluated therapeutically crucial.
Let us know your requirement to get
100% FREE customization
Which Factors are driving the Growth of the Implantable Infusion Pump Market?
The principal factors propelling the expansion of the implantable infusion pump market are rising rates of cancer, diabetes, and obesity worldwide. A significant increase in implantable drug delivery techniques via surgeries is also driving up the consumption of infusion pump.
The delivery of chemotherapy agents and analgesics are the foremost activities; numerous implantable infusion pump are industrially obtainable to end users, which will drive sales at a significant rate over the forecasting period. The innovative implantable infusion pump provide long-term drug infusion at a differential or constant rate.
Contribution to progress from top manufacturers as a result of various factors, for example, growing prevalence of chronic diseases alongside an aging population, broadening adoption of convenient & advanced implantable infusion pump to reduce hospital facility use, and enduring increase in surgical procedural volumes.
Aside from that, advancements in technology and increased spending by manufacturers for the production of better implantable infusion pump will drive the development of this market, notably in the United States and Western Europe.
Which Factors are restraining the Growth of the Implantable Infusion Pump Market?
However, the FDA's stringent approval regulations for implantable infusion pump will constrain the industry's growth.
Furthermore, patient care risks and medical errors while drug delivery affiliated with implantable infusion pump in desirable areas may act as a limitation to the market's expansion. Product recalls and stringent regulations for innovative products may also restrict the overall implantable infusion pump market's growth throughout the forecast period.
Find your sweet spots for generating winning opportunities in this market.
Talk to AnalystHow Will Growth Unfold in the North America Implantable Infusion Pump Market?
North America is predicted to dominate the global Implantable Infusion Pump market in the coming years and account for a share of 36.7% of the global market in 2022. This dominance is due to the increasing number of chronic diseases, the purpose of healthcare infrastructure, and the presence of significant market players in the region.
Furthermore, supportive reimbursement programs covering the costs of implantable medical devices as well as the protocol inspired individuals in the region to choose such devices. Furthermore, the surging prevalence of chronic pain in the United States is anticipated to boost the market for implantable infusion pump.
According to CDC 2020 data, 20.4% of adults had chronic pain in 2019 and 7.4% of adults had severe pain that frequently restricted life or work activities. Both increased with age and were greatest among adults 65 and older. As a result, soaring chronic pain cases are expected to increase demand for implantable infusion pump, which are surgically implanted to provide consistent drug delivery for pain management in non-cancer patients. Furthermore, recent product authorization by the US Food and Drug Administration is anticipated to expand the regional market for implantable infusion pump.
Which Factors Pushing the Implantable Infusion Pump in the Asia Pacific?
The Asia Pacific, excluding Japan, is also predicted to experience substantial growth in the Implantable Infusion Pump Market owing to increased R&D activities, saturation in the advanced economies, and the advancement of healthcare infrastructure in this region.
The Asia-Pacific region, excluding Japan, has several small players that conduct business on a regional level and contribute to a significant portion of the Implantable Infusion Pump Market industry. Improved medical infrastructure and steadily increasing disposable income in emerging economies such as China and India, among many others, are also cruising the implantable infusion pump market.

A unified Market Research Subscription Platform, built for today's disparate research needs.
How Will Growth Unfold in the European Implantable Infusion Pump Market?
The market for implantable infusion pump in Europe is predicted to expand at a 6.2% annual rate from 2022 to 2032. The global increase in the healthcare sector is accelerating the development of the Europe infusion pump market. Europe is accounting for a share of 29.5% of the global market in 2022.
One of the key factors driving the expansion of the implantable infusion pump market is the emergence of the prevalence of chronic illnesses throughout the region. Clamor for ambulatory implantable infusion pump in home health care settings, as well as a boost in the number of ICU beds in countries with a high prevalence of COVID-19, compel market growth.
Category-wise Analysis
Which Segments Dominate the Global Implantable Infusion Pump Market?
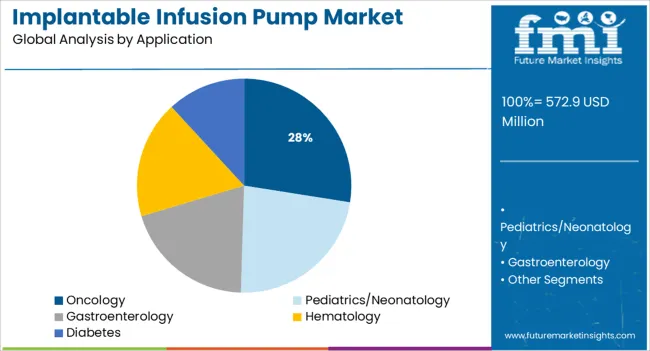
Cancer (Oncology) is anticipated to represent the largest portion of the implantable infusion pump application segment. This is due to the rise in cases of cancer among the global population. Cancer was the second-leading cause of death globally in 2018, causing an estimated 9.6 million deaths, or one in every six deaths, according to the WHO 2021 data, and approximately 300,000 new cases of cancer are detected each year among children aged 0-19 years.
Furthermore, 9,503,710 new cancer cases were reported in Asia, according to data from the Global Cancer Observatory 2020. As a result, rising cancer cases around the world may augment growth in the oncology segment.
The Start-Up Ecosystem: How key Players are opening Frontiers for Future Growth?
Manufacturers are adopting various marketing strategies such as new product launches, geographical expansion, mergers and acquisitions, partnerships, and collaboration to identify the interest of potential buyers and create a larger customer base. For instance,
- Innocoll was founded in 2014. XARACOLL, a bupivacaine-collagen-matrix implant developed by the company, has been examined in phase III clinical trials for postsurgical analgesia as part of multi-modal treatment for patients enduring hernia repair.
- Randy Goodall, Mauro Ferrari, and Dave Saathoff founded NanoMedical Systems (NMS) in 2007 to develop products and commercialise the PMDS drug delivery platform. NanoMedical Systems is also developing an implantable nanofluidics device for long-term, consistent drug delivery of various drugs.
Who are the Leading Players in Implantable Infusion Pump Market?
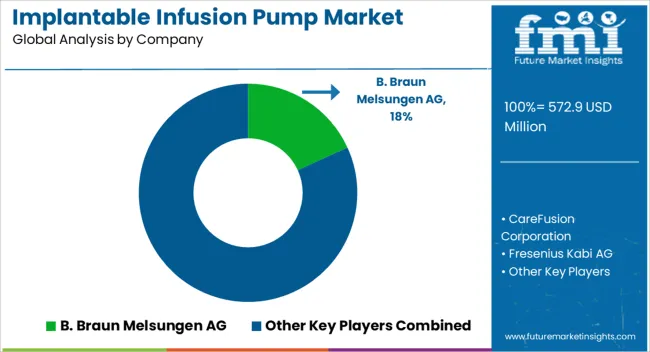
Some leading implantable infusion pump manufacturers include B. Braun Melsungen AG., CareFusion Corporation, Fresenius Kabi AG, Terumo Corporation, Medtronic Plc., Baxter International Inc., Smiths Medical, MOOG Inc., Johnson & Johnson Private Ltd., and Hospira, Inc., Flowonix, The Tandem Diabetes Care.
These key implantable infusion pump providers are adopting various strategies such as new product launches and approvals, partnerships, collaborations, acquisitions, mergers, etc. to increase their sales and gain a competitive edge in the global implantable infusion pump market. For instance,
- Flowonix received FDA authorization to market the Prometra® II Pump for use with Intrathecal Baclofen in February 2020.
- The Tandem Diabetes Care t:Slim X2 insulin pump with interoperable technology (interoperable t:Slim X2) for providing insulin under the skin for children and adults with diabetes was approved for branding by the US Food and Drug Administration in February 2019.
- Medtronic received pre-market approval from the US Food and Drug Administration for the SynchroMed II Implantable Infusion Pump and Implantable System for Remodulin in May 2020.
Key Segments of Implantable Infusion Pump Industry Survey
By Product Type:
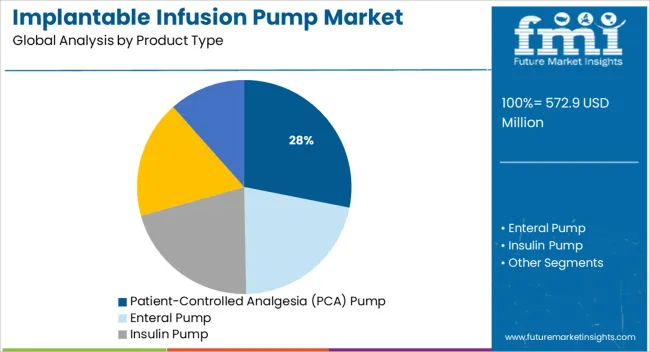
- Patient-Controlled Analgesia (PCA) Pump
- Enteral Pump
- Insulin Pump
- Elastomeric Pump
- Syringe Pump
By Application:
- Oncology
- Pediatrics/Neonatology
- Gastroenterology
- Hematology
- Diabetes
By End User:
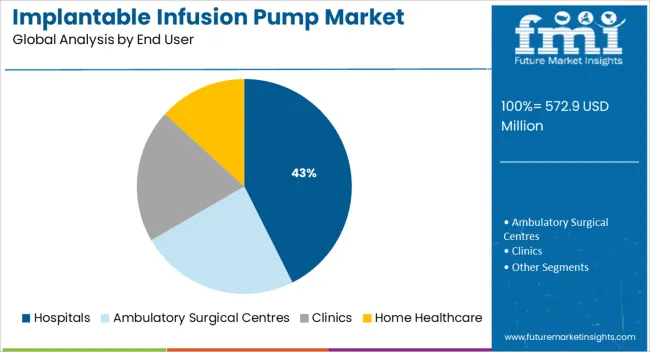
- Hospitals
- Ambulatory Surgical Centres
- Clinics
- Home Healthcare
By Region:
- North America Implantable Infusion Pump Market
- Latin America Implantable Infusion Pump Market
- Europe Implantable Infusion Pump Market
- Asia Pacific Implantable Infusion Pump Market
- Middle East & Africa Implantable Infusion Pump Market
Frequently Asked Questions
The global implantable infusion pump market reached US$ 485.1 Million in 2022
As per FMI, the implantable infusion pump market is expected to grow at a CAGR of 5.7% from 2022-2032
The global sales of implantable infusion pumps are anticipated to total a valuation of US$ 892.6 Million by 2032
North America will continue to remain the most lucrative, accounting for a share of 36.7% in 2022
Table of Content
1. Executive Summary
1.1. Global Market Outlook
1.2. Demand-side Trends
1.3. Supply-side Trends
1.4. Technology Roadmap Analysis
1.5. Analysis and Recommendations
2. Market Overview
2.1. Market Coverage / Taxonomy
2.2. Market Definition / Scope / Limitations
3. Market Background
3.1. Market Dynamics
3.1.1. Drivers
3.1.2. Restraints
3.1.3. Opportunity
3.1.4. Trends
3.2. Scenario Forecast
3.2.1. Demand in Optimistic Scenario
3.2.2. Demand in Likely Scenario
3.2.3. Demand in Conservative Scenario
3.3. Opportunity Map Analysis
3.4. Investment Feasibility Matrix
3.5. PESTLE and Porter’s Analysis
3.6. Regulatory Landscape
3.6.1. By Key Regions
3.6.2. By Key Countries
3.7. Regional Parent Market Outlook
4. Global Implantable Infusion Pumps Market Analysis 2016-2021 and Forecast, 2022-2032
4.1. Historical Market Size Value (US$ Mn) Analysis, 2016-2021
4.2. Current and Future Market Size Value (US$ Mn) Projections, 2022-2032
4.2.1. Y-o-Y Growth Trend Analysis
4.2.2. Absolute $ Opportunity Analysis
5. Global Implantable Infusion Pumps Market Analysis 2016-2021 and Forecast 2022-2032, By Product Type
5.1. Introduction / Key Findings
5.2. Historical Market Size Value (US$ Mn) Analysis By Product Type, 2016-2021
5.3. Current and Future Market Size Value (US$ Mn) Analysis and Forecast By Product Type, 2022-2032
5.3.1. Patient-Controlled Analgesia Pumps
5.3.2. Enteral Pumps
5.3.3. Insulin Pumps
5.3.4. Elastomeric Pumps
5.3.5. Syringe Pumps
5.4. Y-o-Y Growth Trend Analysis By Product Type, 2016-2021
5.5. Absolute $ Opportunity Analysis By Product Type, 2022-2032
6. Global Implantable Infusion Pumps Market Analysis 2016-2021 and Forecast 2022-2032, By Application
6.1. Introduction / Key Findings
6.2. Historical Market Size Value (US$ Mn) Analysis By Application, 2016-2021
6.3. Current and Future Market Size Value (US$ Mn) Analysis and Forecast By Application, 2022-2032
6.3.1. Oncology
6.3.2. Pediatrics/Neonatology
6.3.3. Gastroenterology
6.3.4. Hematology
6.3.5. Diabetes
6.4. Y-o-Y Growth Trend Analysis By Application, 2016-2021
6.5. Absolute $ Opportunity Analysis By Application, 2022-2032
7. Global Implantable Infusion Pumps Market Analysis 2016-2021 and Forecast 2022-2032, By End Users
7.1. Introduction / Key Findings
7.2. Historical Market Size Value (US$ Mn) Analysis By End Users, 2016-2021
7.3. Current and Future Market Size Value (US$ Mn) Analysis and Forecast By End Users, 2022-2032
7.3.1. Hospitals
7.3.2. Ambulatory Surgical Centres
7.3.3. Clinics
7.3.4. Home Healthcare
7.4. Y-o-Y Growth Trend Analysis By End Users, 2016-2021
7.5. Absolute $ Opportunity Analysis By End Users, 2022-2032
8. Global Implantable Infusion Pumps Market Analysis 2016-2021 and Forecast 2022-2032, By Region
8.1. Introduction
8.2. Historical Market Size Value (US$ Mn) Analysis By Region, 2016-2021
8.3. Current Market Size Value (US$ Mn) Analysis and Forecast By Region, 2022-2032
8.3.1. North America
8.3.2. Latin America
8.3.3. Europe
8.3.4. Asia Pacific
8.3.5. MEA
8.4. Market Attractiveness Analysis By Region
9. North America Implantable Infusion Pumps Market Analysis 2016-2021 and Forecast 2022-2032, By Country
9.1. Historical Market Size Value (US$ Mn) Trend Analysis By Market Taxonomy, 2016-2021
9.2. Market Size Value (US$ Mn) Forecast By Market Taxonomy, 2022-2032
9.2.1. By Country
9.2.1.1. U.S.
9.2.1.2. Canada
9.2.2. By Product Type
9.2.3. By Application
9.2.4. By End Users
9.3. Market Attractiveness Analysis
9.3.1. By Country
9.3.2. By Product Type
9.3.3. By Application
9.3.4. By End Users
9.4. Key Takeaways
10. Latin America Implantable Infusion Pumps Market Analysis 2016-2021 and Forecast 2022-2032, By Country
10.1. Historical Market Size Value (US$ Mn) Trend Analysis By Market Taxonomy, 2016-2021
10.2. Market Size Value (US$ Mn) Forecast By Market Taxonomy, 2022-2032
10.2.1. By Country
10.2.1.1. Brazil
10.2.1.2. Mexico
10.2.1.3. Rest of Latin America
10.2.2. By Product Type
10.2.3. By Application
10.2.4. By End Users
10.3. Market Attractiveness Analysis
10.3.1. By Country
10.3.2. By Product Type
10.3.3. By Application
10.3.4. By End Users
10.4. Key Takeaways
11. Europe Implantable Infusion Pumps Market Analysis 2016-2021 and Forecast 2022-2032, By Country
11.1. Historical Market Size Value (US$ Mn) Trend Analysis By Market Taxonomy, 2016-2021
11.2. Market Size Value (US$ Mn) Forecast By Market Taxonomy, 2022-2032
11.2.1. By Country
11.2.1.1. Germany
11.2.1.2. U.K.
11.2.1.3. France
11.2.1.4. Spain
11.2.1.5. Italy
11.2.1.6. Rest of Europe
11.2.2. By Product Type
11.2.3. By Application
11.2.4. By End Users
11.3. Market Attractiveness Analysis
11.3.1. By Country
11.3.2. By Product Type
11.3.3. By Application
11.3.4. By End Users
11.4. Key Takeaways
12. Asia Pacific Implantable Infusion Pumps Market Analysis 2016-2021 and Forecast 2022-2032, By Country
12.1. Historical Market Size Value (US$ Mn) Trend Analysis By Market Taxonomy, 2016-2021
12.2. Market Size Value (US$ Mn) Forecast By Market Taxonomy, 2022-2032
12.2.1. By Country
12.2.1.1. China
12.2.1.2. Japan
12.2.1.3. South Korea
12.2.1.4. Malaysia
12.2.1.5. Singapore
12.2.1.6. Australia
12.2.1.7. Rest of Asia Pacific
12.2.2. By Product Type
12.2.3. By Application
12.2.4. By End Users
12.3. Market Attractiveness Analysis
12.3.1. By Country
12.3.2. By Product Type
12.3.3. By Application
12.3.4. By End Users
12.4. Key Takeaways
13. MEA Implantable Infusion Pumps Market Analysis 2016-2021 and Forecast 2022-2032, By Country
13.1. Historical Market Size Value (US$ Mn) Trend Analysis By Market Taxonomy, 2016-2021
13.2. Market Size Value (US$ Mn) Forecast By Market Taxonomy, 2022-2032
13.2.1. By Country
13.2.1.1. GCC Countries
13.2.1.2. South Africa
13.2.1.3. Israel
13.2.1.4. Rest of MEA
13.2.2. By Product Type
13.2.3. By Application
13.2.4. By End Users
13.3. Market Attractiveness Analysis
13.3.1. By Country
13.3.2. By Product Type
13.3.3. By Application
13.3.4. By End Users
13.4. Key Takeaways
14. Key Countries Implantable Infusion Pumps Market Analysis
14.1. U.K.
14.1.1. Pricing Analysis
14.1.2. Market Share Analysis, 2021
14.1.2.1. By Product Type
14.1.2.2. By Application
14.1.2.3. By End Users
14.2. Canada
14.2.1. Pricing Analysis
14.2.2. Market Share Analysis, 2021
14.2.2.1. By Product Type
14.2.2.2. By Application
14.2.2.3. By End Users
14.3. Brazil
14.3.1. Pricing Analysis
14.3.2. Market Share Analysis, 2021
14.3.2.1. By Product Type
14.3.2.2. By Application
14.3.2.3. By End Users
14.4. Mexico
14.4.1. Pricing Analysis
14.4.2. Market Share Analysis, 2021
14.4.2.1. By Product Type
14.4.2.2. By Application
14.4.2.3. By End Users
14.5. Rest of Latin America
14.5.1. Pricing Analysis
14.5.2. Market Share Analysis, 2021
14.5.2.1. By Product Type
14.5.2.2. By Application
14.5.2.3. By End Users
14.6. Germany
14.6.1. Pricing Analysis
14.6.2. Market Share Analysis, 2021
14.6.2.1. By Product Type
14.6.2.2. By Application
14.6.2.3. By End Users
14.7. U.K.
14.7.1. Pricing Analysis
14.7.2. Market Share Analysis, 2021
14.7.2.1. By Product Type
14.7.2.2. By Application
14.7.2.3. By End Users
14.8. France
14.8.1. Pricing Analysis
14.8.2. Market Share Analysis, 2021
14.8.2.1. By Product Type
14.8.2.2. By Application
14.8.2.3. By End Users
14.9. Spain
14.9.1. Pricing Analysis
14.9.2. Market Share Analysis, 2021
14.9.2.1. By Product Type
14.9.2.2. By Application
14.9.2.3. By End Users
14.10. Italy
14.10.1. Pricing Analysis
14.10.2. Market Share Analysis, 2021
14.10.2.1. By Product Type
14.10.2.2. By Application
14.10.2.3. By End Users
14.11. Rest of Europe
14.11.1. Pricing Analysis
14.11.2. Market Share Analysis, 2021
14.11.2.1. By Product Type
14.11.2.2. By Application
14.11.2.3. By End Users
14.12. China
14.12.1. Pricing Analysis
14.12.2. Market Share Analysis, 2021
14.12.2.1. By Product Type
14.12.2.2. By Application
14.12.2.3. By End Users
14.13. Japan
14.13.1. Pricing Analysis
14.13.2. Market Share Analysis, 2021
14.13.2.1. By Product Type
14.13.2.2. By Application
14.13.2.3. By End Users
14.14. South Korea
14.14.1. Pricing Analysis
14.14.2. Market Share Analysis, 2021
14.14.2.1. By Product Type
14.14.2.2. By Application
14.14.2.3. By End Users
14.15. Malaysia
14.15.1. Pricing Analysis
14.15.2. Market Share Analysis, 2021
14.15.2.1. By Product Type
14.15.2.2. By Application
14.15.2.3. By End Users
14.16. Singapore
14.16.1. Pricing Analysis
14.16.2. Market Share Analysis, 2021
14.16.2.1. By Product Type
14.16.2.2. By Application
14.16.2.3. By End Users
14.17. Australia
14.17.1. Pricing Analysis
14.17.2. Market Share Analysis, 2021
14.17.2.1. By Product Type
14.17.2.2. By Application
14.17.2.3. By End Users
14.18. Rest of Asia Pacific
14.18.1. Pricing Analysis
14.18.2. Market Share Analysis, 2021
14.18.2.1. By Product Type
14.18.2.2. By Application
14.18.2.3. By End Users
14.19. GCC Countries
14.19.1. Pricing Analysis
14.19.2. Market Share Analysis, 2021
14.19.2.1. By Product Type
14.19.2.2. By Application
14.19.2.3. By End Users
14.20. South Africa
14.20.1. Pricing Analysis
14.20.2. Market Share Analysis, 2021
14.20.2.1. By Product Type
14.20.2.2. By Application
14.20.2.3. By End Users
14.21. Israel
14.21.1. Pricing Analysis
14.21.2. Market Share Analysis, 2021
14.21.2.1. By Product Type
14.21.2.2. By Application
14.21.2.3. By End Users
14.22. Rest of MEA
14.22.1. Pricing Analysis
14.22.2. Market Share Analysis, 2021
14.22.2.1. By Product Type
14.22.2.2. By Application
14.22.2.3. By End Users
15. Market Structure Analysis
15.1. Competition Dashboard
15.2. Competition Benchmarking
15.3. Market Share Analysis of Top Players
15.3.1. By Regional
15.3.2. By Product Type
15.3.3. By Application
15.3.4. By End Users
16. Competition Analysis
16.1. Competition Deep Dive
16.1.1. B. Braun Melsungen AG.
16.1.1.1. Overview
16.1.1.2. Product Portfolio
16.1.1.3. Profitability by Market Segments
16.1.1.4. Sales Footprint
16.1.1.5. Strategy Overview
16.1.1.5.1. Marketing Strategy
16.1.2. CareFusion Corporation
16.1.2.1. Overview
16.1.2.2. Product Portfolio
16.1.2.3. Profitability by Market Segments
16.1.2.4. Sales Footprint
16.1.2.5. Strategy Overview
16.1.2.5.1. Marketing Strategy
16.1.3. Fresenius Kabi AG
16.1.3.1. Overview
16.1.3.2. Product Portfolio
16.1.3.3. Profitability by Market Segments
16.1.3.4. Sales Footprint
16.1.3.5. Strategy Overview
16.1.3.5.1. Marketing Strategy
16.1.4. Terumo Corporation
16.1.4.1. Overview
16.1.4.2. Product Portfolio
16.1.4.3. Profitability by Market Segments
16.1.4.4. Sales Footprint
16.1.4.5. Strategy Overview
16.1.4.5.1. Marketing Strategy
16.1.5. Medtronic Plc.
16.1.5.1. Overview
16.1.5.2. Product Portfolio
16.1.5.3. Profitability by Market Segments
16.1.5.4. Sales Footprint
16.1.5.5. Strategy Overview
16.1.5.5.1. Marketing Strategy
16.1.6. Baxter International Inc.
16.1.6.1. Overview
16.1.6.2. Product Portfolio
16.1.6.3. Profitability by Market Segments
16.1.6.4. Sales Footprint
16.1.6.5. Strategy Overview
16.1.6.5.1. Marketing Strategy
16.1.7. Smiths Medical
16.1.7.1. Overview
16.1.7.2. Product Portfolio
16.1.7.3. Profitability by Market Segments
16.1.7.4. Sales Footprint
16.1.7.5. Strategy Overview
16.1.7.5.1. Marketing Strategy
16.1.8. MOOG Inc.,
16.1.8.1. Overview
16.1.8.2. Product Portfolio
16.1.8.3. Profitability by Market Segments
16.1.8.4. Sales Footprint
16.1.8.5. Strategy Overview
16.1.8.5.1. Marketing Strategy
16.1.9. Johnson & Johnson Private Ltd.
16.1.9.1. Overview
16.1.9.2. Product Portfolio
16.1.9.3. Profitability by Market Segments
16.1.9.4. Sales Footprint
16.1.9.5. Strategy Overview
16.1.9.5.1. Marketing Strategy
16.1.10. Pfizer
16.1.10.1. Overview
16.1.10.2. Product Portfolio
16.1.10.3. Profitability by Market Segments
16.1.10.4. Sales Footprint
16.1.10.5. Strategy Overview
16.1.10.5.1. Marketing Strategy
17. Assumptions & Acronyms Used
18. Research Methodology
Let us know your requirement to get
100% FREE customization
List of Tables
Table 1: Global Implantable Infusion Pumps Market Value (US$ Mn) Forecast by Region, 2016-2032
Table 2: Global Implantable Infusion Pumps Market Value (US$ Mn) Forecast by Product Type, 2016-2032
Table 3: Global Implantable Infusion Pumps Market Value (US$ Mn) Forecast by Application, 2016-2032
Table 4: Global Implantable Infusion Pumps Market Value (US$ Mn) Forecast by End Users, 2016-2032
Table 5: North America Implantable Infusion Pumps Market Value (US$ Mn) Forecast by Country, 2016-2032
Table 6: North America Implantable Infusion Pumps Market Value (US$ Mn) Forecast by Product Type, 2016-2032
Table 7: North America Implantable Infusion Pumps Market Value (US$ Mn) Forecast by Application, 2016-2032
Table 8: North America Implantable Infusion Pumps Market Value (US$ Mn) Forecast by End Users, 2016-2032
Table 9: Latin America Implantable Infusion Pumps Market Value (US$ Mn) Forecast by Country, 2016-2032
Table 10: Latin America Implantable Infusion Pumps Market Value (US$ Mn) Forecast by Product Type, 2016-2032
Table 11: Latin America Implantable Infusion Pumps Market Value (US$ Mn) Forecast by Application, 2016-2032
Table 12: Latin America Implantable Infusion Pumps Market Value (US$ Mn) Forecast by End Users, 2016-2032
Table 13: Europe Implantable Infusion Pumps Market Value (US$ Mn) Forecast by Country, 2016-2032
Table 14: Europe Implantable Infusion Pumps Market Value (US$ Mn) Forecast by Product Type, 2016-2032
Table 15: Europe Implantable Infusion Pumps Market Value (US$ Mn) Forecast by Application, 2016-2032
Table 16: Europe Implantable Infusion Pumps Market Value (US$ Mn) Forecast by End Users, 2016-2032
Table 17: Asia Pacific Implantable Infusion Pumps Market Value (US$ Mn) Forecast by Country, 2016-2032
Table 18: Asia Pacific Implantable Infusion Pumps Market Value (US$ Mn) Forecast by Product Type, 2016-2032
Table 19: Asia Pacific Implantable Infusion Pumps Market Value (US$ Mn) Forecast by Application, 2016-2032
Table 20: Asia Pacific Implantable Infusion Pumps Market Value (US$ Mn) Forecast by End Users, 2016-2032
Table 21: MEA Implantable Infusion Pumps Market Value (US$ Mn) Forecast by Country, 2016-2032
Table 22: MEA Implantable Infusion Pumps Market Value (US$ Mn) Forecast by Product Type, 2016-2032
Table 23: MEA Implantable Infusion Pumps Market Value (US$ Mn) Forecast by Application, 2016-2032
Table 24: MEA Implantable Infusion Pumps Market Value (US$ Mn) Forecast by End Users, 2016-2032
Find your sweet spots for generating winning opportunities in this market.
Talk to AnalystList of Charts
Figure 1: Global Implantable Infusion Pumps Market Value (US$ Mn) by Product Type, 2022-2032
Figure 2: Global Implantable Infusion Pumps Market Value (US$ Mn) by Application, 2022-2032
Figure 3: Global Implantable Infusion Pumps Market Value (US$ Mn) by End Users, 2022-2032
Figure 4: Global Implantable Infusion Pumps Market Value (US$ Mn) by Region, 2022-2032
Figure 5: Global Implantable Infusion Pumps Market Value (US$ Mn) Analysis by Region, 2016-2032
Figure 6: Global Implantable Infusion Pumps Market Value Share (%) and BPS Analysis by Region, 2022-2032
Figure 7: Global Implantable Infusion Pumps Market Y-o-Y Growth (%) Projections by Region, 2022-2032
Figure 8: Global Implantable Infusion Pumps Market Value (US$ Mn) Analysis by Product Type, 2016-2032
Figure 9: Global Implantable Infusion Pumps Market Value Share (%) and BPS Analysis by Product Type, 2022-2032
Figure 10: Global Implantable Infusion Pumps Market Y-o-Y Growth (%) Projections by Product Type, 2022-2032
Figure 11: Global Implantable Infusion Pumps Market Value (US$ Mn) Analysis by Application, 2016-2032
Figure 12: Global Implantable Infusion Pumps Market Value Share (%) and BPS Analysis by Application, 2022-2032
Figure 13: Global Implantable Infusion Pumps Market Y-o-Y Growth (%) Projections by Application, 2022-2032
Figure 14: Global Implantable Infusion Pumps Market Value (US$ Mn) Analysis by End Users, 2016-2032
Figure 15: Global Implantable Infusion Pumps Market Value Share (%) and BPS Analysis by End Users, 2022-2032
Figure 16: Global Implantable Infusion Pumps Market Y-o-Y Growth (%) Projections by End Users, 2022-2032
Figure 17: Global Implantable Infusion Pumps Market Attractiveness by Product Type, 2022-2032
Figure 18: Global Implantable Infusion Pumps Market Attractiveness by Application, 2022-2032
Figure 19: Global Implantable Infusion Pumps Market Attractiveness by End Users, 2022-2032
Figure 20: Global Implantable Infusion Pumps Market Attractiveness by Region, 2022-2032
Figure 21: North America Implantable Infusion Pumps Market Value (US$ Mn) by Product Type, 2022-2032
Figure 22: North America Implantable Infusion Pumps Market Value (US$ Mn) by Application, 2022-2032
Figure 23: North America Implantable Infusion Pumps Market Value (US$ Mn) by End Users, 2022-2032
Figure 24: North America Implantable Infusion Pumps Market Value (US$ Mn) by Country, 2022-2032
Figure 25: North America Implantable Infusion Pumps Market Value (US$ Mn) Analysis by Country, 2016-2032
Figure 26: North America Implantable Infusion Pumps Market Value Share (%) and BPS Analysis by Country, 2022-2032
Figure 27: North America Implantable Infusion Pumps Market Y-o-Y Growth (%) Projections by Country, 2022-2032
Figure 28: North America Implantable Infusion Pumps Market Value (US$ Mn) Analysis by Product Type, 2016-2032
Figure 29: North America Implantable Infusion Pumps Market Value Share (%) and BPS Analysis by Product Type, 2022-2032
Figure 30: North America Implantable Infusion Pumps Market Y-o-Y Growth (%) Projections by Product Type, 2022-2032
Figure 31: North America Implantable Infusion Pumps Market Value (US$ Mn) Analysis by Application, 2016-2032
Figure 32: North America Implantable Infusion Pumps Market Value Share (%) and BPS Analysis by Application, 2022-2032
Figure 33: North America Implantable Infusion Pumps Market Y-o-Y Growth (%) Projections by Application, 2022-2032
Figure 34: North America Implantable Infusion Pumps Market Value (US$ Mn) Analysis by End Users, 2016-2032
Figure 35: North America Implantable Infusion Pumps Market Value Share (%) and BPS Analysis by End Users, 2022-2032
Figure 36: North America Implantable Infusion Pumps Market Y-o-Y Growth (%) Projections by End Users, 2022-2032
Figure 37: North America Implantable Infusion Pumps Market Attractiveness by Product Type, 2022-2032
Figure 38: North America Implantable Infusion Pumps Market Attractiveness by Application, 2022-2032
Figure 39: North America Implantable Infusion Pumps Market Attractiveness by End Users, 2022-2032
Figure 40: North America Implantable Infusion Pumps Market Attractiveness by Country, 2022-2032
Figure 41: Latin America Implantable Infusion Pumps Market Value (US$ Mn) by Product Type, 2022-2032
Figure 42: Latin America Implantable Infusion Pumps Market Value (US$ Mn) by Application, 2022-2032
Figure 43: Latin America Implantable Infusion Pumps Market Value (US$ Mn) by End Users, 2022-2032
Figure 44: Latin America Implantable Infusion Pumps Market Value (US$ Mn) by Country, 2022-2032
Figure 45: Latin America Implantable Infusion Pumps Market Value (US$ Mn) Analysis by Country, 2016-2032
Figure 46: Latin America Implantable Infusion Pumps Market Value Share (%) and BPS Analysis by Country, 2022-2032
Figure 47: Latin America Implantable Infusion Pumps Market Y-o-Y Growth (%) Projections by Country, 2022-2032
Figure 48: Latin America Implantable Infusion Pumps Market Value (US$ Mn) Analysis by Product Type, 2016-2032
Figure 49: Latin America Implantable Infusion Pumps Market Value Share (%) and BPS Analysis by Product Type, 2022-2032
Figure 50: Latin America Implantable Infusion Pumps Market Y-o-Y Growth (%) Projections by Product Type, 2022-2032
Figure 51: Latin America Implantable Infusion Pumps Market Value (US$ Mn) Analysis by Application, 2016-2032
Figure 52: Latin America Implantable Infusion Pumps Market Value Share (%) and BPS Analysis by Application, 2022-2032
Figure 53: Latin America Implantable Infusion Pumps Market Y-o-Y Growth (%) Projections by Application, 2022-2032
Figure 54: Latin America Implantable Infusion Pumps Market Value (US$ Mn) Analysis by End Users, 2016-2032
Figure 55: Latin America Implantable Infusion Pumps Market Value Share (%) and BPS Analysis by End Users, 2022-2032
Figure 56: Latin America Implantable Infusion Pumps Market Y-o-Y Growth (%) Projections by End Users, 2022-2032
Figure 57: Latin America Implantable Infusion Pumps Market Attractiveness by Product Type, 2022-2032
Figure 58: Latin America Implantable Infusion Pumps Market Attractiveness by Application, 2022-2032
Figure 59: Latin America Implantable Infusion Pumps Market Attractiveness by End Users, 2022-2032
Figure 60: Latin America Implantable Infusion Pumps Market Attractiveness by Country, 2022-2032
Figure 61: Europe Implantable Infusion Pumps Market Value (US$ Mn) by Product Type, 2022-2032
Figure 62: Europe Implantable Infusion Pumps Market Value (US$ Mn) by Application, 2022-2032
Figure 63: Europe Implantable Infusion Pumps Market Value (US$ Mn) by End Users, 2022-2032
Figure 64: Europe Implantable Infusion Pumps Market Value (US$ Mn) by Country, 2022-2032
Figure 65: Europe Implantable Infusion Pumps Market Value (US$ Mn) Analysis by Country, 2016-2032
Figure 66: Europe Implantable Infusion Pumps Market Value Share (%) and BPS Analysis by Country, 2022-2032
Figure 67: Europe Implantable Infusion Pumps Market Y-o-Y Growth (%) Projections by Country, 2022-2032
Figure 68: Europe Implantable Infusion Pumps Market Value (US$ Mn) Analysis by Product Type, 2016-2032
Figure 69: Europe Implantable Infusion Pumps Market Value Share (%) and BPS Analysis by Product Type, 2022-2032
Figure 70: Europe Implantable Infusion Pumps Market Y-o-Y Growth (%) Projections by Product Type, 2022-2032
Figure 71: Europe Implantable Infusion Pumps Market Value (US$ Mn) Analysis by Application, 2016-2032
Figure 72: Europe Implantable Infusion Pumps Market Value Share (%) and BPS Analysis by Application, 2022-2032
Figure 73: Europe Implantable Infusion Pumps Market Y-o-Y Growth (%) Projections by Application, 2022-2032
Figure 74: Europe Implantable Infusion Pumps Market Value (US$ Mn) Analysis by End Users, 2016-2032
Figure 75: Europe Implantable Infusion Pumps Market Value Share (%) and BPS Analysis by End Users, 2022-2032
Figure 76: Europe Implantable Infusion Pumps Market Y-o-Y Growth (%) Projections by End Users, 2022-2032
Figure 77: Europe Implantable Infusion Pumps Market Attractiveness by Product Type, 2022-2032
Figure 78: Europe Implantable Infusion Pumps Market Attractiveness by Application, 2022-2032
Figure 79: Europe Implantable Infusion Pumps Market Attractiveness by End Users, 2022-2032
Figure 80: Europe Implantable Infusion Pumps Market Attractiveness by Country, 2022-2032
Figure 81: Asia Pacific Implantable Infusion Pumps Market Value (US$ Mn) by Product Type, 2022-2032
Figure 82: Asia Pacific Implantable Infusion Pumps Market Value (US$ Mn) by Application, 2022-2032
Figure 83: Asia Pacific Implantable Infusion Pumps Market Value (US$ Mn) by End Users, 2022-2032
Figure 84: Asia Pacific Implantable Infusion Pumps Market Value (US$ Mn) by Country, 2022-2032
Figure 85: Asia Pacific Implantable Infusion Pumps Market Value (US$ Mn) Analysis by Country, 2016-2032
Figure 86: Asia Pacific Implantable Infusion Pumps Market Value Share (%) and BPS Analysis by Country, 2022-2032
Figure 87: Asia Pacific Implantable Infusion Pumps Market Y-o-Y Growth (%) Projections by Country, 2022-2032
Figure 88: Asia Pacific Implantable Infusion Pumps Market Value (US$ Mn) Analysis by Product Type, 2016-2032
Figure 89: Asia Pacific Implantable Infusion Pumps Market Value Share (%) and BPS Analysis by Product Type, 2022-2032
Figure 90: Asia Pacific Implantable Infusion Pumps Market Y-o-Y Growth (%) Projections by Product Type, 2022-2032
Figure 91: Asia Pacific Implantable Infusion Pumps Market Value (US$ Mn) Analysis by Application, 2016-2032
Figure 92: Asia Pacific Implantable Infusion Pumps Market Value Share (%) and BPS Analysis by Application, 2022-2032
Figure 93: Asia Pacific Implantable Infusion Pumps Market Y-o-Y Growth (%) Projections by Application, 2022-2032
Figure 94: Asia Pacific Implantable Infusion Pumps Market Value (US$ Mn) Analysis by End Users, 2016-2032
Figure 95: Asia Pacific Implantable Infusion Pumps Market Value Share (%) and BPS Analysis by End Users, 2022-2032
Figure 96: Asia Pacific Implantable Infusion Pumps Market Y-o-Y Growth (%) Projections by End Users, 2022-2032
Figure 97: Asia Pacific Implantable Infusion Pumps Market Attractiveness by Product Type, 2022-2032
Figure 98: Asia Pacific Implantable Infusion Pumps Market Attractiveness by Application, 2022-2032
Figure 99: Asia Pacific Implantable Infusion Pumps Market Attractiveness by End Users, 2022-2032
Figure 100: Asia Pacific Implantable Infusion Pumps Market Attractiveness by Country, 2022-2032
Figure 101: MEA Implantable Infusion Pumps Market Value (US$ Mn) by Product Type, 2022-2032
Figure 102: MEA Implantable Infusion Pumps Market Value (US$ Mn) by Application, 2022-2032
Figure 103: MEA Implantable Infusion Pumps Market Value (US$ Mn) by End Users, 2022-2032
Figure 104: MEA Implantable Infusion Pumps Market Value (US$ Mn) by Country, 2022-2032
Figure 105: MEA Implantable Infusion Pumps Market Value (US$ Mn) Analysis by Country, 2016-2032
Figure 106: MEA Implantable Infusion Pumps Market Value Share (%) and BPS Analysis by Country, 2022-2032
Figure 107: MEA Implantable Infusion Pumps Market Y-o-Y Growth (%) Projections by Country, 2022-2032
Figure 108: MEA Implantable Infusion Pumps Market Value (US$ Mn) Analysis by Product Type, 2016-2032
Figure 109: MEA Implantable Infusion Pumps Market Value Share (%) and BPS Analysis by Product Type, 2022-2032
Figure 110: MEA Implantable Infusion Pumps Market Y-o-Y Growth (%) Projections by Product Type, 2022-2032
Figure 111: MEA Implantable Infusion Pumps Market Value (US$ Mn) Analysis by Application, 2016-2032
Figure 112: MEA Implantable Infusion Pumps Market Value Share (%) and BPS Analysis by Application, 2022-2032
Figure 113: MEA Implantable Infusion Pumps Market Y-o-Y Growth (%) Projections by Application, 2022-2032
Figure 114: MEA Implantable Infusion Pumps Market Value (US$ Mn) Analysis by End Users, 2016-2032
Figure 115: MEA Implantable Infusion Pumps Market Value Share (%) and BPS Analysis by End Users, 2022-2032
Figure 116: MEA Implantable Infusion Pumps Market Y-o-Y Growth (%) Projections by End Users, 2022-2032
Figure 117: MEA Implantable Infusion Pumps Market Attractiveness by Product Type, 2022-2032
Figure 118: MEA Implantable Infusion Pumps Market Attractiveness by Application, 2022-2032
Figure 119: MEA Implantable Infusion Pumps Market Attractiveness by End Users, 2022-2032
Figure 120: MEA Implantable Infusion Pumps Market Attractiveness by Country, 2022-2032
Need specific information?
Request CustomizationExplore Healthcare Insights
View Reports