This site uses cookies, including third-party cookies, that help us to provide and improve our services.

Privacy Policy
- Global Locations -
Headquarters
Future Market Insights, Inc.
Christiana Corporate, 200 Continental Drive, Suite 401, Newark, Delaware - 19713, United States
T: +1-845-579-5705
MEA
Market Access DMCC

1602-6 Jumeirah Bay X2 Tower, Plot No: JLT-PH2-X2A,

Jumeirah Lakes Towers, Dubai,

United Arab Emirates

Americas
Future Market Insights
616 Corporate Way, Suite 2-9018,
Valley Cottage, NY 10989,
United States
T: +1-347-918-3531
Europe
Future Market Insights
3rd Floor, 207 Regent Street,
London W1B 3HH
United Kingdom
T: + 44 (0) 20 8123 9659
D: +44 (0) 20 3287 4268
APAC
Future Market Insights
Office No. 401-A, 4th Floor,
VANTAGE 9, S.No. 36/1/1,
Baner, Pune 411045 India

Implantable Drug Eluting Devices Market

Market Insights on Implantable Drug Eluting Devices covering sales outlook, demand forecast & up-to-date key trends

Implantable Drug Eluting Devices Market by Product (Implantable Drug Infusion Pumps, Intraocular Drug Eluting Devices, Contraceptive Drug Eluting Devices, Buprenorphine Implant, Drug Eluting Stents and Others) & Region - Forecast 2022 - 2029

Implantable Drug Eluting Devices Market Snapshot

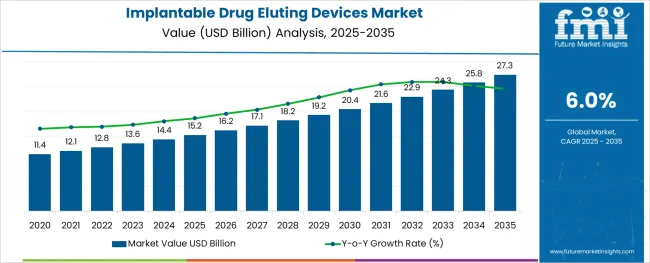
[326 Pages Report]  Global Implantable Drug Eluting Devices Market is set to experience a significant growth of 6.0% CAGR from 2022 to 2029, with an estimated market value of around US$ 12.8 Bn as of 2022. As per Future Market Insights’ projections, contraceptive drug eluting devices products hold a substantial share of over 39.8% in 2021 within the global market.

Data Points

Market Insights

Market Value 2021

US$ 12.1 Bn

Market Value 2022

US$ 12.8 Bn

Market Value 2029

US$ 19.3 Bn

CAGR 2022-2029

6.0%

Market Share of Top 5 Countries

76.5%

With the growth in demand for minimally-invasive procedures, implantable drug eluting devices are accumulating a rising range in terms of market penetration, which are established by key market leaders.

Similarly, start-up companies as well as majorly rooted corporations over the globe are working hard to develop novel implantable drug delivery technologies, using wide range of knowledge available in the network which include research institutions, universities, teaching hospitals, and companies.

Due to a massive demand of combination products such as drug eluting devices, major players in the market are adopting competitive strategies such as acquisitions, mergers, as well as collaborations for the development and augmentation of products in the market.

Customize this Report

Let us know your requirement to get
100% FREE customization

How The Market Progressed Till June 2022?

Particulars

Details

H1, 2021

6.03%

H1, 2022 Projected

6.00%

H1, 2022 Outlook

5.90%

BPS Change - H1, 2022 (O) – H1, 2022 (P)

(-) 10 ↓

BPS Change – H1, 2022 (O) – H1, 2021

(-) 13 ↓

According to Future Market Insights’ analysis, the global implantable drug eluting devices market will observe a diminished change in the Basis Point Share (BPS) by nearly 13 BPS in H1- 2022 (O) as compared with H1-2021. The attribute of non-biodegradable implants, which includes the requirement for surgical removal or the accumulation of polymer in the body after usage, has a negative impact on the total market.

Non-biodegradable implants are generally more traumatic to remove than they are to place. This is based on available clinical studies data. The comparative analysis and market growth rate of global implantable drug eluting devices market as studied by Future Market Insights, will show a negative BPS growth in H1-2022 outlook as compared to H1-2022 projected period by 10 BPS.

Furthermore, the manufacture of implants necessitates the use of huge amounts of organic solvent, which might affect drug stability and toxicity, as well as raise environmental problems.

On the contrary, numerous factors present several benefits to the overall implantable drug eluting devices market, including the adoption of compression as a manufacturing technique for implantable drugs, which refrains from the use of heat or solvents, making it a suitable method for manufacture of implants containing heat or solvent sensitive compounds such a proteins or peptides.

This is set to advance the manufacturing capacities of key producers within the global industry space.

Sales Analysis of Implantable Drug Eluting Devices from 2014 to 2021 Vs Market Outlook for 2022 to 2029

The market value for Implantable Drug Eluting Devices holds nearly 5.8% of the overall US$ 208.0 Bn Drug Delivery Devices market in 2021.

Implantable drug eluting devices provide numerous distinctive advantages which include the exceptional prospects of site-specificity, localization and targeted drug delivery process.

The applications of implantable drug eluting devices are indispensable when considered under the scope of cardiology, ophthalmology, birth control, opioid addiction, pain management, diabetes management, contraception, as well as cancer therapy. The targeted drug delivery systems improve the efficacy of treatment (oncology and cardiology) and assists with the reduction of side effects by preventing damage to the healthy tissue.

The implantable drug eluting devices are segmented into two main types: active drug eluting devices and passive drug eluting devices. The technologies essentially incorporated in the active drug eluting devices are electromechanical and osmotic pressure gradient.

Furthermore, the passive drug eluting devices are sub-segmented into 2 types which include biodegradable implants and non-biodegradable implants, wherein, the biodegradable implants are polyester amide and Polylactic glycolic acids devised and the non-biodegradable implantable devices are made using silicon, polyethylene-vinyl acetate and thermoplastic polyurethane.

The non- biodegradable implants possess wide-ranging applications in diabetes, contraception, hormone regulation, pain management, cancer treatment, etc. Implantable drug delivery devices commonly comprise of a drug reservoir enclosed by a polymer or a mixture of a drug polymer.

Implantable Drug Eluting Devices Market Download Report Brochure

The implant, when incorporated into the desired, localized area of the body, releases the drug at a pre-calculated rate whilst the polymer degrades. The effective drug delivery system through implantable drug eluting devices is thus set to gain traction in terms of adoption over the forecast period, owing to the specificity of target site and the rate of drug dissolution into the localized area of therapy.

The market is expected to expand at a considerable growth rate over the next seven years at a CAGR of close to 6.0%.

What are the Key Opportunities for Implantable Drug Eluting Devices Manufacturers?

The implantable drug eluting devices is predicted to exhibit a lucrative growth over the forecast period. This growth can be associated with the rising adoption of patient-controlled devices and increasing incidence of peripheral and coronary artery diseases.

Additionally, the key market players are displaying extensive focus on clinical trials of bio-reabsorbable stents and implantable drug infusion pumps. Therefore, the growing adoption by patients and physicians, and rising demand for minimally invasive surgeries are set to offer growth opportunities to key market players in the development of novel implantable drug-eluting devices.

Furthermore, the rising incidence of cardiovascular and chronic diseases over the globe is generating growth opportunities for the global implantable drug eluting devices market. According to the WHO, cardiovascular diseases are one of the major causes of mortality globally.

Several research and clinical studies are currently taking place for the improvement of the functioning of existing drug eluting stents and devices. Research in this area is thus focused on the evaluation and development of novel and augmented drug eluting devices, which uphold notable clinical benefits and eliminate safety concerns regarding their long term application. The innovative efforts in research on next-generation drug eluting devices is expected to further progress procedures such as endothelialization and rapid arterial healing.

These factors are thus comprehensively set to promote the growth of the implantable drug eluting devices market throughout the forecast period.

What are the Factors Restraining Demand for Implantable Drug Eluting Devices?

The factors associated with risks associated with the limited demand and value growth of the implantable drug eluting devices include the process of product recalls, which are indispensable for public health and safety as it leads to voluntary action of manufacturers and distributors to carry out their responsibility that present a risk of injury or defective or gross deception of products.

Additionally, pending approvals of products by regulatory bodies may hinder the growth of injunctions which can restrain the sale of products and may remarkably divert the attention of the management and technical personnel in the market. In the event of approval pending, the company's financial condition, business, and results of operations could be adversely affected.

Moreover, several implantable drug eluting devices pose a problem in terms of patient adherence, in terms of discomfort upon the implants being incorporated to them. The on-going biodegradation of the drug-eluting stents sometimes makes it difficult to maintain the accurate dose at the end of its lifetime. There is always a risk of device failure, which may result in another surgical involvement to correct the device.

Another factor of concern includes the fact that most implants possess an inadequate loading capacity owing to their small size. This gives way to some specific potent medicines for appropriate delivery by implantable devices.

The concerns arising from bodily reaction to a foreign substance also conceives a restrictive growth in the deployment of implants in lieu of its biocompatibility and safety. These factors collectively induce a restraint in the growth of the implantable drug eluting devices market, however, augmented and personalized implant designing may prove to enhance the efficacy of the implanted drug delivery process.
Sabyasachi Ghosh
Sabyasachi Ghosh
Principal Consultant
LinkedIn
Talk to Analyst

Find your sweet spots for generating winning opportunities in this market.

Talk to Analyst

Country-wise Insights

What Makes the U.S. the Largest Market for Implantable Drug Eluting Devices?

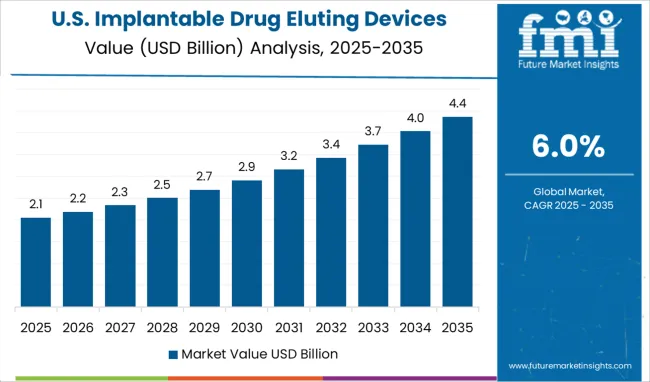
The U.S. dominates the North American region with a total market share of over 94.1% in 2021, and is projected to continue experiencing high growth throughout the forecast period. The vast majority of shares gained by the U.S. in the implantable drug eluting devices market are owed to the factors associated with rising disease burden, increasing geriatric population, and the developing healthcare infrastructure which offers reimbursement opportunities for new procedures.

Why is Germany Considered a Lucrative Market for Implantable Drug Eluting Devices in Europe?

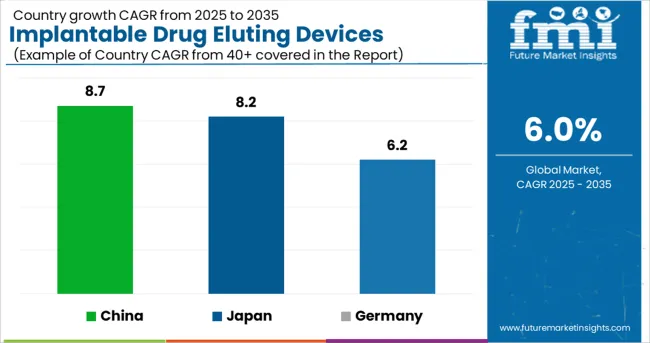
Germany is set to exhibit a CAGR of over 6.2% in the European implantable drug eluting devices market during the forecast period. The lucrative growth in the region is associated with the emergence of key and established players in the country, focusing on research and innovative methodologies for drug delivery and targeted site delivery systems.

What Makes China an Emerging Market for Implantable Drug Eluting Devices?

China holds 46.1% market revenue share in the East Asia market in 2021, and is projected to increase at a CAGR rate of 8.7% during the forecast period. The growth of the implantable drug eluting devices market in the country is attributed to the development of novel drug delivery technologies, such as an implantable nanogenerator, which can be adopted for precise drug delivery system. Furthermore, increasing government funding on research and development activities is set to augment the China implantable drug eluting devices market over the forecast period.
What is the Outlook for Japan Regarding Implantable Drug Eluting Devices?

In 2021, Japan held a 39.3% share in the East Asia implantable drug eluting devices market, and is projected to expand at a CAGR of 8.2% from 2022 to 2029. The growth is associated with the rapid adoption of automated systems in the country, including models for site-specific and targeted drug delivery systems. These augmentations are cost-effective and reduce the error rate during clinical trials.

Category-wise Insights

Which Implantable Drug Eluting Devices Product is Driving Market Growth?

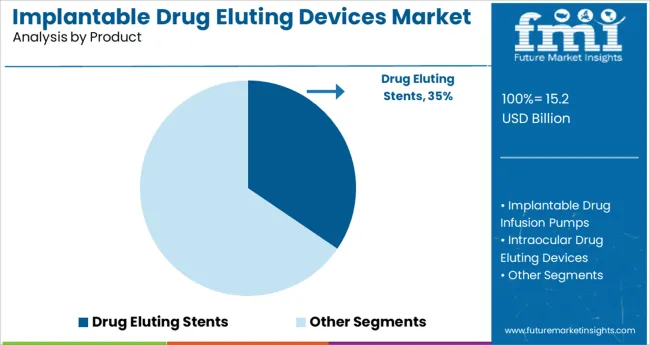
Contraceptive drug eluting devices project a lucrative growth at a CAGR of 6.0% till the end of the forecast period, with a market share of around 39.8% in 2021. The growth is associated with the factor of increasing awareness in terms of female and reproductive health over the globe, and the efforts to minimize the mortality and morbidity rate associated with female reproductive health.

Which Technology is Largely of Focus in the Implantable Drug Eluting Devices Market?

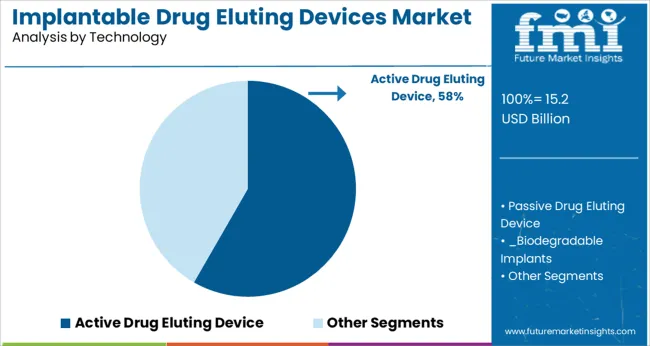
Passive drug eluting device technology holds a revenue share of 96.2% in 2021 and is projected to hold a share over the forecast period with the estimation being 96.6%. The segment holds the maximum revenue share due to the wide ranging applications of passive drug eluting devices in the field of oncology, cardiology, pain management, contraception, etc.

Which Application is Largely of Focus in the Implantable Drug Eluting Devices Market?

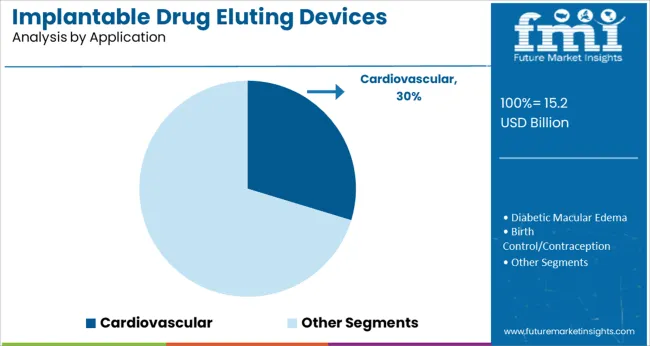
Cardiovascular applications hold a revenue share of 45.1% in 2021 and are projected to hold a share over the forecast period with the estimation being 47.3%. The segment gains traction with the rising incidence of chronic diseases and the risks associated with infectious agents among the geriatric population.

Which Implantation Type Holds a Dominant Stance in the Global Implantable Drug Eluting Devices Market?

Intravascular implantation type hold a revenue share of 44.1% in 2021 and is projected to hold a share over the forecast period with the estimation being 46.1%. The extensive ranging applications of the intravascular implants as well as the efficient patient adherence and outcomes have contributed to this method as being implemented widely across several treatment indications.

Which End User Holds a Dominant Stance in the Global Implantable Drug Eluting Devices Market?

Hospitals hold a revenue share of 61.9% in 2021 and are projected to hold a share over the forecast period with the estimation being 66.0%. The process of targeted drug delivery through implantable drug eluting devices requires the aid of skilled physicians with patient data for close monitoring in the event of implant rejection or other adverse events. Thus, the hospitals segment accounts for a massive share in the implantable drug eluting devices market.
MarketNage
Become a MarketNgage Insider

A unified Market Research Subscription Platform, built for today's disparate research needs.

Competitive Landscape

Corporate tie-ups amongst implantable drug eluting devices manufacturers, acquisitions, expansion, product launches, agreements and increasing clinical trials and research activities are the key strategies adopted by manufacturers to increase the product sales in different geographies.

  • In August 2021, Medtronic plc announced that it has entered into a definitive agreement with Intersect ENT a global medical technology leader dedicated to transforming patient care, in which Medtronic will acquire all outstanding shares of Intersect ENT.
  • In March 2020, Allergan received FDA approval for DURYSTA™ (bimatoprost implant) the first and only Intracameral Biodegradable Sustained-Release implant to lower intraocular pressure in Open-Angle Glaucoma or Ocular Hypertension Patients.

Similarly, recent developments related to companies operating in the implantable drug eluting devices market have been tracked by the team at Future Market Insights, which are available in the full report.

Report Scope as per Implantable Drug Eluting Devices Market Analysis

Attribute

Details

Forecast Period

2022-2029

Historical Data Available for

2014-2021

Market Analysis

US$ Mn for Value

Key Regions Covered

North America, Latin America, Europe, South Asia, East Asia, Oceania and Middle East & Africa

Key Countries Covered

US, Canada,  Brazil, Mexico, Argentina, Germany, U.K., France, Italy, Spain, Russia, China, Japan, South Korea, India, Thailand, Indonesia, Malaysia, Australia, New Zealand, and GCC Countries, Northern Africa, South Africa, Turkey

Key Market Segments Covered

Product, Technology, Application, Implantation Type, End User and Region

Key Companies Profiled

  • Pfizer Inc.
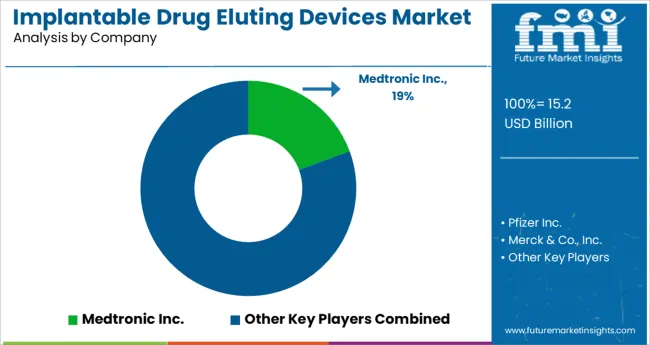
  • Medtronic Inc.
  • Merck & Co., In
  • Bayer AG
  • JOHNSON & JOHNSON
  • SurModics Inc.
  • AstraZeneca Plc.
  • Boston Scientific Corporation
  • Titan Pharmaceuticals, Inc.
  • BIOTRONIK, INC.
  • Abbott Laboratories
  • Allergan, Inc.
  • Bausch and Lomb, Inc.
  • Alimera Sciences
  • REVA Medical, Inc.

Pricing

Available upon Request

Key Market Segments Covered in Implantable Drug Eluting Devices Industry Research

By Product:

  • Implantable Drug Infusion Pumps
  • Intraocular Drug Eluting Devices
  • Contraceptive Drug Eluting Devices
  • Buprenorphine Implant
  • Drug Eluting Stents
  • Others

By Technology:

  • Active Drug Eluting Device
  • Passive Drug Eluting Device
    • Biodegradable Implants
    • Non-Biodegradable Implants

By Application:

  • Diabetic Macular Edema
  • Birth Control/Contraception
  • Opioid Addiction
  • Cardiovascular
  • Ophthalmology
  • Oncology
  • Pain Management

By Implementation Type:

  • Intravaginal
  • Intravascular
  • Intraocular
  • Intrathecal
  • Subcutaneous
  • Intrauterine

By End User:

  • Hospitals
  • Ambulatory Surgical Centers
  • Optical Care Centers
  • Cardiac Surgery Centers
  • Office Based Settings
  • Others

By Region:

  • North America
  • Latin America
  • Europe
  • South Asia
  • East Asia
  • Oceania
  • Middle East and Africa (MEA)

Frequently Asked Questions

The global implantable drug eluting devices market is worth US$ 12.1 Bn at present, and is set to expand 1.5 X over the next seven years.

The implantable drug eluting devices market is expected to reach US$ 19.3 Bn by the end of 2029, with sales revenue expected to register 6.0% CAGR.

Growing research collaborations and distribution of implantable drug eluting devices by key market leaders, new product launches and government initiatives are some of the key trends being witnessed in this marketplace.

The U.S, Germany, U.K, France and China are expected to drive demand in implantable drug eluting devices market.

North America is one of the key markets for implantable drug eluting devices, with the U.S. expected to account over 95.3% of the North American market during the forecast period.

Demand for implantable drug eluting devices in Europe is expected to register growth of 4.9% over the next seven years.

The U.S., U.K. and Germany are key producers of implantable drug eluting devices products.

Pfizer Inc., Medtronic Inc., Merck & Co. In, Bayer AG, JOHNSON & JOHNSON, SurModics Inc., AstraZeneca Plc., Boston Scientific Corporation, Titan Pharmaceuticals, Inc., BIOTRONIK, INC., Abbott Laboratories, Allergan, Inc., Bausch and Lomb, Inc., Alimera Sciences, and REVA Medical, Inc. are the key exporters of implantable drug eluting devices market.

Table of Content

1. Executive Summary

    1.1. Global Market Outlook

    1.2. Demand Side Trends

    1.3. Supply Side Trends

    1.4. Analysis and Recommendations

2. Market Overview

    2.1. Market Coverage / Taxonomy

    2.2. Market Definition / Scope / Limitations

    2.3. Inclusion & Exclusion/ Scope of the Report

3. Key Market Trends

    3.1. Key Trends Impacting the Market

    3.2. Product Development Trends

4. Key Success Factors

    4.1. New Product Launches & Regulatory Approvals

    4.2. Key Strategies Followed By Manufacturers

5. Market Context

    5.1. Product Adoption / Application Analysis

    5.2. Regulatory Scenario

    5.3. Value Chain Analysis 

    5.4. Reimbursement Scenario

6. Global Market Demand Analysis 2014-2021  and Forecast, 2022-2029

    6.1. Historical Market Volume (Units) Analysis, 2014-2021  

    6.2. Current and Future Market Volume (Units) Projections, 2021-2029

        6.2.1. Y-o-Y Growth Trend Analysis

7. Global Market Pricing Analysis

    7.1. Regional Pricing Analysis By Product

    7.2. Pricing Break-up

        7.2.1. Manufacturer Level Pricing

        7.2.2. Distributor Level Pricing

    7.3. Global Average Pricing Analysis Benchmark

8. Global Market Demand (in Value or Size in US$ Mn) Analysis 2014-2021 and Forecast, 2022-2029

    8.1. Historical Market Value (US$ Mn) Analysis, 2014-2021

    8.2. Current and Future Market Value (US$ Mn) Projections, 2022-2029

        8.2.1. Y-o-Y Growth Trend Analysis

        8.2.2. Absolute $ Opportunity Analysis

9. Market Background

    9.1. Macro-Economic Factors

        9.1.1. Global GDP Growth Outlook

        9.1.2. Global Healthcare Outlook 

        9.1.3. Per Capita Healthcare Expenditure Outlook

    9.2. Forecast Factors - Relevance & Impact

    9.3. Market Dynamics

        9.3.1. Drivers

        9.3.2. Restraints

        9.3.3. Opportunity Analysis

10. Global Market Analysis 2014-2021 and Forecast 2022-2029, by Technology 

    10.1. Introduction / Key Findings

    10.2. Historical Market Size (US$ Mn) Analysis By Technology, 2014 - 2021

    10.3. Current and Future Market Size (US$ Mn) Analysis and Forecast By Technology, 2022 – 2029

        10.3.1. Active Drug Eluting Device

        10.3.2. Passive Drug Eluting Device

            10.3.2.1. Biodegradable implants

            10.3.2.2. Non-biodegradable implants

    10.4. Market Attractiveness Analysis By Technology 

11. Global Market Analysis 2014-2021 and Forecast 2022-2029, by Product

    11.1. Introduction / Key Findings

    11.2. Historical Market Size (US$ Mn) Analysis By Product, 2014 - 2021

    11.3. Current and Future Market Size (US$ Mn) Analysis and Forecast By Product, 2022 - 2029

        11.3.1. Implantable Drug Infusion Pumps

        11.3.2. Intraocular Drug Eluting Devices

        11.3.3. Contraceptive Drug Eluting Devices

        11.3.4. Buprenorphine Implant

        11.3.5. Drug-Eluting Stents 

        11.3.6. Others

    11.4. Market Attractiveness Analysis By Product

12. Global Market Analysis 2014-2021 and Forecast 2022-2029, by Application

    12.1. Introduction / Key Findings

    12.2. Historical Market Size (US$ Mn) Analysis By Application, 2014 - 2021

    12.3. Current and Future Market Size (US$ Mn) Analysis and Forecast By Application, 2022 - 2029

        12.3.1. Diabetic Macular Edema

        12.3.2. Birth Control/Contraception

        12.3.3. Opioid Addiction

        12.3.4. Cardiovascular 

        12.3.5. Ophthalmology

        12.3.6. Oncology

        12.3.7. Pain Management

    12.4. Market Attractiveness Analysis By Application

13. Global Market Analysis 2014-2021 and Forecast 2022-2029, by Implantation Type

    13.1. Introduction / Key Findings

    13.2. Historical Market Size (US$ Mn) Analysis By Implantation Type, 2014 - 2021

    13.3. Current and Future Market Size (US$ Mn) Analysis and Forecast By Implantation Type, 2022 - 2029

        13.3.1. Intravaginal 

        13.3.2. Intravascular

        13.3.3. Intraocular

        13.3.4. Intrathecal

        13.3.5. Subcutaneous

        13.3.6. Intrauterine

    13.4. Market Attractiveness Analysis By Implantation Type

14. Global Market Analysis 2014-2021 and Forecast 2022-2029, by End User

    14.1. Introduction / Key Findings

    14.2. Historical Market Size (US$ Mn) Analysis By End User, 2014 - 2021

    14.3. Current and Future Market Size (US$ Mn) Analysis and Forecast By End User, 2022 - 2029

        14.3.1. Hospitals

        14.3.2. Ambulatory Surgical Centres

        14.3.3. Optical Care Centres

        14.3.4. Cardiac Surgery Centres

        14.3.5. Office based settings

        14.3.6. Others

    14.4. Market Attractiveness Analysis By End User

15. Global Market Analysis 2014-2021 and Forecast 2022-2029, by Region

    15.1. Introduction

    15.2. Historical Market Size (US$ Mn) Analysis By Region, 2014 - 2021

    15.3. Current Market Size (US$ Mn) Analysis and Forecast By Region, 2022 - 2029

        15.3.1. North America

        15.3.2. Latin America

        15.3.3. Europe

        15.3.4. Middle East and Africa (MEA)

        15.3.5. East Asia

        15.3.6. South Asia

        15.3.7. Oceania

    15.4. Market Attractiveness Analysis By Region

16. North America Market Analysis 2014-2021 and Forecast 2022-2029

    16.1. Introduction

    16.2. Historical Market Size (US$ Mn) Analysis By Market Taxonomy, 2014 -   2021

    16.3. Market Size (US$ Mn) and Forecast By Market Taxonomy, 2022 - 2029

        16.3.1.  By Country

            16.3.1.1. U.S.

            16.3.1.2. Canada

        16.3.2. By Technology

        16.3.3. By Product

        16.3.4. By Application

        16.3.5. By Implantation Type

        16.3.6. By End User

    16.4. Market Attractiveness Analysis

        16.4.1. By Country

        16.4.2. By Technology

        16.4.3. By Product

        16.4.4. By Application

        16.4.5. By Implantation Type

        16.4.6. By End User

    16.5. Key Market Participants - Intensity Mapping

    16.6. Drivers and Restraints - Impact Analysis

17. Latin America Market Analysis 2014-2021 and Forecast 2022-2029

    17.1. Introduction

    17.2. Historical Market Size (US$ Mn) Analysis By Market Taxonomy, 2014 -  2021

    17.3. Market Size (US$ Mn) and Forecast By Market Taxonomy, 2022 - 2029

        17.3.1.  By Country

            17.3.1.1. Brazil

            17.3.1.2. Mexico

            17.3.1.3. Rest of Latin America

        17.3.2. By Technology

        17.3.3. By Product

        17.3.4. By Application

        17.3.5. By Implantation Type

        17.3.6. By End User

    17.4. Market Attractiveness Analysis

        17.4.1. By Country

        17.4.2. By Technology

        17.4.3. By Product

        17.4.4. By Application

        17.4.5. By Implantation Type

        17.4.6. By End User

    17.5. Key Market Participants - Intensity Mapping

    17.6. Drivers and Restraints - Impact Analysis

18. Europe Market Analysis 2014-2021 and Forecast 2022-2029

    18.1. Introduction

    18.2. Historical Market Size (US$ Mn) Analysis By Market Taxonomy, 2014 - 2021

    18.3. Market Size (US$ Mn) and Forecast By Market Taxonomy, 2022 - 2029

        18.3.1.  By Country

            18.3.1.1. Germany

            18.3.1.2. Italy

            18.3.1.3. France

            18.3.1.4. U.K.

            18.3.1.5. Spain

            18.3.1.6. BENELUX

            18.3.1.7. Russia

            18.3.1.8. Rest of Europe

        18.3.2. By Technology

        18.3.3. By Product

        18.3.4. By Application

        18.3.5. By Implantation Type

        18.3.6. By End User

    18.4. Market Attractiveness Analysis

        18.4.1. By Country

        18.4.2. By Technology

        18.4.3. By Product

        18.4.4. By Application

        18.4.5. By Implantation Type

        18.4.6. By End User

    18.5. Key Market Participants - Intensity Mapping

    18.6. Drivers and Restraints - Impact Analysis

19. South Asia Market Analysis 2014-2021 and Forecast 2022-2029

    19.1. Introduction

    19.2. Historical Market Size (US$ Mn) Analysis By Market Taxonomy, 2014 - 2021

    19.3. Market Size (US$ Mn) and Forecast By Market Taxonomy, 2022 - 2029

        19.3.1.  By Country

            19.3.1.1. India

            19.3.1.2. Thailand

            19.3.1.3. Indonesia

            19.3.1.4. Malaysia

            19.3.1.5. Rest of South Asia

        19.3.2. By Technology

        19.3.3. By Product

        19.3.4. By Application

        19.3.5. By Implantation Type

        19.3.6. By End User

    19.4. Market Attractiveness Analysis

        19.4.1. By Country

        19.4.2. By Technology

        19.4.3. By Product

        19.4.4. By Application

        19.4.5. By Implantation Type

        19.4.6. By End User

    19.5. Key Market Participants - Intensity Mapping

    19.6. Drivers and Restraints - Impact Analysis

20. East Asia Market Analysis 2014-2021 and Forecast 2022-2029

    20.1. Introduction

    20.2. Historical Market Size (US$ Mn) Analysis By Market Taxonomy, 2014 - 2021

    20.3. Market Size (US$ Mn) and Forecast By Market Taxonomy, 2022 - 2029

        20.3.1.  By Country

            20.3.1.1. China

            20.3.1.2. Japan

            20.3.1.3. South Korea

        20.3.2. By Technology

        20.3.3. By Product

        20.3.4. By Application

        20.3.5. By Implantation Type

        20.3.6. By End User

    20.4. Market Attractiveness Analysis

        20.4.1. By Country

        20.4.2. By Technology

        20.4.3. By Product

        20.4.4. By Application

        20.4.5. By Implantation Type

        20.4.6. By End User

    20.5. Key Market Participants - Intensity Mapping

    20.6. Drivers and Restraints - Impact Analysis

21. Oceania Market Analysis 2014-2021 and Forecast 2022-2029

    21.1. Introduction

    21.2. Historical Market Size (US$ Mn) Analysis By Market Taxonomy, 2014 - 2021

    21.3. Market Size (US$ Mn) and Forecast By Market Taxonomy, 2022 - 2029

        21.3.1.  By Country

            21.3.1.1. Australia

            21.3.1.2. New Zealand

        21.3.2. By Technology

        21.3.3. By Product

        21.3.4. By Application

        21.3.5. By Implantation Type

        21.3.6. By End User

    21.4. Market Attractiveness Analysis

        21.4.1. By Country

        21.4.2. By Technology

        21.4.3. By Product

        21.4.4. By Application

        21.4.5. By Implantation Type

        21.4.6. By End User

    21.5. Key Market Participants - Intensity Mapping

    21.6. Drivers and Restraints - Impact Analysis

22. Middle East and Africa Market Analysis 2014-2021 and Forecast 2022-2029

    22.1. Introduction

    22.2. Historical Market Size (US$ Mn) Analysis By Market Taxonomy, 2014 - 2021

    22.3. Market Size (US$ Mn) and Forecast By Market Taxonomy, 2022 - 2029

        22.3.1.  By Country

            22.3.1.1. GCC Countries

            22.3.1.2. Turkey

            22.3.1.3. Northern Africa

            22.3.1.4. South Africa

            22.3.1.5. Rest of Middle East and Africa

        22.3.2. By Technology

        22.3.3. By Product

        22.3.4. By Application

        22.3.5. By Implantation Type

        22.3.6. By End User

    22.4. Market Attractiveness Analysis

        22.4.1. By Country

        22.4.2. By Technology

        22.4.3. By Product

        22.4.4. By Application

        22.4.5. By Implantation Type

        22.4.6. By End User

    22.5. Key Market Participants - Intensity Mapping

    22.6. Drivers and Restraints - Impact Analysis

23. Emerging Countries Market Analysis 2014-2021 and Forecast 2022-2029

    23.1. Introduction

        23.1.1. Market Value Proportion Analysis, By Key Countries

        23.1.2. Global Vs. Country Growth Comparison

    23.2. China Market Analysis

        23.2.1. Introduction

        23.2.2. Market Value Proportion Analysis by Market Taxonomy

        23.2.3. Market Value (US$ Mn) Analysis and Forecast by Market Taxonomy

            23.2.3.1. By Technology

            23.2.3.2. By Product

            23.2.3.3. By Application

            23.2.3.4. By Implantation Type

            23.2.3.5. By End User

        23.2.4. China Market - Competition Landscape

    23.3. India Market Analysis

        23.3.1. Introduction

        23.3.2. Market Value Proportion Analysis by Market Taxonomy

        23.3.3. Market Value (US$ Mn) Analysis and Forecast by Market Taxonomy

            23.3.3.1. By Technology

            23.3.3.2. By Product

            23.3.3.3. By Application

            23.3.3.4. By Implantation Type

            23.3.3.5. By End User

        23.3.4. India Market - Competition Landscape

    23.4. Brazil Market Analysis

        23.4.1. Introduction

        23.4.2. Market Value Proportion Analysis by Market Taxonomy

        23.4.3. Market Value (US$ Mn) Analysis and Forecast by Market Taxonomy

            23.4.3.1. By Technology

            23.4.3.2. By Product

            23.4.3.3. By Application

            23.4.3.4. By Implantation Type

            23.4.3.5. By End User

        23.4.4. Brazil Market - Competition Landscape

24. Market Structure Analysis

    24.1. Market Structure Analysis by Tier of Companies

    24.2. Market Share Analysis

    24.3. Market Concentration

    24.4. Market Presence Analysis

24.4.1.   By Regional footprint of Players

24.4.2.   Product foot print by Players

24.4.3.   Channel Foot Print by Players

25. Competition Analysis

    25.1. Competition Dashboard

    25.2. Competition Deep Dive 

        25.2.1. Pfizer Inc.

            25.2.1.1. Overview

            25.2.1.2. Product Portfolio

            25.2.1.3. Profitability by Market segment

            25.2.1.4. Sales Footprint

            25.2.1.5. Strategy Overview

                25.2.1.5.1. Marketing Strategy

                25.2.1.5.2. Product Strategy

                25.2.1.5.3. Channel Strategy

        25.2.2. Medtronic Inc.

            25.2.2.1. Overview

            25.2.2.2. Product Portfolio

            25.2.2.3. Profitability by Market segment

            25.2.2.4. Sales Footprint

            25.2.2.5. Strategy Overview

                25.2.2.5.1. Marketing Strategy

                25.2.2.5.2. Product Strategy

                25.2.2.5.3. Channel Strategy

        25.2.3. Merck & Co., In

            25.2.3.1. Overview

            25.2.3.2. Product Portfolio

            25.2.3.3. Profitability by Market segment

            25.2.3.4. Sales Footprint

            25.2.3.5. Strategy Overview

                25.2.3.5.1. Marketing Strategy

                25.2.3.5.2. Product Strategy

                25.2.3.5.3. Channel Strategy

        25.2.4. Bayer AG 

            25.2.4.1. Overview

            25.2.4.2. Product Portfolio

            25.2.4.3. Profitability by Market segment

            25.2.4.4. Sales Footprint

            25.2.4.5. Strategy Overview

                25.2.4.5.1. Marketing Strategy

                25.2.4.5.2. Product Strategy

                25.2.4.5.3. Channel Strategy

        25.2.5. Johnson & Johnson 

            25.2.5.1. Overview

            25.2.5.2. Product Portfolio

            25.2.5.3. Profitability by Market segment

            25.2.5.4. Sales Footprint

            25.2.5.5. Strategy Overview

                25.2.5.5.1. Marketing Strategy

                25.2.5.5.2. Product Strategy

                25.2.5.5.3. Channel Strategy

        25.2.6. SurModics Inc. 

            25.2.6.1. Overview

            25.2.6.2. Product Portfolio

            25.2.6.3. Profitability by Market segment

            25.2.6.4. Sales Footprint

            25.2.6.5. Strategy Overview

                25.2.6.5.1. Marketing Strategy

                25.2.6.5.2. Product Strategy

                25.2.6.5.3. Channel Strategy

        25.2.7. AstraZeneca Plc.

            25.2.7.1. Overview

            25.2.7.2. Product Portfolio

            25.2.7.3. Profitability by Market segment

            25.2.7.4. Sales Footprint

            25.2.7.5. Strategy Overview

                25.2.7.5.1. Marketing Strategy

                25.2.7.5.2. Product Strategy

                25.2.7.5.3. Channel Strategy

        25.2.8. Boston Scientific Corporation

            25.2.8.1. Overview

            25.2.8.2. Product Portfolio

            25.2.8.3. Profitability by Market segment

            25.2.8.4. Sales Footprint

            25.2.8.5. Strategy Overview

                25.2.8.5.1. Marketing Strategy

                25.2.8.5.2. Product Strategy

                25.2.8.5.3. Channel Strategy

        25.2.9. Titan Pharmaceuticals, Inc. 

            25.2.9.1. Overview

            25.2.9.2. Product Portfolio

            25.2.9.3. Profitability by Market segment

            25.2.9.4. Sales Footprint

            25.2.9.5. Strategy Overview

                25.2.9.5.1. Marketing Strategy

                25.2.9.5.2. Product Strategy

                25.2.9.5.3. Channel Strategy

        25.2.10. BIOTRONIK, INC.

            25.2.10.1. Overview

            25.2.10.2. Product Portfolio

            25.2.10.3. Profitability by Market segment

            25.2.10.4. Sales Footprint

            25.2.10.5. Strategy Overview

                25.2.10.5.1. Marketing Strategy

                25.2.10.5.2. Product Strategy

                25.2.10.5.3. Channel Strategy

        25.2.11. Abbott Laboratories

            25.2.11.1. Overview

            25.2.11.2. Product Portfolio

            25.2.11.3. Profitability by Market segment

            25.2.11.4. Sales Footprint

            25.2.11.5. Strategy Overview

                25.2.11.5.1. Marketing Strategy

                25.2.11.5.2. Product Strategy

                25.2.11.5.3. Channel Strategy

        25.2.12. Allergan, Inc.

            25.2.12.1. Overview

            25.2.12.2. Product Portfolio

            25.2.12.3. Profitability by Market segment

            25.2.12.4. Sales Footprint

            25.2.12.5. Strategy Overview

                25.2.12.5.1. Marketing Strategy

                25.2.12.5.2. Product Strategy

                25.2.12.5.3. Channel Strategy

        25.2.13. Bausch and Lomb, Inc.

            25.2.13.1. Overview

            25.2.13.2. Product Portfolio

            25.2.13.3. Profitability by Market segment

            25.2.13.4. Sales Footprint

            25.2.13.5. Strategy Overview

                25.2.13.5.1. Marketing Strategy

                25.2.13.5.2. Product Strategy

                25.2.13.5.3. Channel Strategy

        25.2.14. Alimera Sciences 

            25.2.14.1. Overview

            25.2.14.2. Product Portfolio

            25.2.14.3. Profitability by Market segment

            25.2.14.4. Sales Footprint

            25.2.14.5. Strategy Overview

                25.2.14.5.1. Marketing Strategy

                25.2.14.5.2. Product Strategy

                25.2.14.5.3. Channel Strategy

        25.2.15. REVA Medical, Inc.

            25.2.15.1. Overview

            25.2.15.2. Product Portfolio

            25.2.15.3. Profitability by Market segment

            25.2.15.4. Sales Footprint

            25.2.15.5. Strategy Overview

                25.2.15.5.1. Marketing Strategy

                25.2.15.5.2. Product Strategy

                25.2.15.5.3. Channel Strategy

26. Assumptions and Acronyms Used

27. Research Methodology
Customize this Report

Let us know your requirement to get
100% FREE customization

List of Tables

Table 01: Global Market Volume (in Units) Analysis 2014-2021 and Forecast 2022-2029, By Region

Table 02: Global Market Size (US$ Mn) Analysis 2014-2021 and Forecast 2022-2029, By Region

Table 03: Global Market Size (US$ Mn) Analysis 2014-2021 and Forecast 2022-2029, By Technology

Table 04: Global Market Size (US$ Mn) Analysis 2014-2021 and Forecast 2022-2029, By Product

Table 05: Global Market Size Volume (Units) Analysis 2014-2021 and Forecast 2022-2029, By Product

Table 06: Global Market Size (US$ Mn) Analysis 2014-2021 and Forecast 2022-2029, By Application

Table 07: Global Market Size (US$ Mn) Analysis 2014-2021 and Forecast 2022-2029, By Implantation Type

Table 08: Global Market Size (US$ Mn) Analysis 2014-2021 and Forecast 2022-2029, By End User

Table 09: North America Market Size (US$ Mn) Analysis 2014-2021 and Forecast 2022-2029, By Country

Table 10: North America Market Size (US$ Mn) Analysis 2014-2021 and Forecast 2022-2029, By Technology

Table 11: North America Market Size (US$ Mn) Analysis 2014-2021 and Forecast 2022-2029, By Product

Table 12: North America Market Size Volume (Units) Analysis 2014-2021 and Forecast 2022-2029, By Product

Table 13: North America Market Size (US$ Mn) Analysis 2014-2021 and Forecast 2022-2029, By Implantation Type

Table 14: North America Market Size (US$ Mn) Analysis 2014-2021 and Forecast 2022-2029, By Application

Table 15: North America Market Size (US$ Mn) Analysis 2014-2021 and Forecast 2022-2029, By End User

Table 16: Latin America Market Size (US$ Mn) Analysis 2014-2021 and Forecast 2022-2029, By Country

Table 17: Latin America Market Size (US$ Mn) Analysis 2014-2021 and Forecast 2022-2029, By Technology

Table 18: Latin America Market Size (US$ Mn) Analysis 2014-2021 and Forecast 2022-2029, By Product

Table 19: Latin America Market Size Volume (Units) Analysis 2014-2021 and Forecast 2022-2029, By Product

Table 20: Latin America Market Size (US$ Mn) Analysis 2014-2021 and Forecast 2022-2029, By Implantation Type

Table 21: Latin America Market Size (US$ Mn) Analysis 2014-2021 and Forecast 2022-2029, By Application

Table 22: Latin America Market Size (US$ Mn) Analysis 2014-2021 and Forecast 2022-2029, By End User

Table 23: Europe Market Size (US$ Mn) Analysis 2014-2021 and Forecast 2022-2029, By Country

Table 24: Europe Market Size (US$ Mn) Analysis 2014-2021 and Forecast 2022-2029, By Technology

Table 25: Europe Market Size (US$ Mn) Analysis 2014-2021 and Forecast 2022-2029, By Product

Table 26: Europe Market Size Volume (Units) Analysis 2014-2021 and Forecast 2022-2029, By Product

Table 27: Europe Market Size (US$ Mn) Analysis 2014-2021 and Forecast 2022-2029, By Implantation Type

Table 28: Europe Market Size (US$ Mn) Analysis 2014-2021 and Forecast 2022-2029, By Application

Table 29: Europe Market Size (US$ Mn) Analysis 2014-2021 and Forecast 2022-2029, By End User

Table 30: East Asia Market Size (US$ Mn) Analysis 2014-2021 and Forecast 2022-2029, By Country

Table 31: East Asia Market Size (US$ Mn) Analysis 2014-2021 and Forecast 2022-2029, By Technology

Table 32: East Asia Market Size (US$ Mn) Analysis 2014-2021 and Forecast 2022-2029, By Product

Table 33: East Asia Market Size Volume (Units) Analysis 2014-2021 and Forecast 2022-2029, By Product

Table 34: East Asia Market Size (US$ Mn) Analysis 2014-2021 and Forecast 2022-2029, By Implantation Type

Table 35: East Asia Market Size (US$ Mn) Analysis 2014-2021 and Forecast 2022-2029, By Application

Table 36: East Asia Market Size (US$ Mn) Analysis 2014-2021 and Forecast 2022-2029, By End User

Table 37: South Asia Market Size (US$ Mn) Analysis 2014-2021 and Forecast 2022-2029, By Country

Table 38: South Asia Market Size (US$ Mn) Analysis 2014-2021 and Forecast 2022-2029, By Technology

Table 39: South Asia Market Size (US$ Mn) Analysis 2014-2021 and Forecast 2022-2029, By Product

Table 40: South Asia Market Size Volume (Units) Analysis 2014-2021 and Forecast 2022-2029, By Product

Table 41: South Asia Market Size (US$ Mn) Analysis 2014-2021 and Forecast 2022-2029, By Implantation Type

Table 42: South Asia Market Size (US$ Mn) Analysis 2014-2021 and Forecast 2022-2029, By Application

Table 43: South Asia Market Size (US$ Mn) Analysis 2014-2021 and Forecast 2022-2029, By End User

Table 44: Oceania Market Size (US$ Mn) Analysis 2014-2021 and Forecast 2022-2029, By Country

Table 45: Oceania Market Size (US$ Mn) Analysis 2014-2021 and Forecast 2022-2029, By Technology

Table 46: Oceania Market Size (US$ Mn) Analysis 2014-2021 and Forecast 2022-2029, By Product

Table 47: Oceania Market Size Volume (Units) Analysis 2014-2021 and Forecast 2022-2029, By Product

Table 48: Oceania Market Size (US$ Mn) Analysis 2014-2021 and Forecast 2022-2029, By Implantation Type

Table 49: Oceania Market Size (US$ Mn) Analysis 2014-2021 and Forecast 2022-2029, By Application

Table 50: Oceania Market Size (US$ Mn) Analysis 2014-2021 and Forecast 2022-2029, By End User

Table 51: Middle East and Africa Market Size (US$ Mn) Analysis 2014-2021 and Forecast 2022-2029, By Country

Table 52: Middle East and Africa Market Size (US$ Mn) Analysis 2014-2021 and Forecast 2022-2029, By Technology

Table 53: Middle East and Africa Market Size (US$ Mn) Analysis 2014-2021 and Forecast 2022-2029, By Product

Table 54: Middle East and Africa Market Size Volume (Units) Analysis 2014-2021 and Forecast 2022-2029, By Product

Table 55: Middle East and Africa Market Size (US$ Mn) Analysis 2014-2021 and Forecast 2022-2029, By Implantation Type

Table 56: Middle East and Africa Market Size (US$ Mn) Analysis 2014-2021 and Forecast 2022-2029, By Application

Table 57: Middle East and Africa Market Size (US$ Mn) Analysis 2014-2021 and Forecast 2022-2029, By End User

Table 58: China Market Size (US$ Mn) Analysis 2014-2021 and Forecast 2022-2029, By Technology

Table 59: China Market Size (US$ Mn) Analysis 2014-2021 and Forecast 2022-2029, By Product

Table 60: China Market Size Volume (Units) Analysis 2014-2021 and Forecast 2022-2029, By Product

Table 61: China Market Size (US$ Mn) Analysis 2014-2021 and Forecast 2022-2029, By Implantation Type

Table 62: China Market Size (US$ Mn) Analysis 2014-2021 and Forecast 2022-2029, By Application

Table 63: China Market Size (US$ Mn) Analysis 2014-2021 and Forecast 2022-2029, By End User

Table 64: India Market Size (US$ Mn) Analysis 2014-2021 and Forecast 2022-2029, By Technology

Table 65: India Market Size (US$ Mn) Analysis 2014-2021 and Forecast 2022-2029, By Technology

Table 66: India Market Size (US$ Mn) Analysis 2014-2021 and Forecast 2022-2029, By Product

Table 67: India Market Size Volume (Units) Analysis 2014-2021 and Forecast 2022-2029, By Product

Table 68: India Market Size (US$ Mn) Analysis 2014-2021 and Forecast 2022-2029, By Implantation Type

Table 69: India Market Size (US$ Mn) Analysis 2014-2021 and Forecast 2022-2029, By Application

Table 70: India Market Size (US$ Mn) Analysis 2014-2021 and Forecast 2022-2029, By End User

Table 71: Brazil Market Size (US$ Mn) Analysis 2014-2021 and Forecast 2022-2029, By Technology

Table 72: Brazil Market Size (US$ Mn) Analysis 2014-2021 and Forecast 2022-2029, By Product

Table 73: India Market Size Volume (Units) Analysis 2014-2021 and Forecast 2022-2029, By Product

Table 74: Brazil Market Size (US$ Mn) Analysis 2014-2021 and Forecast 2022-2029, By Implantation Type

Table 75: Brazil Market Size (US$ Mn) Analysis 2014-2021 and Forecast 2022-2029, By Application

Table 76: Brazil Market Size (US$ Mn) Analysis 2014-2021 and Forecast 2022-2029, By End User
Sabyasachi Ghosh
Principal Consultant
LinkedIn
Talk to Analyst

Find your sweet spots for generating winning opportunities in this market.

Talk to Analyst

List of Charts

Figure 01: Global Market Value Share, by Product (2022E)

Figure 02: Global Market Value Share, by Technology (2022E)

Figure 03: Global Market Value Share, by Implantation Type (2022E)

Figure 04: Global Market Value Share, by Application (2022E)

Figure 05: Global Market Value Share, by End User (2022E)

Figure 06: Global Market Value Share, by Region (2022E)

Figure 07: Global Market Size (US$ Mn) Analysis, 2014–2021

Figure 08: Global Market Size (US$ Mn) & Y-o-Y Growth (%) Analysis, 2022–2029

Figure 09: Global Market Absolute $ Opportunity Analysis, 2022–2029

Figure 10: Global Market Volume (in Units) Analysis, 2014–2021

Figure 11: Global Market Volume (in Units) & Y-o-Y Growth (%) Analysis, 2022–2029

Figure 12: Global Market Analysis by Region –2022 & 2029

Figure 13: Global Market Y-o-Y Growth Projections by Region, 2022 – 2029

Figure 14: Global Market Size (US$ Mn) Analysis 2014-2021 and Forecast 2022-2029, By Region

Figure 15: Global Market Analysis by Technology –2022 & 2029

Figure 16: Global Market Y-o-Y Growth Projections by Technology, 2022 – 2029

Figure 17: Global Market Size (US$ Mn) Analysis 2014-2021 and Forecast 2022-2029, By Technology

Figure 18: Global Market Analysis by Product –2022 & 2029

Figure 19: Global Market Y-o-Y Growth Projections by Product, 2022 – 2029

Figure 20: Global Market Size (US$ Mn) Analysis 2014-2021 and Forecast 2022-2029, By Product

Figure 21: Global Market Analysis by Application –2022 & 2029

Figure 22: Global Market Y-o-Y Growth Projections by Application, 2022 – 2029

Figure 23: Global Market Size (US$ Mn) Analysis 2014-2021 and Forecast 2022-2029, By Application

Figure 24: Global Market Analysis by Implantation Type –2022 & 2029

Figure 25: Global Market Y-o-Y Growth Projections by Implantation Type, 2022 – 2029

Figure 26: Global Market Size (US$ Mn) Analysis 2014-2021 and Forecast 2022-2029, By Implantation Type

Figure 27: Global Market Analysis by End User –2022 & 2029

Figure 28: Global Market Y-o-Y Growth Projections by End User, 2022 – 2029

Figure 29: Global Market Size (US$ Mn) Analysis 2014-2021 and Forecast 2022-2029, By End User

Figure 30:North America Market Size (US$ Mn) Analysis, 2014-2021

Figure 31: North America Market Size (US$ Mn) & Y-o-Y Growth (%), 2022–2029

Figure 32: North America Market Size (US$ Mn) Analysis 2014-2021 and Forecast 2022-2029, By Country

Figure 33: North America Market Size (US$ Mn) Analysis 2014-2021 and Forecast 2022-2029, By Technology

Figure 34: North America Market Size (US$ Mn) Analysis 2014-2021 and Forecast 2022-2029, By Product

Figure 35: North America Market Size (US$ Mn) Analysis 2014-2021 and Forecast 2022-2029, By Implantation Type

Figure 36: North America Market Size (US$ Mn) Analysis 2014-2021 and Forecast 2022-2029, By Application

Figure 37: North America Market Size (US$ Mn) Analysis 2014-2021 and Forecast 2022-2029, By End User

Figure 38:Latin America Market Size (US$ Mn) Analysis, 2014-2021

Figure 39: Latin America Market Size (US$ Mn) & Y-o-Y Growth (%), 2022–2029

Figure 40: Latin America Market Size (US$ Mn) Analysis 2014-2021 and Forecast 2022-2029, By Country

Figure 41: Latin America Market Size (US$ Mn) Analysis 2014-2021 and Forecast 2022-2029, By Technology

Figure 42: Latin America Market Size (US$ Mn) Analysis 2014-2021 and Forecast 2022-2029, By Product

Figure 43: Latin America Market Size (US$ Mn) Analysis 2014-2021 and Forecast 2022-2029, By Implantation Type

Figure 44: Latin America Market Size (US$ Mn) Analysis 2014-2021 and Forecast 2022-2029, By Application

Figure 45: Latin America Market Size (US$ Mn) Analysis 2014-2021 and Forecast 2022-2029, By End User

Figure 46:Europe Market Size (US$ Mn) Analysis, 2014-2021

Figure 47: Europe Market Size (US$ Mn) & Y-o-Y Growth (%), 2022–2029

Figure 48: Europe Market Size (US$ Mn) Analysis 2014-2021 and Forecast 2022-2029, By Country

Figure 49: Europe Market Size (US$ Mn) Analysis 2014-2021 and Forecast 2022-2029, By Technology

Figure 50: Europe Market Size (US$ Mn) Analysis 2014-2021 and Forecast 2022-2029, By Product

Figure 51: Europe Market Size (US$ Mn) Analysis 2014-2021 and Forecast 2022-2029, By Implantation Type

Figure 52: Europe Market Size (US$ Mn) Analysis 2014-2021 and Forecast 2022-2029, By Application

Figure 53: Europe Market Size (US$ Mn) Analysis 2014-2021 and Forecast 2022-2029, By End User

Figure 54:East Asia Market Size (US$ Mn) Analysis, 2014-2021

Figure 55: East Asia Market Size (US$ Mn) & Y-o-Y Growth (%), 2022–2029

Figure 56: East Asia Market Size (US$ Mn) Analysis 2014-2021 and Forecast 2022-2029, By Country

Figure 57: East Asia Market Size (US$ Mn) Analysis 2014-2021 and Forecast 2022-2029, By Technology

Figure 58: East Asia Market Size (US$ Mn) Analysis 2014-2021 and Forecast 2022-2029, By Product

Figure 59: East Asia Market Size (US$ Mn) Analysis 2014-2021 and Forecast 2022-2029, By Implantation Type

Figure 60: East Asia Market Size (US$ Mn) Analysis 2014-2021 and Forecast 2022-2029, By Application

Figure 61: East Asia Market Size (US$ Mn) Analysis 2014-2021 and Forecast 2022-2029, By End User

Figure 62:South Asia Market Size (US$ Mn) Analysis, 2014-2021

Figure 63: South Asia Market Size (US$ Mn) & Y-o-Y Growth (%), 2022–2029

Figure 64: South Asia Market Size (US$ Mn) Analysis 2014-2021 and Forecast 2022-2029, By Country

Figure 65: South Asia Market Size (US$ Mn) Analysis 2014-2021 and Forecast 2022-2029, By Technology

Figure 66: South Asia Market Size (US$ Mn) Analysis 2014-2021 and Forecast 2022-2029, By Product

Figure 67: South Asia Market Size (US$ Mn) Analysis 2014-2021 and Forecast 2022-2029, By Implantation Type

Figure 68: South Asia Market Size (US$ Mn) Analysis 2014-2021 and Forecast 2022-2029, By Application

Figure 69: South Asia Market Size (US$ Mn) Analysis 2014-2021 and Forecast 2022-2029, By End User

Figure 70:Oceania Market Size (US$ Mn) Analysis, 2014-2021

Figure 71: Oceania Market Size (US$ Mn) & Y-o-Y Growth (%), 2022–2029

Figure 72: Oceania Market Size (US$ Mn) Analysis 2014-2021 and Forecast 2022-2029, By Country

Figure 73: Oceania Market Size (US$ Mn) Analysis 2014-2021 and Forecast 2022-2029, By Technology

Figure 74: Oceania Market Size (US$ Mn) Analysis 2014-2021 and Forecast 2022-2029, By Product

Figure 75: Oceania Market Size (US$ Mn) Analysis 2014-2021 and Forecast 2022-2029, By Implantation Type

Figure 76: Oceania Market Size (US$ Mn) Analysis 2014-2021 and Forecast 2022-2029, By Application

Figure 77: Oceania Market Size (US$ Mn) Analysis 2014-2021 and Forecast 2022-2029, By End User

Figure 78:Middle East and Africa Market Size (US$ Mn) Analysis, 2014-2021

Figure 79: Middle East and Africa Market Size (US$ Mn) & Y-o-Y Growth (%), 2022–2029

Figure 80: Middle East and Africa Market Size (US$ Mn) Analysis 2014-2021 and Forecast 2022-2029, By Country

Figure 81: Middle East and Africa Market Size (US$ Mn) Analysis 2014-2021 and Forecast 2022-2029, By Technology

Figure 82: Middle East and Africa Market Size (US$ Mn) Analysis 2014-2021 and Forecast 2022-2029, By Product

Figure 83: Middle East and Africa Market Size (US$ Mn) Analysis 2014-2021 and Forecast 2022-2029, By Implantation Type

Figure 84: Middle East and Africa Market Size (US$ Mn) Analysis 2014-2021 and Forecast 2022-2029, By Application

Figure 85: Middle East and Africa Market Size (US$ Mn) Analysis 2014-2021 and Forecast 2022-2029, By End User

Figure 86:China Market Size (US$ Mn) Analysis, 2014-2021

Figure 87: China Market Size (US$ Mn) & Y-o-Y Growth (%), 2022–2029

Figure 88: China Market Size (US$ Mn) Analysis 2014-2021 and Forecast 2022-2029, By Product

Figure 89: China Market Size (US$ Mn) Analysis 2014-2021 and Forecast 2022-2029, By Implantation Type

Figure 90: China Market Size (US$ Mn) Analysis 2014-2021 and Forecast 2022-2029, By Application

Figure 91: China Market Size (US$ Mn) Analysis 2014-2021 and Forecast 2022-2029, By End User

Figure 92: China Market Size (US$ Mn) Analysis 2014-2021 and Forecast 2022-2029, By Technology

Figure 93:India Market Size (US$ Mn) Analysis, 2014-2021

Figure 94: India Market Size (US$ Mn) & Y-o-Y Growth (%), 2022–2029

Figure 95: India Market Size (US$ Mn) Analysis 2014-2021 and Forecast 2022-2029, By Product

Figure 96: India Market Size (US$ Mn) Analysis 2014-2021 and Forecast 2022-2029, By Implantation Type

Figure 97: India Market Size (US$ Mn) Analysis 2014-2021 and Forecast 2022-2029, By Application

Figure 98: India Market Size (US$ Mn) Analysis 2014-2021 and Forecast 2022-2029, By End User

Figure 99: India Market Size (US$ Mn) Analysis 2014-2021 and Forecast 2022-2029, By Technology

Figure 100:Brazil Market Size (US$ Mn) Analysis, 2014-2021

Figure 101: Brazil Market Size (US$ Mn) & Y-o-Y Growth (%), 2022–2029

Figure 102: Brazil Market Size (US$ Mn) Analysis 2014-2021 and Forecast 2022-2029, By Product

Figure 103: Brazil Market Size (US$ Mn) Analysis 2014-2021 and Forecast 2022-2029, By Implantation Type

Figure 104: Brazil Market Size (US$ Mn) Analysis 2014-2021 and Forecast 2022-2029, By Application

Figure 105: Brazil Market Size (US$ Mn) Analysis 2014-2021 and Forecast 2022-2029, By End User

Figure 106: Brazil Market Size (US$ Mn) Analysis 2014-2021 and Forecast 2022-2029, By Technology

Need specific information?

Request Customization

Explore Healthcare Insights

View Reports

Recommendations

Healthcare

Implantable Drug Eluting Devices Market

Published : February 2022

Healthcare

Connected Drug Delivery Devices Market

Published : December 2021

Healthcare

Microneedle Drug Delivery Systems Market

Published : November 2020

Healthcare

Injectable Drug Delivery Market

Published : December 2021

Google translate

Implantable Drug Eluting Devices Market