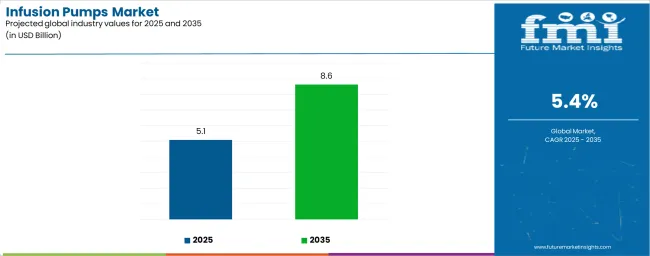
The global infusion pumps market is projected to reach USD 8.6 billion by 2035, recording an absolute increase of USD 3.5 billion over the forecast period. The market is valued at USD 5.1 billion in 2025 and is set to rise at a CAGR of 5.4% during the assessment period. The overall market size is expected to grow by 1.7 times during the same period, supported by increasing demand for precise drug delivery systems worldwide, driving demand for advanced medical devices and increasing investments in healthcare infrastructure and chronic disease management globally. Regulatory compliance challenges and high device costs may pose challenges to market expansion.
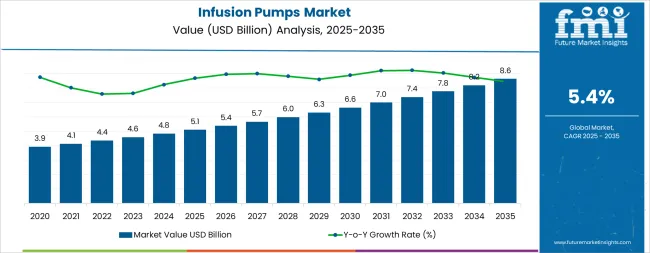
Between 2025 and 2030, the infusion pumps market is projected to expand from USD 5.1 billion to USD 6.7 billion, resulting in a value increase of USD 1.6 billion, which represents 45.7% of the total forecast growth for the decade. This phase of development will be shaped by rising demand for diabetes management and oncology treatment applications, product innovation in smart pump technology and wireless connectivity systems, as well as expanding integration with electronic health records and digital monitoring initiatives. Companies are establishing competitive positions through investment in advanced infusion technologies, precision dosing solutions, and strategic market expansion across hospital, home care, and ambulatory applications.
From 2030 to 2035, the market is forecast to grow from USD 6.7 billion to USD 8.6 billion, adding another USD 1.9 billion, which constitutes 54.3% of the overall ten-year expansion. This period is expected to be characterized by the expansion of specialized infusion systems, including advanced smart pump formulations and integrated monitoring solutions tailored for specific medical applications, strategic collaborations between device manufacturers and healthcare providers, and an enhanced focus on patient safety and treatment precision optimization. The growing emphasis on home healthcare expansion and automated drug delivery will drive demand for advanced, high-performance infusion pump solutions across diverse medical and healthcare applications.
| Metric | Value |
|---|---|
| Market Value (2025) | USD 5.1 billion |
| Market Forecast Value (2035) | USD 8.6 billion |
| Forecast CAGR (2025-2035) | 5.4% |
The infusion pumps market grows by enabling healthcare providers to achieve superior precision and safety in drug delivery across multiple medical settings, ranging from small-scale clinics to large-scale hospital complexes. Healthcare professionals face mounting pressure to improve patient safety and treatment accuracy, with infusion pump solutions typically providing 95-99% dosing accuracy compared to manual administration systems, making advanced infusion technology essential for competitive medical care delivery.
The healthcare industry's need for maximum treatment precision creates demand for advanced pump solutions that can minimize errors, enhance efficiency, and ensure consistent performance across diverse medical environments. Government initiatives promoting patient safety standards and healthcare digitization drive adoption in hospitals, home care, and ambulatory applications, where treatment performance has a direct impact on patient outcomes and operational efficiency. High initial investment costs and the complexity of achieving seamless integration across different healthcare systems may limit adoption rates among cost-sensitive facilities and regions with limited technical infrastructure.
The market is segmented by product type, modality, application, end user, and region. By product type, the market is divided into syringe pumps, small volume pumps, ambulatory pumps, volumetric pumps, peristaltic pumps, cassette/piston pumps, implantable pumps, insulin pumps, enteral pumps, PCA pumps, and pump accessories. Based on modality, the market is categorized into stationary pumps and infusion pumps. By application, the market is classified into chemotherapy/oncology, pediatrics/neonatology, analgesia, gastroenterology, hematology, and diabetes. By end user, the market is divided into hospitals, ambulatory surgical centers, home care, clinics, and others. Regionally, the market is divided into North America, Latin America, Western Europe, Eastern Europe, East Asia, South Asia Pacific, and Middle East & Africa.
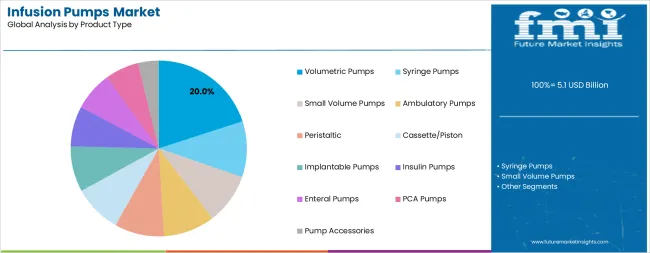
The insulin pumps segment represents the dominant force in the infusion pumps market, capturing approximately 20% of total market share in 2025. This advanced product category encompasses formulations featuring continuous glucose monitoring integration, including automated insulin delivery capabilities and personalized dosing algorithms that enable superior diabetes management and enhanced patient quality of life. The insulin pumps segment's market leadership stems from its exceptional performance capabilities in chronic disease management applications, with devices capable of maintaining optimal glycemic control while providing consistent insulin delivery and real-time monitoring across diverse patient conditions.
The syringe pumps segment maintains substantial market presence, serving healthcare facilities that require precise small-volume medication delivery for critical care applications. These devices offer reliable performance for specialized medical procedures while providing sufficient accuracy to meet advanced clinical requirements in hospital and ambulatory settings.
Key technological advantages driving the insulin pumps segment include:
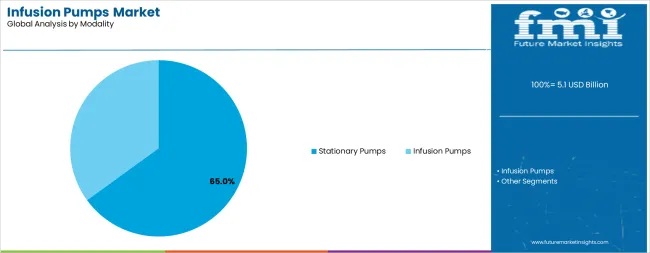
Stationary pumps dominate the infusion pumps market with approximately 65% market share in 2025, reflecting the critical role of hospital-based treatment systems and clinical care facilities in driving medical device demand and supporting advanced patient care initiatives. The stationary pumps segment's market leadership is reinforced by increasing hospital automation requirements, standardized clinical protocols, and rising demand for high-volume infusion capabilities that directly correlates with treatment efficiency and patient safety standards.
The infusion pumps segment represents growing market momentum, capturing significant share through specialized requirements for portable treatment applications, home care solutions, and ambulatory medical services. This segment benefits from growing demand for mobile healthcare technologies that meet convenience, portability, and continuous care requirements in diverse medical applications.
Key market dynamics supporting modality growth include:
Diabetes applications demonstrate strong performance in the infusion pumps market, driven by increasing global prevalence and continuous insulin delivery requirements. The diabetes segment's established position reflects the critical importance of glycemic control, automated dosing capabilities, and patient lifestyle integration across healthcare delivery systems, meeting treatment requirements in clinical and home care facilities.
Chemotherapy/oncology applications show significant momentum through specialized infusion requirements for cancer treatment protocols and precision drug delivery systems. This segment benefits from continuous advancement in oncology care that provides enhanced treatment efficacy and reduced side effects for complex therapeutic applications.
The analgesia segment maintains steady presence through pain management applications, while pediatrics/neonatology applications provide specialized care for vulnerable patient populations. Hematology and gastroenterology segments represent emerging treatment opportunities through advanced infusion protocols.
Key factors supporting application advancement include:
Hospitals represent the largest end-user segment in the infusion pumps market, accounting for substantial market share through comprehensive medical care requirements and advanced treatment infrastructure. The hospitals segment's market leadership reflects the critical role of inpatient care, emergency medical services, and specialized treatment units in driving infusion pump demand across diverse medical applications and patient populations.
Home care emerges as the fastest-growing end-user category, capturing significant market momentum through increasing patient preference for home-based treatment, chronic disease management requirements, and healthcare cost optimization initiatives. This segment benefits from technological advancement in portable devices and telemedicine integration that meets patient comfort and treatment accessibility requirements.
Ambulatory surgical centers account for substantial market share through outpatient procedure requirements, while clinics serve routine medical care and chronic disease management applications. The others segment captures specialized applications including long-term care facilities and rehabilitation centers.
Key dynamics supporting end-user growth include:
The market is driven by three concrete demand factors tied to patient safety and treatment precision outcomes. First, global chronic disease prevalence and aging population demographics create increasing demand for high-performance infusion pump solutions, with diabetes cases projected to exceed 700 million by 2045, requiring advanced technology solutions for optimal patient care. Second, modernization of healthcare infrastructure and patient safety initiatives drive the adoption of intelligent infusion technologies, with medical facilities seeking 95-99% improvement in dosing accuracy and medication error reduction. Third, technological advancements in smart pump integration and wireless connectivity enable more effective and responsive medical devices that reduce operational complexity while improving long-term patient outcomes and treatment efficiency.
Market restraints include high capital investment requirements that can impact healthcare facility budgets and equipment procurement decisions, particularly during periods of healthcare spending constraints or reimbursement pressures affecting medical device adoption. Regulatory compliance complexity poses another significant challenge, as achieving approval across different medical standards and safety requirements demands specialized expertise and comprehensive validation systems, potentially causing product launch delays and increased development costs. Technical training requirements in device operation and maintenance create additional challenges for healthcare facilities, demanding ongoing investment in staff education and compliance with varying regional medical device regulations.
Key trends indicate accelerated adoption in emerging markets, particularly China, India, and Brazil, where expanding healthcare access and chronic disease management drive comprehensive infusion pump system deployment. Technology advancement trends toward AI integration with enhanced predictive analytics, remote monitoring capabilities, and integrated electronic health record systems enable next-generation product development that addresses multiple clinical requirements simultaneously. The market could face disruption if alternative drug delivery technologies or significant changes in healthcare delivery models minimize reliance on traditional infusion pump solutions.
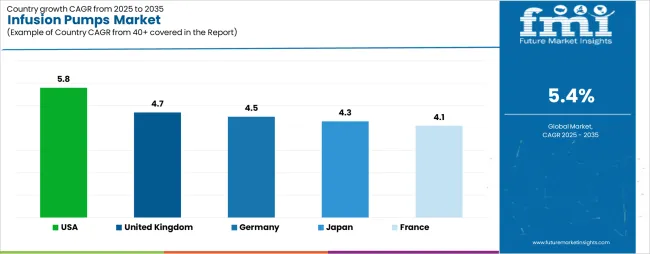
| Country | CAGR (2025-2035) |
|---|---|
| United States | 5.8% |
| United Kingdom | 4.7% |
| Germany | 4.5% |
| Japan | 4.3% |
| France | 4.1% |
The infusion pumps market is gaining momentum worldwide, with the USA taking the lead thanks to advanced healthcare infrastructure and comprehensive chronic disease management programs. Close behind, the UK benefits from government-backed healthcare modernization and patient safety initiatives, positioning itself as a strategic growth hub in the European region. Germany shows steady advancement, where integration of digital health technologies strengthens its role in the European medical device development. Japan is focusing on aging population care and medical innovation, signaling an ambition to capitalize on growing opportunities in advanced healthcare technology markets. Meanwhile, France stands out for its comprehensive healthcare system and medical device adoption, recording consistent progress in clinical care optimization. Together, the USA and UK anchor the global expansion story, while the rest build stability and diversity into the market's growth path.
The report covers an in-depth analysis of 40+ countries, the top-performing countries are highlighted below.
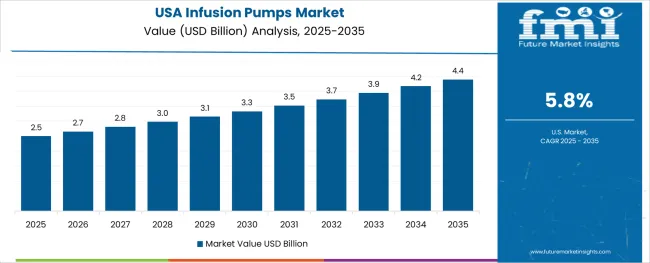
The USA demonstrates the strongest growth potential in the Infusion Pumps Market with a CAGR of 5.8% through 2035. The country's leadership position stems from comprehensive healthcare infrastructure projects, government-backed patient safety programs, and aggressive medical technology adoption targets, driving the adoption of high-performance infusion pump systems. Growth is concentrated in major healthcare regions, including California, Texas, New York, and Florida, where hospitals and healthcare systems are implementing advanced infusion solutions for enhanced treatment performance and patient safety advantages. Distribution channels through established medical device distributors and direct manufacturer relationships expand deployment across hospitals, outpatient facilities, and home care services. The country's healthcare innovation strategy provides policy support for advanced medical device development, including high-performance infusion platform adoption.
Key market factors:
In London, Manchester, Birmingham, and Leeds, the adoption of infusion pump systems is accelerating across healthcare facilities and home care services, driven by patient safety targets and comprehensive healthcare modernization initiatives. The market demonstrates strong growth momentum with a CAGR of 4.7% through 2035, linked to comprehensive National Health Service programs and increasing focus on clinical excellence solutions. British healthcare providers are implementing advanced infusion systems and monitoring platforms to enhance patient care while meeting stringent safety requirements in domestic healthcare delivery. The country's healthcare quality programs create demand for high-performance medical solutions, while increasing emphasis on home care services drives adoption of portable technologies and remote monitoring systems.
Germany's advanced healthcare system demonstrates sophisticated implementation of infusion pump systems, with documented case studies showing efficiency improvements in clinical applications through optimized drug delivery solutions. The country's medical infrastructure in major healthcare centers, including Bavaria, North Rhine-Westphalia, Baden-Württemberg, and Lower Saxony, showcases integration of advanced infusion technologies with existing healthcare systems, leveraging expertise in precision engineering and medical device development. German healthcare providers emphasize quality standards and clinical reliability, creating demand for high-performance infusion solutions that support advanced medical protocols and regulatory requirements. The market maintains steady growth through focus on medical innovation and clinical excellence, with a CAGR of 4.5% through 2035.
Key development areas:
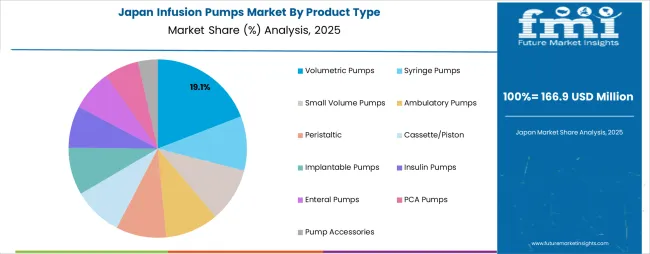
Japan's market expansion is driven by diverse healthcare applications, including infusion automation in Tokyo and Osaka regions, elderly care development in Nagoya and Fukuoka, and comprehensive medical modernization across multiple healthcare areas. The country demonstrates promising growth potential with a CAGR of 4.3% through 2035, supported by aging population programs and regional healthcare initiatives. Japanese healthcare facilities face implementation challenges related to technology integration and workforce training requirements, requiring device upgrade approaches and comprehensive support systems. Growing patient care standards and treatment precision requirements create compelling business cases for infusion pump system adoption, particularly in hospital and home care sectors where clinical excellence has a direct impact on patient outcomes.
Market characteristics:
France's market leads in medical technology integration based on comprehensive healthcare delivery systems and advanced clinical applications for enhanced patient characteristics. The country shows solid potential with a CAGR of 4.1% through 2035, driven by healthcare modernization programs and medical excellence initiatives across major healthcare regions, including Île-de-France, Auvergne-Rhône-Alpes, Provence-Alpes-Côte d'Azur, and Occitanie. French healthcare providers are adopting advanced infusion systems for treatment optimization and clinical compliance, particularly in regions with comprehensive medical facilities and specialized care centers requiring superior performance capabilities. Technology deployment channels through established medical distributors and direct healthcare relationships expand coverage across hospitals and specialty care facilities.
Leading market segments:
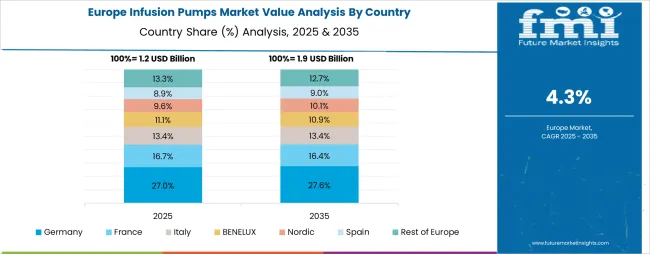
The infusion pumps market in Europe is projected to grow from USD 1.4 billion in 2025 to USD 2.3 billion by 2035, registering a CAGR of 5.1% over the forecast period. Germany is expected to maintain its leadership position with a 28.7% market share in 2025, declining slightly to 28.3% by 2035, supported by its extensive healthcare infrastructure and major medical centers, including Bavaria, North Rhine-Westphalia, and Baden-Württemberg healthcare hubs.
The United Kingdom follows with a 22.1% share in 2025, projected to reach 22.5% by 2035, driven by comprehensive NHS programs and advanced patient safety initiatives implementing infusion technologies. France holds a 19.3% share in 2025, expected to maintain 19.1% by 2035 through ongoing healthcare modernization and clinical excellence development. Italy commands a 14.2% share, while Spain accounts for 8.9% in 2025. The Rest of Europe region is anticipated to gain momentum, expanding its collective share from 6.8% to 7.5% by 2035, attributed to increasing infusion pump adoption in Nordic countries and emerging Eastern European healthcare markets implementing advanced medical device programs.
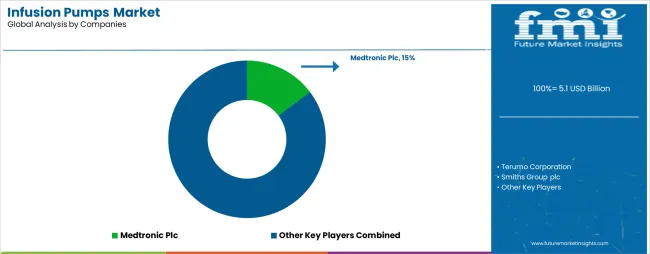
The infusion pumps market features approximately 15-20 meaningful players with moderate concentration, where the top three companies control roughly 40-45% of global market share through established medical device platforms and extensive healthcare relationships. Competition centers on clinical innovation, device reliability, and comprehensive patient safety features rather than price competition alone.
Market leaders include Terumo Corporation, Medtronic Plc, and B. Braun Melsungen AG, which maintain competitive advantages through comprehensive infusion solution portfolios, global healthcare networks, and deep expertise in the medical device and patient care sectors, creating high switching costs for healthcare providers. These companies leverage research and development capabilities and ongoing clinical support relationships to defend market positions while expanding into adjacent digital health and remote monitoring applications.
Challengers encompass Smiths Group plc and MOOG Inc., which compete through specialized infusion solutions and strong regional presence in key healthcare markets. Technology specialists, including Fresenius Kabi AG, Insulet Corporation, and ICU Medical Inc., focus on specific clinical applications or therapeutic areas, offering differentiated capabilities in insulin delivery, critical care systems, and specialized drug administration devices.
Regional players and emerging medical device providers create competitive pressure through innovative solutions and rapid customization capabilities, particularly in high-growth markets including China, India, and Brazil, where local presence provides advantages in regulatory compliance and healthcare system integration. Market dynamics favor companies that combine advanced infusion technologies with comprehensive clinical support offerings that address the complete patient care lifecycle from device implementation through ongoing treatment optimization.
Infusion pumps represent advanced medical technologies that enable healthcare providers to achieve 95-99% improvement in dosing accuracy compared to manual administration systems, delivering superior patient safety and treatment precision with enhanced monitoring capabilities in demanding clinical applications. With the market projected to grow from USD 5.1 billion in 2025 to USD 8.6 billion by 2035 at a 5.4% CAGR, these medical devices offer compelling advantages - enhanced treatment accuracy, customizable dosing protocols, and real-time monitoring integration - making them essential for hospitals, home care services, and specialty clinics seeking alternatives to manual drug administration systems that compromise safety through human error and dosing variability. Scaling market adoption and technological advancement requires coordinated action across healthcare regulations, medical device standards development, device manufacturers, healthcare providers, and medical technology investment capital.
| Items | Values |
|---|---|
| Quantitative Units | USD 5.1 Billion |
| Product Type | Syringe Pumps, Small Volume Pumps, Ambulatory Pumps, Volumetric Pumps, Peristaltic, Cassette/Piston, Implantable Pumps, Insulin Pumps, Enteral Pumps, PCA Pumps, Pump Accessories |
| Modality | Stationary Pumps, Infusion Pumps |
| Application | Chemotherapy/Oncology, Pediatrics/Neonatology, Analgesia, Gastroenterology, Hematology, Diabetes |
| End User | Hospitals, Ambulatory Surgical Centers, Home Care, Clinics, Others |
| Regions Covered | North America, Latin America, Western Europe, Eastern Europe, East Asia, South Asia Pacific, Middle East & Africa |
| Country Covered | USA, UK, Germany, Japan, France, and 40+ countries |
| Key Companies Profiled | Terumo Corporation, Medtronic Plc, Smiths Group plc, MOOG Inc., B. Braun Melsungen AG, Fresenius Kabi AG, Insulet Corporation, ICU Medical Inc., Baxter International Inc. |
| Additional Attributes | Dollar sales by product type, modality, application, and end user categories, regional adoption trends across North America, Western Europe, and East Asia, competitive landscape with medical device providers and healthcare system integrators, clinical requirements and specifications, integration with healthcare digitization initiatives and patient monitoring systems, innovations in infusion technology and safety systems, and development of specialized configurations with precision and reliability capabilities. |
The global infusion pumps market is estimated to be valued at USD 5.1 billion in 2025.
The market size for the infusion pumps market is projected to reach USD 8.6 billion by 2035.
The infusion pumps market is expected to grow at a 5.4% CAGR between 2025 and 2035.
The key product types in infusion pumps market are volumetric pumps, syringe pumps, small volume pumps, ambulatory pumps, peristaltic, cassette/piston, implantable pumps, insulin pumps, enteral pumps, pca pumps and pump accessories.
In terms of modality, stationary pumps segment to command 65.0% share in the infusion pumps market in 2025.


Our Research Products

The "Full Research Suite" delivers actionable market intel, deep dives on markets or technologies, so clients act faster, cut risk, and unlock growth.

The Leaderboard benchmarks and ranks top vendors, classifying them as Established Leaders, Leading Challengers, or Disruptors & Challengers.

Locates where complements amplify value and substitutes erode it, forecasting net impact by horizon

We deliver granular, decision-grade intel: market sizing, 5-year forecasts, pricing, adoption, usage, revenue, and operational KPIs—plus competitor tracking, regulation, and value chains—across 60 countries broadly.

Spot the shifts before they hit your P&L. We track inflection points, adoption curves, pricing moves, and ecosystem plays to show where demand is heading, why it is changing, and what to do next across high-growth markets and disruptive tech

Real-time reads of user behavior. We track shifting priorities, perceptions of today’s and next-gen services, and provider experience, then pace how fast tech moves from trial to adoption, blending buyer, consumer, and channel inputs with social signals (#WhySwitch, #UX).

Partner with our analyst team to build a custom report designed around your business priorities. From analysing market trends to assessing competitors or crafting bespoke datasets, we tailor insights to your needs.
Supplier Intelligence
Discovery & Profiling
Capacity & Footprint
Performance & Risk
Compliance & Governance
Commercial Readiness
Who Supplies Whom
Scorecards & Shortlists
Playbooks & Docs
Category Intelligence
Definition & Scope
Demand & Use Cases
Cost Drivers
Market Structure
Supply Chain Map
Trade & Policy
Operating Norms
Deliverables
Buyer Intelligence
Account Basics
Spend & Scope
Procurement Model
Vendor Requirements
Terms & Policies
Entry Strategy
Pain Points & Triggers
Outputs
Pricing Analysis
Benchmarks
Trends
Should-Cost
Indexation
Landed Cost
Commercial Terms
Deliverables
Brand Analysis
Positioning & Value Prop
Share & Presence
Customer Evidence
Go-to-Market
Digital & Reputation
Compliance & Trust
KPIs & Gaps
Outputs
Full Research Suite comprises of:
Market outlook & trends analysis
Interviews & case studies
Strategic recommendations
Vendor profiles & capabilities analysis
5-year forecasts
8 regions and 60+ country-level data splits
Market segment data splits
12 months of continuous data updates
DELIVERED AS:
PDF EXCEL ONLINE
Multi-therapy Infusion Pumps Market - Trends & Forecast 2025 to 2035
Implantable Drug Infusion Pumps Market
Pumps Market Size and Share Forecast Outlook 2025 to 2035
Infusion fluid holder Market Size and Share Forecast Outlook 2025 to 2035
Pumps and Trigger Spray Market Trends - Growth & Forecast 2025 to 2035
Infusion Pharmacy Management Market
Infusion Chair Market
Infusion Rate Monitoring Market
IV Infusion Bottle Seals & Caps Market Size and Share Forecast Outlook 2025 to 2035
IV Infusion Gravity Bags Market Size and Share Forecast Outlook 2025 to 2035
Examining Market Share Trends in IV Infusion Bottle Seals & Caps
Mud Pumps Market Growth - Trends & Forecast 2025 to 2035
Home Infusion Therapy Devices Market Analysis - Size, Share, and Forecast Outlook 2025 to 2035
Lobe Pumps Market
Solar Pumps Market Analysis - Size, Share, and Forecast Outlook 2025 to 2035
Charge Pumps Market Size and Share Forecast Outlook 2025 to 2035
Spinal Pumps Market Size and Share Forecast Outlook 2025 to 2035
Facial Pumps Market Growth – Demand & Forecast 2025 to 2035
Insulin Pumps Market Size and Share Forecast Outlook 2025 to 2035
Airless Pumps Market Analysis - Size, Demand & Forecast 2025 to 2035

Thank you!
You will receive an email from our Business Development Manager. Please be sure to check your SPAM/JUNK folder too.
Chat With
MaRIA