The global solar pumps market is valued at USD 1.99 billion in 2025 and is slated to reach USD 7.08 billion by 2035, recording an absolute increase of USD 5.09 billion over the forecast period. This translates into a total growth of 255.8%, with the market forecast to expand at a compound annual growth rate (CAGR) of 13.5% between 2025 and 2035. The overall market size is expected to grow by nearly 3.6X during the same period, supported by increasing demand for sustainable irrigation solutions, rising energy costs that make solar-powered alternatives more attractive, and rapid electrification in off-grid regions.
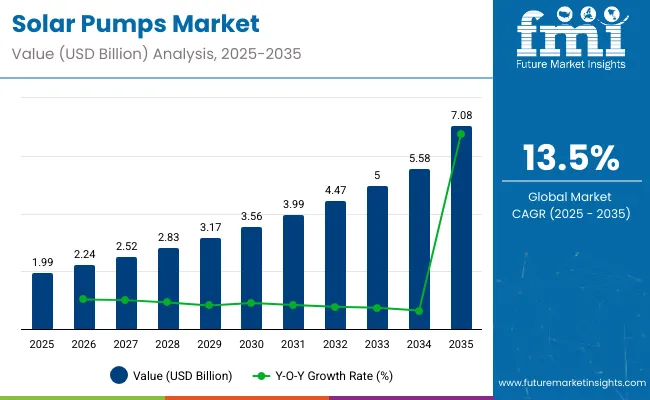
Solar Pumps Market Key Takeaways
| Metric | Value |
|---|---|
| Estimated Value in (2025E) | USD 1.99 billion |
| Forecast Value in (2035F) | USD 7.08 billion |
| Forecast CAGR (2025 to 2035) | 13.5% |
Between 2020 and 2025, the solar pumps market experienced robust expansion, driven by increasing focus on sustainable agriculture and growing awareness of the economic benefits of solar-powered water solutions. The market developed as governments recognized the need for renewable energy solutions to combat climate change and reduce dependence on fossil fuels. International development programs and climate financing began emphasizing the importance of solar pumps in rural electrification and food security initiatives.
Between 2025 and 2030, the solar pumps market is projected to expand significantly, driven by government-backed initiatives such as India's PM-KUSUM scheme, various solar water management programs in Africa, and aggressive decarbonization goals in developed economies. This phase of growth will be shaped by rising consumer awareness about sustainable water management, increasing demand for off-grid solutions, and growing penetration of solar technology in rural markets. Technology providers are expanding their solar pump portfolios to address the growing demand for energy-efficient water pumping solutions.
From 2030 to 2035, the market is forecast to experience accelerated growth, characterized by expansion of public-private partnerships, integration of advanced IoT and AI technologies in pump systems, and development of hybrid solar-diesel solutions. The growing adoption of smart irrigation systems and climate-resilient agricultural strategies will drive demand for high-efficiency solar pumps with enhanced monitoring capabilities and improved reliability.
Market expansion is being supported by the increasing global focus on renewable energy adoption and the corresponding demand for sustainable water management solutions. Modern agricultural practices are increasingly focused on energy-efficient irrigation systems that can operate independently of grid electricity, particularly in remote rural areas. Solar pumps' proven efficacy in reducing operational costs while providing reliable water access makes them a preferred choice for farmers and water management authorities worldwide.
The growing emphasis on carbon emission reduction and clean energy transition is driving demand for solar-powered alternatives to diesel and electric pumps. Government policies supporting renewable energy adoption, combined with declining solar panel costs and improving battery storage technologies, are creating favorable conditions for market growth. The rising influence of climate change mitigation strategies and sustainable development goals is also contributing to increased adoption across different regions and applications.
The market is segmented by type, capacity, end-use industry, and region. By type, the market is divided into DC solar pumps and AC solar pumps. Based on capacity, the market is categorized into Below 5 HP, 5 HP - 10 HP, and Above 10 HP. In terms of end-use industry, the market is segmented into agriculture, water management, and industrial. Regionally, the market is divided into North America, Latin America, Western Europe, Eastern Europe, South Asia, East Asia, and Middle East & Africa.
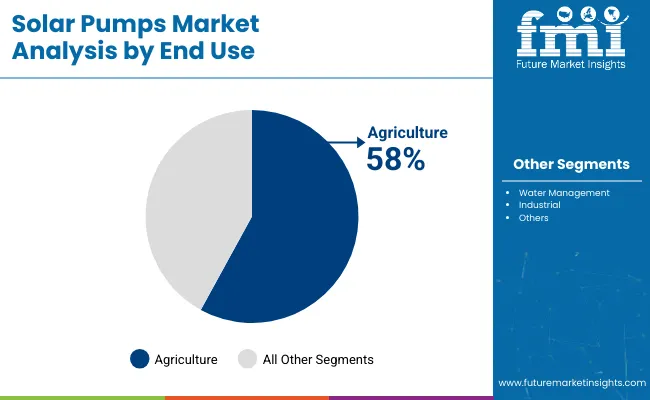
The agriculture segment is projected to account for 58% of the solar pumps market in 2025, reaffirming its position as the category's dominant application. Farmers increasingly understand the economic benefits of solar-powered irrigation systems, particularly in regions with unreliable grid electricity and high diesel costs. Solar pumps' ability to provide consistent water access while reducing long-term operational expenses directly addresses the core challenges faced by agricultural communities worldwide.
This segment forms the foundation of most market growth, as it represents the largest addressable market for solar pump deployment. Government subsidies and rural development programs continue to strengthen adoption in agricultural applications. With increasing focus on food security and sustainable farming practices, agriculture remains the primary driver ensuring sustained market expansion and creating opportunities for technology providers to develop specialized irrigation solutions.
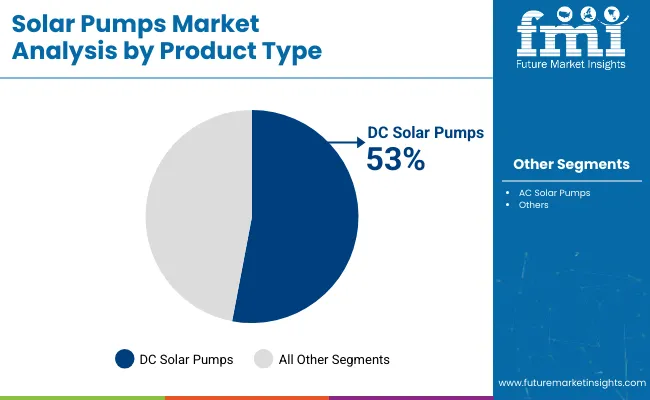
DC solar pumps are projected to account for 53% of the market during the forecast period, underscoring their role as the preferred technology for off-grid applications. Farmers and rural communities gravitate toward DC pumps for their direct connection to photovoltaic panels, eliminating the need for inverters and reducing system complexity. Positioned as cost-effective, efficient solutions, DC pumps offer both immediate benefits, such as lower installation costs, and long-term advantages, including minimal maintenance requirements.
The segment is supported by the rising popularity of small-scale irrigation systems, where DC pumps play a central role in providing reliable water access. Additionally, manufacturers are increasingly developing DC pump systems with integrated controllers and monitoring capabilities, enhancing appeal and performance. As rural electrification programs prioritize simple, robust solutions, DC solar pumps will continue to dominate adoption, reinforcing their position within the off-grid water pumping market.
The solar pumps market is advancing rapidly due to increasing government support for renewable energy adoption and growing demand for off-grid water solutions. However, the market faces challenges including high initial investment costs, dependence on sunlight availability, and limited energy storage capabilities. Innovation in battery storage systems and hybrid pump technologies continue to influence product development and market expansion patterns.
Government Incentives and Public-Private Partnerships
The growing implementation of government subsidy programs is enabling widespread adoption of solar pumps across rural and agricultural communities. Policy frameworks such as India's PM-KUSUM scheme provide up to 60% financial assistance for solar pump installation, while similar programs in Africa and Latin America reduce upfront costs for farmers. Public-private partnerships are facilitating technology transfer, financing solutions, and infrastructure development in underserved regions.
Advancements in Battery Storage and Hybrid Technologies
Modern solar pump manufacturers are incorporating advanced battery storage systems and hybrid solar-diesel configurations to address intermittency challenges. These technologies improve system reliability during low-sunlight periods while extending operational hours beyond daylight. Advanced battery management systems, including lithium-ion and flow batteries, enhance energy preservation and reduce lifecycle costs, making solar pumps more viable for continuous water supply applications.
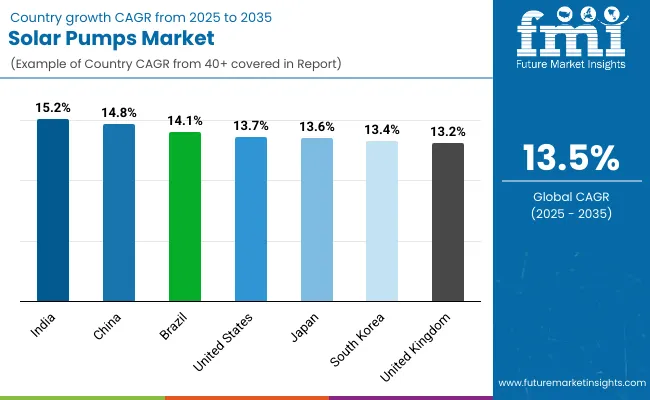
| Country | CAGR (2025 to 2035) |
|---|---|
| India | 15.2% |
| China | 14.8% |
| Brazil | 14.1% |
| United States | 13.7% |
| Japan | 13.6% |
| South Korea | 13.4% |
| United Kingdom | 13.2% |
The solar pumps market is experiencing robust growth globally, with India leading at a 15.2% CAGR through 2035, driven by massive government subsidies, large agricultural sector, and increasing rural electrification initiatives. China follows closely at 14.8%, supported by strong manufacturing capabilities, government renewable energy targets, and expanding rural development programs. The United States shows steady growth at 13.7%, focusing on sustainable agriculture practices and off-grid water solutions. The Japan records 13.6%, emphasizing clean energy transition and smart irrigation technologies. South Korea shows 13.4% growth, investing in advanced solar technologies and smart water management systems.
The report covers an in-depth analysis of 40+ countries; six top-performing countries are highlighted below.
Revenue from solar pumps in India is projected to exhibit exceptional growth with a CAGR of 15.2% through 2035, driven by the government's PM-KUSUM scheme and massive agricultural modernization initiatives. The country's large farming population and frequent power outages in rural areas create significant demand for reliable, off-grid water pumping solutions. Major domestic and international manufacturers are establishing comprehensive distribution networks to serve the growing population of farmers seeking sustainable irrigation alternatives.
Revenue from solar pumps in Brazil is projected to grow at a CAGR of 14.1% through 2035, supported by the country's vast agricultural sector, abundant solar resources, and increasing focus on sustainable farming practices. Brazil's large rural population and frequent challenges with grid electricity reliability create significant opportunities for solar pump deployment. Government incentives and international development funding are supporting rural electrification programs that include solar water pumping solutions.
Revenue from solar pumps in China is expanding at a CAGR of 14.8%, supported by the country's leading position in solar panel manufacturing, government renewable energy targets, and expanding rural modernization programs. China's comprehensive supply chain capabilities and cost-competitive manufacturing are making solar pumps accessible to domestic and international markets. The government's commitment to carbon neutrality and rural development is creating favorable conditions for sustained market growth.
Demand for solar pumps in the USA is projected to grow at a CAGR of 13.7%, supported by increasing adoption of sustainable farming practices and growing demand for off-grid water solutions in rural areas. American farmers are increasingly focused on reducing operational costs while maintaining reliable irrigation systems. The market is characterized by preference for high-quality, durable systems with advanced monitoring capabilities and integration with precision agriculture technologies.
Revenue from solar pumps in the Japan is projected to grow at a CAGR of 13.6% through 2035, driven by the region's Green Deal objectives, renewable energy policies, and increasing investment in smart agriculture technologies. European farmers are adopting solar pumps as part of broader sustainability initiatives and precision farming strategies.
Revenue from solar pumps in South Korea is projected to grow at a CAGR of 13.4% through 2035, supported by government renewable energy initiatives, technological innovation in solar systems, and increasing focus on rural development. The country's emphasis on advanced manufacturing and smart technologies is driving adoption of high-efficiency solar pump systems.
Revenue from solar pumps in the UK is projected to grow at a CAGR of 13.2% through 2035, supported by increasing focus on water conservation, off-grid solutions for remote areas, and sustainable agriculture practices. British farmers and rural communities are adopting solar pumps to reduce energy costs and improve water access reliability.
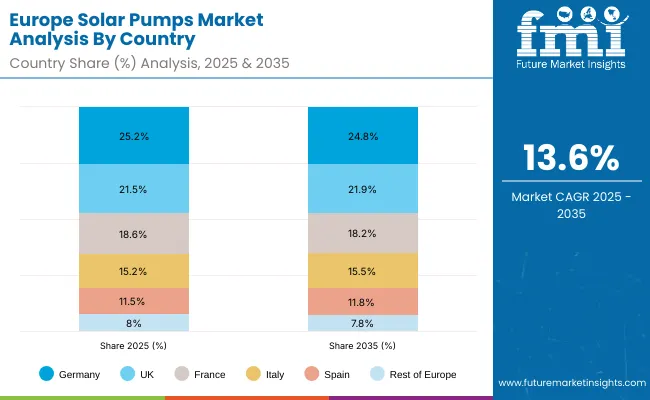
The solar pumps market in Europe is projected to grow at a CAGR of 13.6% during the forecast period. Germany will maintain its leadership position, holding 25.2% of the regional market in 2025 and slightly easing to 24.8% by 2035, supported by its strong commitment to renewable energy adoption, precision engineering in solar pump systems, and widespread integration of smart irrigation technologies. The United Kingdom follows with 21.5% in 2025, rising marginally to 21.9% by 2035, driven by increasing demand for sustainable agriculture practices, off-grid water solutions, and government-backed renewable energy programs.
France accounts for 18.6% in 2025, moderating to 18.2% by 2035, supported by expanding agricultural modernization initiatives and investments in clean energy-based irrigation solutions, particularly in the wine and horticultural sectors. Italy contributes 15.2% in 2025, rising slightly to 15.5% by 2035, reflecting growing adoption of solar pumps in smallholder farms and water conservation projects across high-irradiation southern regions. Spain represents 11.5% in 2025, advancing to 11.8% by 2035, backed by traditional farming communities seeking affordable irrigation solutions and EU-supported renewable energy programs. The Rest of Europe, including Nordic, BENELUX, and Eastern European countries, collectively holds 8.0% in 2025, strengthening to 7.8% by 2035, supported by EU Green Deal policies, rural modernization programs, and expanding access to solar-powered irrigation and water management systems.
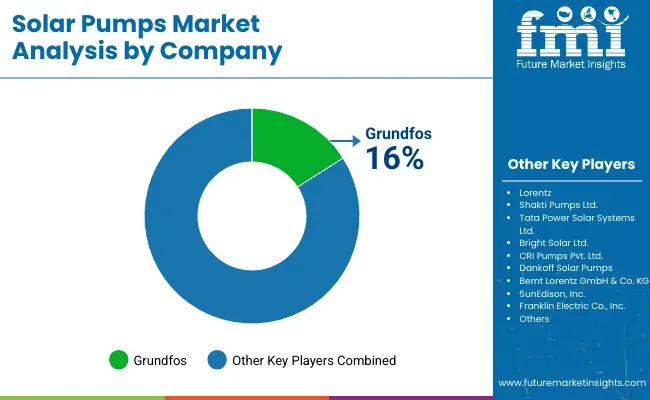
The solar pumps market is characterized by competition among established pump manufacturers, solar technology companies, and specialized water management solution providers. Companies are investing in advanced photovoltaic integration, battery storage systems, IoT monitoring capabilities, and hybrid technologies to deliver reliable, efficient, and cost-effective solar pumping solutions. Technology innovation, manufacturing scale, and distribution network expansion are central to strengthening market position and global reach.
Grundfos leads the market with significant global presence, offering comprehensive solar pump solutions with focus on intelligent water management and digital automation technologies. Lorentz provides specialized off-grid solar pumping systems with emphasis on remote monitoring and energy efficiency optimization. Shakti Pumps Ltd. delivers cost-effective solutions targeting agricultural markets with strong presence in India and Africa.
Tata Power Solar Systems leverages integrated solar infrastructure capabilities, combining pump systems with comprehensive solar energy solutions for agricultural and rural applications. Bright Solar Ltd. and CRI Pumps focus on regional markets with specialized products for specific applications. Dankoff Solar Pumps and Bernt Lorentz provide technical expertise in off-grid solutions, while SunEdison Inc. and Franklin Electric Co. Inc. offer comprehensive water management systems with solar integration capabilities.
Solar pumps, which use solar energy to drive water pumping systems, lie at the intersection of renewable energy adoption, agricultural sustainability, water security, and off-grid development. Demand is rising with climate change, water scarcity, and efforts to electrify rural areas. To move solar pump solutions from early adoption to widespread deployment, governments, industry bodies, manufacturers/OEMs, suppliers, and investors all have essential roles. Coordinated efforts can enable water access, reduce diesel dependence, and improve agricultural productivity globally.
| Items | Values |
|---|---|
| Quantitative Units (2025) | USD 1.99 Billion |
| Type | DC Solar Pumps, AC Solar Pumps |
| Capacity | Below 5 HP, 5 HP - 10 HP, Above 10 HP |
| End-Use Industry | Agriculture, Water Management, Industrial |
| Regions Covered | North America, Latin America, Western Europe, Eastern Europe, South Asia, East Asia, Middle East & Africa |
| Countries Covered | United States, Canada, Germany, United Kingdom, France, China, India, Japan, South Korea, Australia and 40+ countries |
| Key Companies Profiled | Grundfos, Lorentz, Shakti Pumps Ltd., Tata Power Solar Systems Ltd., Bright Solar Ltd., CRI Pumps Pvt. Ltd., Dankoff Solar Pumps, Bernt Lorentz GmbH & Co. KG, SunEdison Inc., Franklin Electric Co. Inc. |
| Additional Attributes | Government incentives and subsidy programs, technological advancements in photovoltaic efficiency, integration of IoT-based monitoring systems, expansion of off-grid applications, hybrid solar-diesel configurations, battery storage innovations, and sustainable water management solutions |
The global solar pumps market is estimated to be valued at USD 1.99 billion in 2025, driven by rising demand for off-grid irrigation and sustainable water supply solutions across agriculture and rural sectors.
The solar pumps market is projected to grow at a CAGR of 13.5% from 2025 to 2035, reaching USD 7.08 billion by 2035 due to government subsidies, clean energy initiatives, and technological advancements.
The agriculture segment holds the largest market share at 58% in 2025, owing to widespread adoption of solar-powered irrigation systems in regions with limited grid access and high diesel costs.
DC solar pumps are anticipated to grow at the fastest rate due to their high energy efficiency, lower installation cost, and suitability for off-grid applications in rural and agricultural settings.
The Asia Pacific region is expected to register the fastest growth in the solar pumps market, supported by large-scale government programs like India’s PM-KUSUM and increased investment in rural electrification and solar irrigation.


Our Research Products

The "Full Research Suite" delivers actionable market intel, deep dives on markets or technologies, so clients act faster, cut risk, and unlock growth.

The Leaderboard benchmarks and ranks top vendors, classifying them as Established Leaders, Leading Challengers, or Disruptors & Challengers.

Locates where complements amplify value and substitutes erode it, forecasting net impact by horizon

We deliver granular, decision-grade intel: market sizing, 5-year forecasts, pricing, adoption, usage, revenue, and operational KPIs—plus competitor tracking, regulation, and value chains—across 60 countries broadly.

Spot the shifts before they hit your P&L. We track inflection points, adoption curves, pricing moves, and ecosystem plays to show where demand is heading, why it is changing, and what to do next across high-growth markets and disruptive tech

Real-time reads of user behavior. We track shifting priorities, perceptions of today’s and next-gen services, and provider experience, then pace how fast tech moves from trial to adoption, blending buyer, consumer, and channel inputs with social signals (#WhySwitch, #UX).

Partner with our analyst team to build a custom report designed around your business priorities. From analysing market trends to assessing competitors or crafting bespoke datasets, we tailor insights to your needs.
Supplier Intelligence
Discovery & Profiling
Capacity & Footprint
Performance & Risk
Compliance & Governance
Commercial Readiness
Who Supplies Whom
Scorecards & Shortlists
Playbooks & Docs
Category Intelligence
Definition & Scope
Demand & Use Cases
Cost Drivers
Market Structure
Supply Chain Map
Trade & Policy
Operating Norms
Deliverables
Buyer Intelligence
Account Basics
Spend & Scope
Procurement Model
Vendor Requirements
Terms & Policies
Entry Strategy
Pain Points & Triggers
Outputs
Pricing Analysis
Benchmarks
Trends
Should-Cost
Indexation
Landed Cost
Commercial Terms
Deliverables
Brand Analysis
Positioning & Value Prop
Share & Presence
Customer Evidence
Go-to-Market
Digital & Reputation
Compliance & Trust
KPIs & Gaps
Outputs
Full Research Suite comprises of:
Market outlook & trends analysis
Interviews & case studies
Strategic recommendations
Vendor profiles & capabilities analysis
5-year forecasts
8 regions and 60+ country-level data splits
Market segment data splits
12 months of continuous data updates
DELIVERED AS:
PDF EXCEL ONLINE
Solar Water Pumps Market Size and Share Forecast Outlook 2025 to 2035
Agriculture Solar Water Pumps Market Size and Share Forecast Outlook 2025 to 2035
Solar Module Recycling Service Market Size and Share Forecast Outlook 2025 to 2035
Solar Tracking Module Market Size and Share Forecast Outlook 2025 to 2035
Solar Analyzer Market Size and Share Forecast Outlook 2025 to 2035
Solar Aluminum Alloy Frame Market Size and Share Forecast Outlook 2025 to 2035
Solar Grade Monocrystalline Silicon Rods Market Analysis - Size, Share, and Forecast Outlook 2025 to 2035
Solar Vehicle Market Size and Share Forecast Outlook 2025 to 2035
Solar PV Module Market Size and Share Forecast Outlook 2025 to 2035
Solar Encapsulation Market Size and Share Forecast Outlook 2025 to 2035
Solar Mobile Light Tower Market Size and Share Forecast Outlook 2025 to 2035
Pumps Market Size and Share Forecast Outlook 2025 to 2035
Solar PV Recycling Market Size and Share Forecast Outlook 2025 to 2035
Solar Tracker for Power Generation Market Size and Share Forecast Outlook 2025 to 2035
Solar Panel Market Size and Share Forecast Outlook 2025 to 2035
Solar-Powered Active Packaging Market Analysis - Size, Share, and Forecast Outlook 2025 to 2035
Solar Panel Recycling Management Market Size and Share Forecast Outlook 2025 to 2035
Solar Photovoltaic (PV) Market Size and Share Forecast Outlook 2025 to 2035
Solar EPC Market Size and Share Forecast Outlook 2025 to 2035
Solar-Powered UAV Market Size and Share Forecast Outlook 2025 to 2035

Thank you!
You will receive an email from our Business Development Manager. Please be sure to check your SPAM/JUNK folder too.
Chat With
MaRIA