The IV Infusion Gravity Bags Market is estimated to be valued at USD 858.9 million in 2025 and is projected to reach USD 1,519.4 million by 2035, registering a compound annual growth rate (CAGR) of 5.9% over the forecast period.
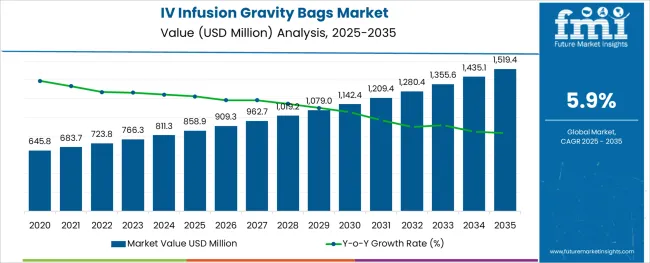
The IV infusion gravity bags market is witnessing steady expansion, driven by increasing demand for flexible, cost-effective, and sterile fluid administration systems in both developed and emerging healthcare environments. As global surgical volumes rise and chronic disease management becomes more institutionalized, gravity-based infusion remains a preferred method in settings with limited access to automated pumps.
The use of lightweight and durable polymers is enhancing product portability, while innovations in bag configuration and anti-leak mechanisms are improving safety and fluid control. A growing emphasis on infection prevention, single-use systems, and compatibility with various intravenous medications is encouraging product standardization across hospitals and ambulatory centers.
Furthermore, regional health infrastructure investments and pandemic-driven stockpiling have elevated demand consistency. Future opportunities are expected to emerge from smart fluid administration integration and sustainability-focused material engineering, positioning gravity infusion bags as a critical component in long-term patient care delivery.
The market is segmented by Material Type, Layer Type, and End User and region. By Material Type, the market is divided into Polypropylene (PP), Polyvinyl Chloride (PVC), Ethylene-Vinyl Acetate (EVA), Low-Density Polyethylene (LDPE), and Others. In terms of Layer Type, the market is classified into Single Layer and Multiple Layer. Based on End User, the market is segmented into Hospitals, Clinics, Ambulatory surgical Centers, and Others. Regionally, the market is classified into North America, Latin America, Western Europe, Eastern Europe, Balkan & Baltic Countries, Russia & Belarus, Central Asia, East Asia, South Asia & Pacific, and the Middle East & Africa.
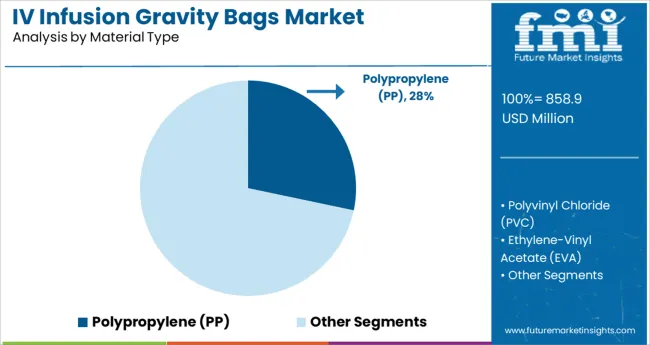
Polypropylene is projected to account for 28.3% of the total revenue within the material type category in 2025, making it the leading material used in IV infusion gravity bags. This position is supported by the material’s chemical resistance, lightweight properties, and high tensile strength, all of which contribute to safer and more durable infusion bags.
Polypropylene’s compatibility with sterilization techniques such as autoclaving and gamma irradiation has further expanded its use in medical-grade applications. The material offers a balance between cost efficiency and clinical performance, making it suitable for both large-scale hospital procurement and disposable product lines.
Its recyclability is also aligned with healthcare sustainability objectives, which has contributed to increased preference from institutions adhering to green procurement policies. These functional and environmental advantages have helped solidify polypropylene as the preferred material in the gravity infusion segment.
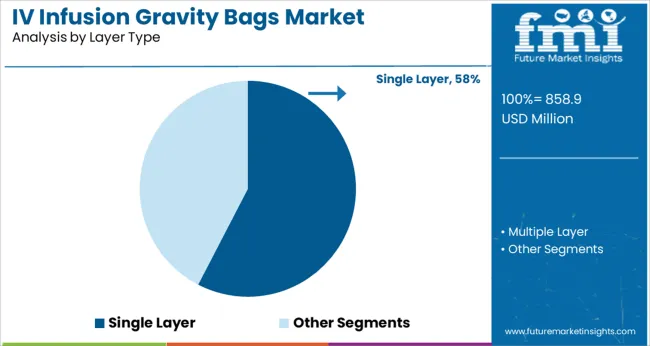
Single layer IV infusion gravity bags are expected to command 57.6% of the market’s revenue in 2025 under the layer type category, confirming their leading role. This leadership is attributed to the structural simplicity and production efficiency offered by single layer construction.
These bags are favored in high-volume hospital environments due to their ease of manufacture, reduced material consumption, and reliable performance in standard fluid delivery applications. Single layer designs simplify sterilization and sealing processes, lowering the risk of delamination or leakage during transport and use.
Their widespread compatibility with basic IV setups and cost-effectiveness in large-scale procurement have positioned them as the default option across multiple care settings. Manufacturers have continued to optimize single layer designs with reinforced seals and integrated suspension hooks, further strengthening their market share.
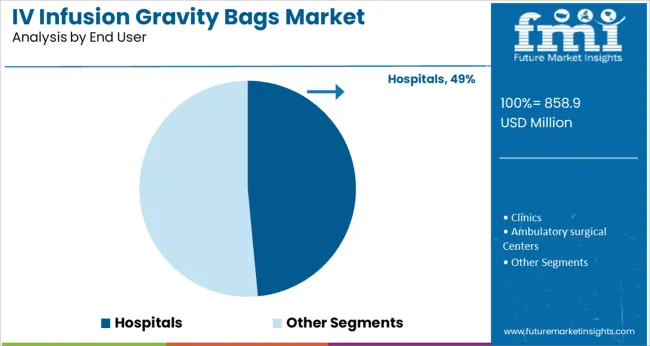
Hospitals are forecasted to hold 48.5% of the total revenue in 2025 within the end user category, representing the largest share of the IV infusion gravity bags market. This dominance is underpinned by the continuous demand for intravenous therapies in surgical units, emergency departments, intensive care units, and general wards.
Hospitals rely heavily on gravity-based infusion methods for their simplicity, reliability, and low operational costs, especially in scenarios where electric pumps are either unavailable or unnecessary. The need for standardized, sterile, and ready-to-use solutions for hydration, antibiotic delivery, and electrolyte balance has led to consistent bulk procurement of gravity bags
Furthermore, institutional protocols favor single-use bags to prevent cross-contamination and streamline workflow. With patient volumes rising globally and infection control remaining a critical focus area, hospitals are expected to maintain their position as the leading consumer of gravity infusion solutions.
The IV infusion gravity bags market shows healthy growth during the forecast period. The factors such as the increasing number of chronic disorders and an increasing number of surgeries on the global level are driving the growth of the IV infusion gravity bags market.
The IV infusion gravity bags carry infusion material for delivery into the patient’s vein. The flow of medication through IV infusion gravity bags is controlled by using a roller clamp device located on the IV pole. IV infusion gravity bags show a high rate of penetration owing to use in home care settings. The increasing penetration and ease in availability through the e-commerce website are boosting the growth of the IV infusion gravity bags market.
In addition, increasing the prevalence of malnutrition and blood transfusion processes in emerging economies are also gardening the market growth of IV infusion gravity bags.
The lack of sophisticated healthcare infrastructure and scarcity of skilled professionals in developing and under-developed regions are hindering the growth of the IV infusion gravity bags market. In addition, improper usage of IV infusion gravity bags is reducing the trust of the people in the bag. In creating geographical regions, the latest IV infusion gravity bags aren’t being used in healthcare facilities, thus, reducing the overall progress of the market.
Technological advancement in the healthcare sector in Europe is positively influencing the demand for IV infusion gravity bags. The increasing geriatric population pool in the region is another key factor driving the growth of the market. In addition, favorable government initiatives and insurance policies are promoting the growth of IV infusion gravity bags.
Owing to the reasons mentioned above, Europe is expected to hold a 26% market share for the IV infusion gravity bags market in 2025.
The market in Asia Pacific is anticipated to show the fastest CAGR over the forecast period owing to the presence of a large population base and an increasing number of hospitals and clinics. Moreover, the easy availability of IV infusion gravity bags is accelerating the market growth in the region. The increasing dominance of malnutrition in the Asia Pacific is increasing the demand for the IV infusion gravity bags market.
Asia Pacific is expected to procure a 22% market share for the IV infusion gravity bags market in 2025.
Key start-ups in the IV infusion gravity bags market are Shift Labs, 410 Medical, Navi Medical Technologies, Fosmo Med, Linear Health Services, and Lineus Medical
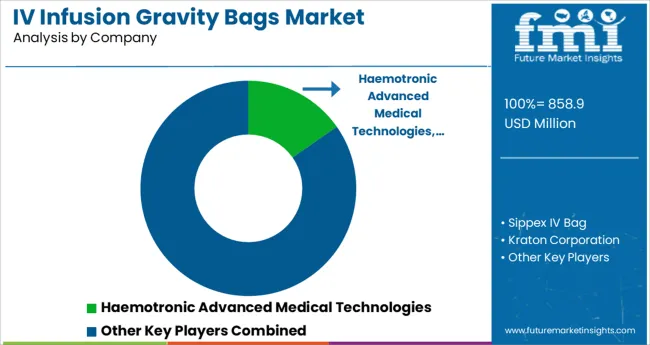
Some of the market participants in the global IV infusion gravity bags market are GVS, Sippex IV Bag, Kraton Corporation, ICU Medical, Inc., Baxter International Inc., Terumo BCT Ltd., The Metrix Company, Renolit, Technoflex, and Bioteque Corporation.
| Report Attribute | Details |
|---|---|
| Market Value in 2025 | USD 858.9 million |
| Market Value in 2035 | USD 1,519.4 million |
| Growth Rate | CAGR of 5.87% from 2025 to 2035 |
| Base Year for Estimation | 2024 |
| Historical Data | 2020 to 2024 |
| Forecast Period | 2025 to 2035 |
| Quantitative Units | Revenue in million and CAGR from 2025 to 2035 |
| Report Coverage | Revenue Forecast, Volume Forecast, Company Ranking, Competitive Landscape, Growth Factors, Trends, and Pricing Analysis |
| Segments Covered | Product Type, Application, Region |
| Regions Covered | North America; Latin America; Europe; Asia Pacific; Middle East and Africa |
| Key Countries Profiled | United States of America, Canada, Brazil, Argentina, Germany, United Kingdom, France, Spain, Italy, Nordics, BENELUX, Australia & New Zealand, China, India, ASIAN, GCC Countries, South Africa |
| Key Companies Profiled | Sippex IV Bag; GVS; Kraton Corporation; ICU Medical, Inc.; Baxter International Inc.; Terumo BCT Ltd.; The Metrix Company; Renolit; Technoflex; Bioteque Corporation. |
| Customization | Available Upon Request |
The global iv infusion gravity bags market is estimated to be valued at USD 858.9 million in 2025.
It is projected to reach USD 1,519.4 million by 2035.
The market is expected to grow at a 5.9% CAGR between 2025 and 2035.
The key product types are polypropylene (pp), polyvinyl chloride (pvc), ethylene-vinyl acetate (eva), low-density polyethylene (ldpe) and others.
single layer segment is expected to dominate with a 57.6% industry share in 2025.


Full Research Suite comprises of:
Market outlook & trends analysis
Interviews & case studies
Strategic recommendations
Vendor profiles & capabilities analysis
5-year forecasts
8 regions and 60+ country-level data splits
Market segment data splits
12 months of continuous data updates
DELIVERED AS:
PDF EXCEL ONLINE
IV Pole Market Size and Share Forecast Outlook 2025 to 2035
IV Disposables Market Size and Share Forecast Outlook 2025 to 2035
IVD Antibodies Market Size and Share Forecast Outlook 2025 to 2035
IV Bag Market Outlook - Growth, Demand & Forecast 2025 to 2035
IV Fluid Transfer Drugs Devices Market Trends – Growth & Forecast 2025 to 2035
IV Disinfecting Caps Market Trends - Growth, Demand & Forecast 2025 to 2035
Market Share Breakdown of the IV Bag Market
IV Therapy and Vein Access Devices Market Insights – Trends & Forecast 2024-2034
Global IVD Contract Manufacturing Market Trends – Size, Forecast & Growth 2024-2034
IVF Workstation Market
IV Infusion Bottle Seals & Caps Market Size and Share Forecast Outlook 2025 to 2035
Examining Market Share Trends in IV Infusion Bottle Seals & Caps
River Cruise Market Size and Share Forecast Outlook 2025 to 2035
HIV Diagnostics Market Size and Share Forecast Outlook 2025 to 2035
Dive Computer Market Forecast and Outlook 2025 to 2035
Diving And Survival Equipment Market Size and Share Forecast Outlook 2025 to 2035
Divided Motor Core Market Size and Share Forecast Outlook 2025 to 2035
Liver Disease Diagnostics Market Size and Share Forecast Outlook 2025 to 2035
HIV Self-testing Market Size and Share Forecast Outlook 2025 to 2035
Liver Cancer Diagnostics Market Size and Share Forecast Outlook 2025 to 2035

Thank you!
You will receive an email from our Business Development Manager. Please be sure to check your SPAM/JUNK folder too.
Chat With
MaRIA