The river cruise market is experiencing robust growth driven by rising disposable incomes, growing interest in experiential travel, and expanding cruise infrastructure across scenic waterways worldwide. Current market conditions reflect strong demand for premium leisure experiences, with operators focusing on offering immersive cultural, culinary, and regional exploration itineraries. Technological advancements in vessel design, sustainability features, and onboard digital services are enhancing passenger comfort and environmental compliance.
The market outlook is optimistic, supported by increasing participation from middle-aged and senior demographics seeking relaxed yet enriching travel options. Expansion into emerging destinations, including Asia and Eastern Europe, is broadening the industry’s global footprint.
Growth rationale is grounded in the increasing preference for smaller, destination-focused cruise experiences that offer convenience, safety, and cultural depth Strategic investments in fleet modernization, personalized service offerings, and diversified booking channels are expected to sustain momentum and position the river cruise industry as a major segment within the global leisure travel market.
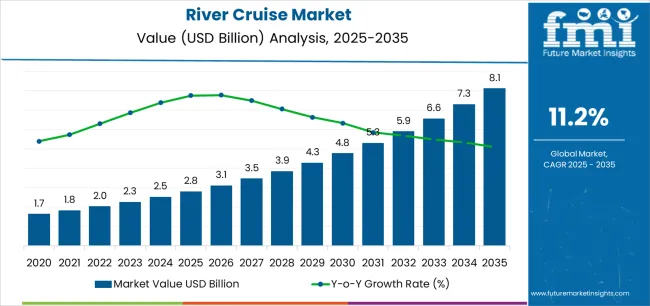
| Metric | Value |
|---|---|
| River Cruise Market Estimated Value in (2025 E) | USD 2.8 billion |
| River Cruise Market Forecast Value in (2035 F) | USD 8.1 billion |
| Forecast CAGR (2025 to 2035) | 11.2% |
The market is segmented by Type, Age Group, and Customer Orientation and region. By Type, the market is divided into Passenger Tickets and Onboard Facilities. In terms of Age Group, the market is classified into 46 to 55 Years, 15 to 25 Years, 26 to 35 Years, 36 to 45 Years, 56 to 65 Years, and 66 to 75 Years. Based on Customer Orientation, the market is segmented into Female, Male, and Others. Regionally, the market is classified into North America, Latin America, Western Europe, Eastern Europe, Balkan & Baltic Countries, Russia & Belarus, Central Asia, East Asia, South Asia & Pacific, and the Middle East & Africa.
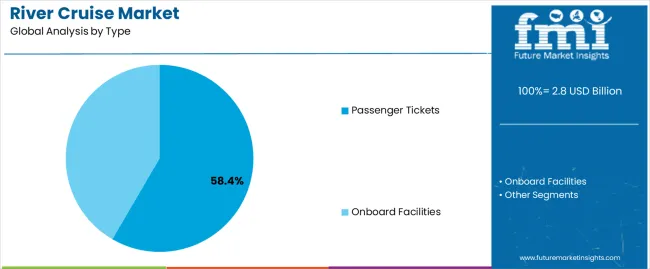
The passenger tickets segment, accounting for 58.4% of the type category, has remained the leading revenue generator due to the dominance of direct travel bookings and consistent demand for all-inclusive cruise packages. Its growth has been driven by increasing popularity of river cruises among affluent travelers seeking hassle-free vacation experiences. Operators have optimized ticketing strategies through online booking platforms, loyalty programs, and flexible pricing structures.
Market expansion has been reinforced by partnerships with travel agencies and tour operators offering curated experiences. Rising interest in themed cruises, cultural tours, and multi-river itineraries has further strengthened this segment’s position.
Continuous investment in customer engagement and digital integration is enhancing booking convenience and transparency Over the forecast period, steady growth is expected as travel confidence strengthens and consumer inclination toward premium, organized river experiences continues to rise.
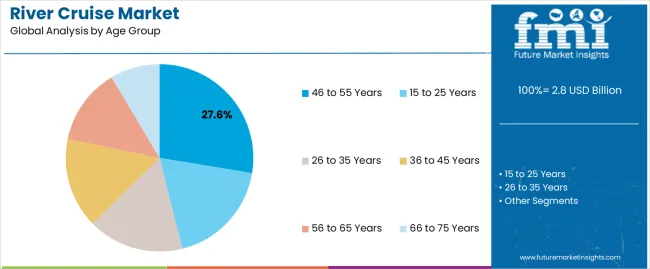
The 46 to 55 years segment, representing 27.6% of the age group category, has maintained leadership due to higher disposable income levels and lifestyle preferences favoring comfort-oriented travel. This demographic values culturally rich, low-stress vacation options that combine leisure with learning experiences.
Market participation has been strengthened by customized itineraries and flexible duration packages catering to mid-career professionals and mature travelers. Enhanced marketing efforts emphasizing wellness, fine dining, and destination immersion have supported segment dominance.
Growth is further supported by early retirement trends and increased interest in sustainable and slow-travel experiences Cruise operators are increasingly tailoring onboard entertainment, excursions, and social programs to this age group’s preferences, ensuring continued loyalty and consistent revenue contribution across key global markets.
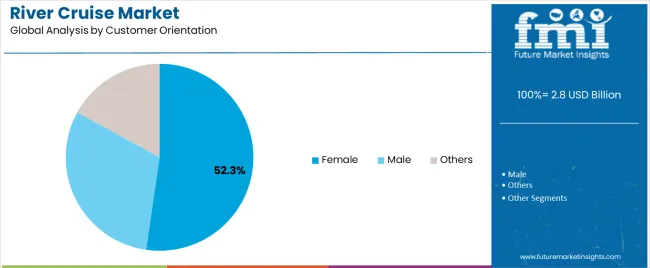
The female segment, accounting for 52.3% of the customer orientation category, has emerged as the dominant consumer group, reflecting growing female-led travel decisions and a rising preference for safe, organized, and socially engaging experiences. Market traction has been boosted by targeted promotions, women-centric packages, and solo travel offerings that emphasize comfort and community.
Female travelers are showing strong interest in wellness-oriented cruises, luxury amenities, and destination authenticity. Cruise operators have responded by curating inclusive activities, personalized services, and safety-focused environments that enhance travel confidence.
Social media influence and digital storytelling have amplified female traveler engagement, particularly among professional and independent women The segment’s sustained leadership is expected as industry players continue investing in women-focused marketing strategies, flexible packages, and premium service differentiation to meet evolving consumer expectations.
River cruises are often considered to be more secure than ocean cruises, which have lesser chances of getting seasick or encountering rough waters. This is also particularly attractive to those who may be afraid of big ocean liners.
River cruise companies prioritize safety through strict adherence to regulations and routine maintenance exercises performed on their ships while also advertising such measures as part of their promotional efforts toward prospective clients’ confidence-building purposes
River cruises offer a wholly distinctive option from typical land-based holidays or overcrowded ocean cruising. They are aimed at tourists who want to experience something different, such as unique itineraries and a focus on scenic waterways.
The companies have started developing thematic itineraries that appeal to various interests, such as wine tasting along European rivers or wildlife viewing cruises in exotic locations. This is in response to the growing demand for more specialized travel experiences.
River cruise companies are curating itineraries that focus on cultural immersion and include exclusive shore excursions, local food and wine experiences, and interactions with regional artisans. These companies enhance the onboard experience through the provision of high-end features such as spas, gourmet dining facilities, and enrichment lectures LED by local experts, among others.
Sustainability on the Waterways
Travelers’ environmental consciousness is set to become increasingly important going forward. River cruise companies have embraced eco-friendly practices by using hybrid or electric-powered vessels, adopting shore power in ports, and incorporating sustainable sourcing practices onboard their ships. As a result, this appeals to an increasing portion of eco-tourists who want sustainable tourism options.
Wellness Retreats on the River
The increasing interest in holistic wellness trips in the travel industry is spreading. Partnerships between river cruise companies and wellness professionals are taking place. They aim to plan itineraries that have yoga sessions on deck, healthy dining options, and access to specialized onboard spas. This is likely to satisfy travelers who would like to explore while still having some time for relaxation and rejuvenation.
Culinary Cruises with Local Flavors
The food and wine tourism sector is blossoming. The food element in river cruising has increasingly embraced immersive culinary experiences that see local chefs cook regional dishes right there in their kitchens, as well as take guests around wine estates, farmers’ markets, and cooking classes. Such a package appeals to tourists who wish to experience firsthand the culinary traditions associated with the places they visit.
Experiential Learning on the Move
River cruises are partnering with educational institutions and experts to offer onboard lectures, workshops, and interactive experiences related to the history, culture, and ecology of the regions traversed. For those curious holidaymakers who seek knowledge beyond mainstream tourist spots, this initiative is tailored by river cruise companies.
This section provides detailed insights into specific segments in the river cruise industry.
| By Type | Onboard facilities |
|---|---|
| Market Share in 2025 | 59% |
The onboard facilities segment holds the prime market share in the river cruise industry in 2025, capturing a significant 59%. Luxury and pleasurable are what many river cruisers desire. Therefore, enterprises invest in exclusive spas, swimming pools, gyms, and decent cabins.
Onboard fun choices that include live music plays in theaters or films at night increase the value of cruising and cater to passengers whose interests vary from one person to another.
Fine dining experiences characterized by regional cuisine and excellent customer service are a magnet for most river cruise clients. The improvement of meals offered contributes significantly to increased demand for on-board facilities where quality food is served.
As travel expectations rise higher and higher each day, river cruise companies are likely to continuously upgrade their onboard facilities to make them more exciting and fulfilling. Through this concentration on novelty, such roles remain dominant.
| Leading Age Group Segment | 36 to 45 Years |
|---|---|
| Market Share in 2025 | 26.20% |
The 36 to 45-year-old age group is expected to be the leading demographic segment in the river cruise industry in 2025. For this age group, adventures and new experiences are more important than usual holidays. This target group is attracted by the combination of cultural immersion, picturesque journeys, and pampering onboard facilities that river cruises offer.
This age group is entering a phase of greater financial security, allowing them to invest in premium travel experiences like river cruises. River cruise companies are embracing technology to enhance the passenger experience. This resonates with millennials who are accustomed to and appreciate digital integration in travel services.
The section analyzes the river cruise market across key countries, including the United States, United Kingdom, China, Japan, and India. The analysis delves into the specific factors driving the demand for river cruises in these countries.
| Countries | Forecasted CAGR from 2025 to 2035 |
|---|---|
| United States | 18.30% |
| United Kingdom | 8.10% |
| China | 14.70% |
| Japan | 2.90% |
| India | 6.30% |
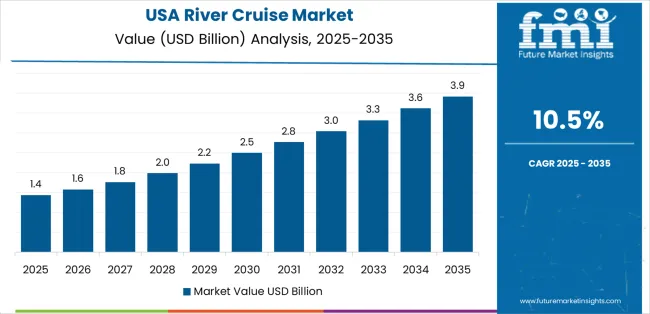
The river cruise market in the United States is anticipated to rise at a CAGR of 18.30% through 2035. Having a large population with good income levels, the US also has great potential as far as river cruises are concerned.
The United States has a strong network of navigable rivers and established river cruise operators that serve domestic traveler’s preferences. This is being done by the companies to gain a wider audience for their products and services and also to show how beautiful America’s rivers are.
Luxury, comfort, and posh amenities constitute the core values of American tourists. In this regard, river cruise companies in the United States have been known for offering high-class facilities and excellent service, which fit perfectly into these expectations.
The river cruise market in the United Kingdom is projected to rise at a CAGR of 8.10% through 2035. River cruises in the United Kingdom offer journeys along rivers like the Thames, steeped in history and lined with iconic landmarks. This appeals to travelers seeking cultural immersion.
Smaller, luxury river cruise vessels cater to the preferences of British travelers seeking a more intimate and personalized experience. With its geographical location, the United Kingdom has become a convenient starting point for travelers in Europe who desire to take up river cruises.
China’s river cruise market has seen a substantial increase, predicted at 14.70% CAGR by 2035. Leisure activities like river cruising are becoming more popular among China’s growing middle class, which is supported by their increasing disposable incomes.
The Yangtze River, as well as other picturesque waterways of China, present unique cultural experiences that attract domestic tourists wanting to explore their own country. Efforts by the government to boost local tourism in China have improved the river cruising business.
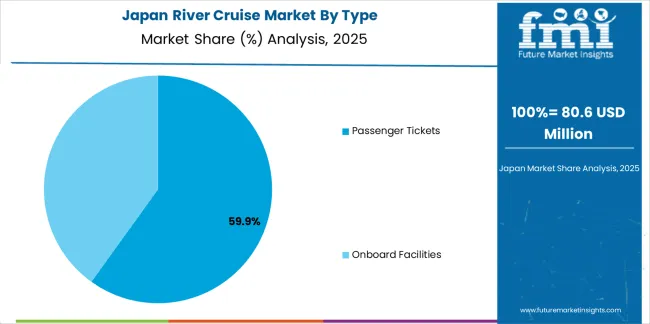
Japan's river cruise market exhibits a moderate CAGR of 2.90%, projected through 2035.
Japan’s river cruises often target certain seasons, with them being cherry blossom viewing during spring or fall foliage cruises. Domestic and international visitors are drawn to its seasonality.
Another factor that makes river cruises attractive in Japan is its well-established network of bullet trains, which enables easy access to the point of departure from various locations across the country. This preference for stillness often leads many individual travelers in Japan to choose rivers as their mode of travel between locations where there are uninterrupted trips along calm waters.
India's river cruise market is expected to rise at a 6.30% CAGR through 2035. India has begun promoting river tourism, subsequently channeling funds into building some river cruise infrastructure.
The Ganges, among other holy rivers found in India, are seen as having great religious importance. River cruises give tourists a unique opportunity to explore these hallowed waters. With the recent upsurge of local tourists, there is a ready market for those who want to experience India’s rich cultural heritage through river cruising.
The river cruise industry is currently experiencing fierce competition among established and startups. For instance, Viking River Cruises and Avalon Waterways dominate the market because they offer high-quality services and have diverse itineraries. To remain ahead of the competition, these firms invest in innovation, thus always launching new ships, onboard amenities, and destinations.
Recently, boutique operators have entered the market, specializing in niche markets or unique themes. As opposed to other players in the market, these small enterprises endeavor to offer specialized experiences like culinary-themed cruises, wellness adventures, or even adventure travel. Although they may not have economies of scale enjoyed by larger cruise lines, such companies are often very attractive to affluent travelers who prefer tailored and personalized services instead of large groups.
An intense rivalry in the river cruise sector has been on the rise between online travel agencies (OTAs) and travel aggregators. They do this through using digital platforms that enable them to price competitively, create package deals, and target promotions, which makes comparison between options easier, as well as online booking for river cruising purposes.
As a result, traditional cruise lines must adapt their marketing strategies and distribution channels to remain competitive in an increasingly digital landscape.
Recent Developments in the River Cruise Industry
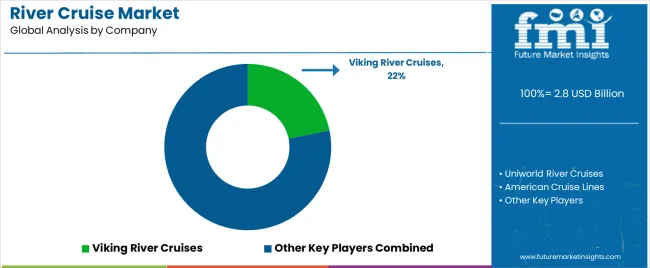
The global river cruise market is estimated to be valued at USD 2.8 billion in 2025.
The market size for the river cruise market is projected to reach USD 8.1 billion by 2035.
The river cruise market is expected to grow at a 11.2% CAGR between 2025 and 2035.
The key product types in river cruise market are passenger tickets and onboard facilities.
In terms of age group, 46 to 55 years segment to command 27.6% share in the river cruise market in 2025.


Full Research Suite comprises of:
Market outlook & trends analysis
Interviews & case studies
Strategic recommendations
Vendor profiles & capabilities analysis
5-year forecasts
8 regions and 60+ country-level data splits
Market segment data splits
12 months of continuous data updates
DELIVERED AS:
PDF EXCEL ONLINE
UK River Cruise Market Analysis - Growth & Forecast 2025 to 2035
Driver and Staff Management Software Market Size and Share Forecast Outlook 2025 to 2035
Driver Monitoring System Market Growth - Trends & Forecast 2025 to 2035
5G Driver Amplifier Market Size and Share Forecast Outlook 2025 to 2035
LED Driver IC Market Analysis - Size, Share, and Forecast Outlook 2025 to 2035
LED Driver for Lighting Market Analysis – Growth & Forecast 2025 to 2035
LED Driver Market
Gate Driver IC Market Size and Share Forecast Outlook 2025 to 2035
Screwdriver Market Size and Share Forecast Outlook 2025 to 2035
Drill Drivers Market Size and Share Forecast Outlook 2025 to 2035
Valve Driver Market Size and Share Forecast Outlook 2025 to 2035
Binary Drivers Market Size and Share Forecast Outlook 2025 to 2035
Display Drivers Market Growth – Size, Demand & Forecast 2025 to 2035
Advanced Driver Assistance System (ADAS) Testing Equipment Market Size and Share Forecast Outlook 2025 to 2035
Flash LED Driver ICs Market Size and Share Forecast Outlook 2025 to 2035
Biometric Driver Identification System Market Growth - Trends & Forecast 2025 to 2035
LED Backlight Driver Market Size and Share Forecast Outlook 2025 to 2035
Non-isolated LED Drivers Market Size and Share Forecast Outlook 2025 to 2035
LED Backlight Display Driver ICs Market – Growth & Forecast 2025 to 2035
Semiconductor Laser Diode Driver Market Size and Share Forecast Outlook 2025 to 2035

Thank you!
You will receive an email from our Business Development Manager. Please be sure to check your SPAM/JUNK folder too.
Chat With
MaRIA