Reports

- Global Locations -

Headquarters

Future Market Insights, Inc.

Christiana Corporate, 200
Continental Drive, Suite 401,
Newark, Delaware - 19713,
United States

T: +1-845-579-5705

Americas

Future Market Insights, Inc.

616 Corporate Way, Suite 2-9018,
Valley Cottage, NY 10989, United States

T: +1-347-918-3531

MEA

Future Market Insights

1602-6 Jumeirah Bay X2 Tower, Plot No: JLT-PH2-X2A,
Jumeirah Lakes Towers, Dubai,
United Arab Emirates

Europe

Future Market Insights

3rd Floor, 207 Regent Street,
W1B 3HH London
United Kingdom

T: + 44 (0) 20 8123 9659
D: +44 (0) 20 3287 4268

Asia Pacific

Future Market Insights

IndiaLand Global Tech Park, Unit UG-1, Behind Grand HighStreet, Phase 1, Hinjawadi, MH, Pune – 411057, India

Driver Monitoring System Market Outlook

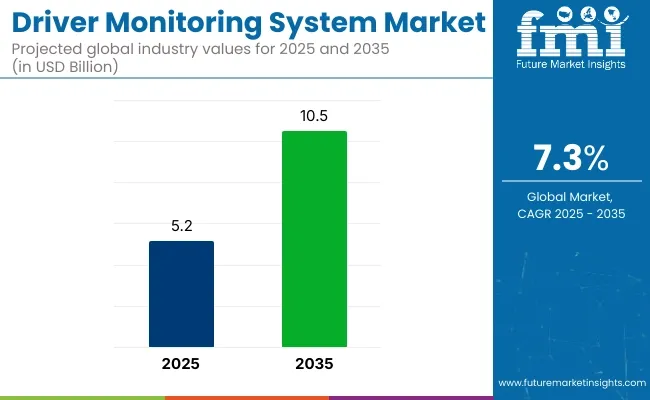
The driver monitoring system market is expected to reach an average CAGR of 7.5% during the forecast period. The market is likely to hold a revenue of US$ 4.5 billion in 2023 while it is anticipated to cross a value of US$ 9.3 billion by 2033.

The research report on the driver monitoring system market states that the increased cross-state passenger traffic, rising number of accidents due to drowsiness, and higher density of autonomous vehicles fuel the market growth. Furthermore, the integration of artificial intelligence, cloud systems, and internet-based systems is enabling the functions of driver monitoring systems (DMS). These systems include a driver-facing camera loaded with infrared LEDs or lasers along with various sensors that detect the driver’s condition.

The advent of self-driving or autonomous driving vehicles has boomed the demand for driver-monitoring systems. The increased transportation of goods and production across states and countries are pushing transport companies to install driver-monitoring systems in trucks. Governments are also strengthening the policies around autonomous vehicles to consider driver monitoring system projects as the future driving force for autonomous vehicles.

Driver monitoring system market analysis explains that leading autonomous automotive brands like Tesla and Toyota are undertaking big projects that load their vehicle with advanced DMS. Alongside this, the challenges of safety and security while being on the highways and country roads are constantly increasing. These threats involve drink and drive cases, amateur driving, and sleepiness during driving. The major number of accidents occur due to these factors, making driver monitoring systems relevant and in high demand. According to a report released by the World Health Organization (WHO) in 2020, roughly 1.35 million people die each year as a result of traffic accidents.

Attributes Details
Driver Monitoring System Market CAGR (2023 to 2033) 7.5%
Driver Monitoring System Market Size (2023) US$ 4.5 billion
Driver Monitoring System Market Size (2033) US$ 9.3 billion

Don't pay for what you don't need

Customize your report by selecting specific countries or regions and save 30%!

How is the Future Outlook (2023 to 2033) for Driver Monitoring System Market in Comparison to the Historical Pattern (2018 to 2022)?

Short-term Growth (2023 to 2026): The increasing number of accidents and government stringent policies for autonomous cars and trucks are expected to flourish the demand for DMS during this period. Furthermore, the companies extending their research and development activities are advancing the vehicle’s features including its safety dynamics. With an important role in driver’s safety, the market is expected to hold US$ 4.5 billion in 2023 while it is anticipated to reach US$ 5.59 billion by 2026.

Mid-term Growth (2026 to 2029): This period is likely to witness growth through the restoration of manufacturing and increased transport. Alongside this, the transforming road structure and autonomous vehicle-friendly lanes are also gaining traction for the overall success of autonomous automotive and driving monitoring systems. This takes a market value from US$ 5.59 billion in 2026 to a value of US$ 6.94 billion in 2029.

Long-term Growth (2029 to 2033): The usage of robotic technology along with the addition of artificial intelligence-based transmission is expected to transform the market during this period. The options like cruise control, and ADAS systems in mod-range passenger vehicles are also pushing the market size beyond its boundaries. Thus, the market is anticipated to thrive at a slightly lower CAGR of 7.5% between 2023 and 2033.

What Growth Drivers Flourish in the Market?

The stringent government policies around self-driving cars and other passenger vehicles are pushing vendors to find new ways to safeguard the driver and passengers. Thus, the camera and sensor technology are helping the technology is getting deployed. Moreover, the increasing per capita income in developed nations is reflecting the higher sales of autonomous vehicles like Tesla and others. Higher sales of these self-driving vehicles have a direct and positive impact on the driver monitoring systems market. The level 3 and level 4 autonomous driving platforms require the DMS. Level 3 is explained by the Society of Automotive Engineers (SAE) as conditional automation. This makes level 3 the platform on which the driver can take his/her hands off the steering while still maintaining the focus on the road. DMS is critical for self-driving or autonomous vehicles at Levels 3 and 4, which require drivers to re-engage and prepare to operate the car at key times along the journey.

Nikhil Kaitwade
Nikhil Kaitwade

Principal Consultant

Talk to Analyst

Find your sweet spots for generating winning opportunities in this market.

What are the Major Restraints in the Driver Monitoring System Market?

Some of the major restraints for the driver monitoring system market are a limited number of autonomous vehicles, lower awareness around people, and poor & old structured roads. Alongside this, the high cost of autonomous vehicles and third-party DMS installation is also restricting market growth.

Comparative View

Driver Monitoring System Market:

Attributes Driver Monitoring System Market
CAGR (2023 to 2033) 7.5%
Market Value (2033) US$ 9.3 billion
Growth Factor The rising number of accidents, increasing sales of autonomous vehicles, and the advent of infrared-based LED systems are expected to flourish the demand for driver monitoring systems during the forecast period.
Opportunity The stringent government policies around road safety, the developed nations building the roadmap for autonomous vehicles, and the functionality of autonomous vehicles are creating new opportunities for the market.
Key Trends The higher sales of vehicles offering level 3 and level four self-driving platforms are shaping the growth trends for the market.

Autonomous Cars Market:

Attributes Autonomous Cars Market
CAGR (2023 to 2033) 25.75%
Market Value (2033) US$ 391.73 billion
Growth Factor The extended research and development activities, restored manufacturing facilities along with the rising demand for fuel efficiency are collectively fuelling the demand for autonomous cars.
Opportunity The increased per capita incomes, higher living standards, different levels of autonomous driving platforms, and cheaper brands and alternatives are bringing new opportunities for the market.
Key Trends The addition of artificial intelligence and higher movement of passenger vehicles for country tours are shaping the trends in the market

Autonomous Truck Market:

Attributes Autonomous Truck Market
CAGR (2023 to 2033) 16.9%
Market Value (2033) US$ 6.11 billion
Growth Factor The restoration of logistics and transportation businesses along with government support to the businesses are pushing them to adopt autonomous trucks for better movement of goods and products.
Opportunity The increased testing and licensing, rising safety concerns through governments along with the subsidies provided by the authorities are creating new opportunities for the market.
Key Trends Supportive government along with the emergence of autonomous truck startups are flourishing the market trends for the market.

Get the data you need at a Fraction of the cost

Personalize your report by choosing insights you need
and save 40%!

Country-wise Insights

Region/Country Revenue Share % (2022)
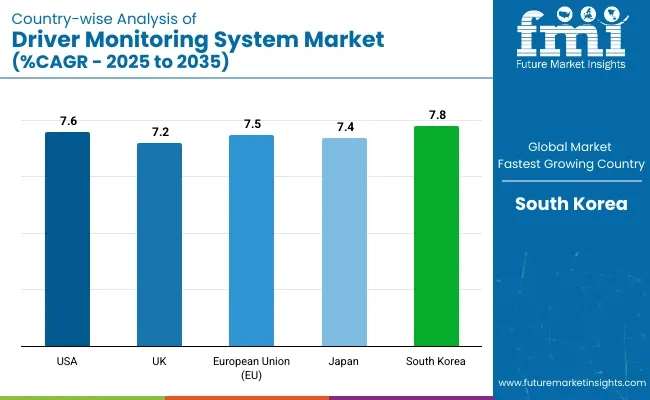
United States 16.9%
Germany 6.8%
Japan 5.0%
Australia 1.3%

Why is the United States Considered a Driver Monitoring System Market Leader?

Presence of Major Autonomous Vehicle Brands along with Enhanced Road Structure Flourishes the Regional Growth

The United States driver monitoring system market leads in terms of market share in the North American region. The region is expected to hold a market share of 16.9% in 2023. The growth flourished through the restored logistics and transportation industry along with passenger travel. The presence of the companies like Tesla and higher transportation activities in Canada and the United States is garnering market growth. Government efforts for easy transportation and travel are also fueling the demand for driver monitoring systems. Hence, the House of Representatives enacted the Moving Forward Act, a $1.5 trillion infrastructure plan focused on advancing the roads while making them safer in the country. One of the Act's safety delivers is to require the installation of technology that identifies inattentive or intoxicated driving in newly manufactured automobiles.

How does China perform in the Market?

High Passenger Vehicle Manufacturing to Support DMS Sales in China

The China driver monitoring system market thrives at a CAGR of 11.8% between 2023 and 2033. The growth is attributed to the higher penetration of autonomous technology. The higher driving population with dense and busy roads is pushing the demand for enhanced safety equipment. Furthermore, China crossed 33 million production units of passenger vehicles, making the local market a potential market for driver monitoring systems. Regulations mandating the installation of driver monitoring technology in vehicles are underway within the country, which is anticipated to positively impact the DMS market.

Category-Wise Landscape

Category By Technology
Leading Segment Ultrasonic Sensor
Market Share (2022) 20.5%
Category By Vehicle Type
Leading Segment Light Commercial Vehicle
Market Share (2022) 26.0%

Higher Affordability, Accurate Sensing, and Slightly Resistant to Darkness Make the Segment Helpful

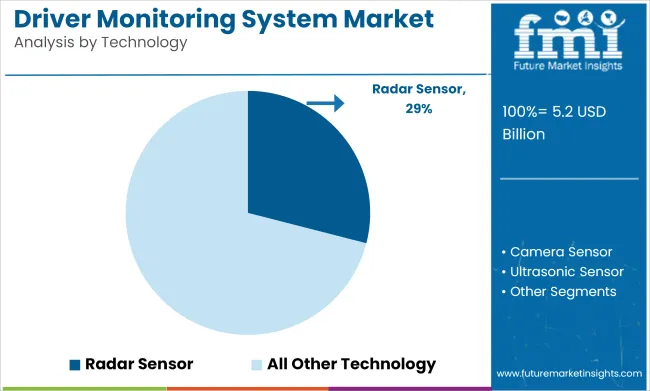
Based on technology, the ultrasonic sensor leads as it holds a major market share of 20.5% in 2023. The growth of this segment is attributed to it being the low-cost option along with the higher operability delivered by it in the dark. Furthermore, ultrasonic sensor technology is not highly affected by dust, dirt, and high moisture climate, making it a go-to option for the end-user.

Higher Consumption, Better Functionality, and LMV’s usage in Long Trips make the Segment Flourish

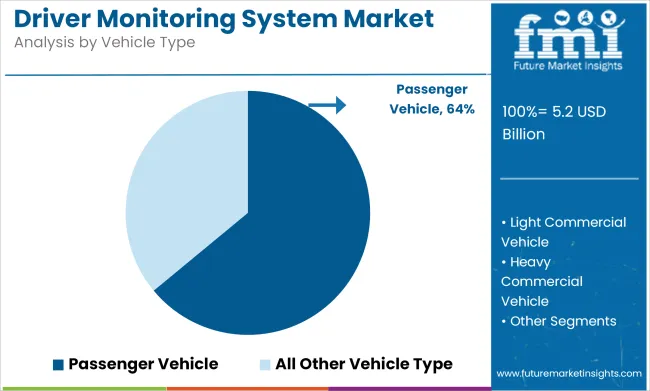
Based on technology, the light commercial vehicle segment leads as it holds a market share of 26.0% in 2022. The growth of this segment is expected to be garnered through the higher integration of ADAS in LMVs along with more people preferring it due to the bigger size, more seats, and higher comfort. These factors make LMS a custom family passenger vehicle.

Competition Scenario

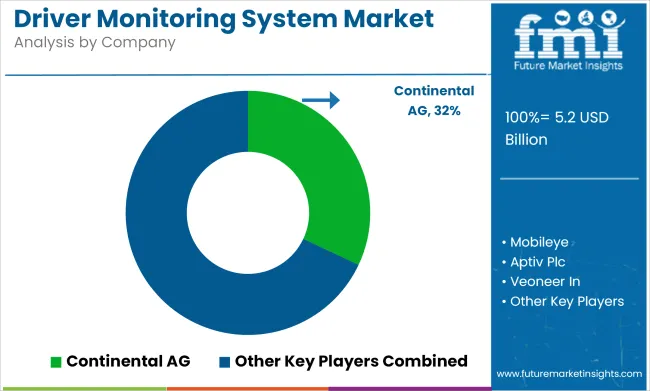
The key players in the market adopt advanced technological additions like artificial intelligence, laser technology, and enhanced sensory technology. Furthermore, the market is expected to gain momentum through several big, medium, and small-scale system developers, manufacturers, and service providers. The vendors focus on high-in-accuracy technologies that can help the DMS to identify the potential threats from the driver’s movements.

How can Driver Monitoring System Vendors Providers Scale their Businesses in the Market?

Market players in the market are working on three major strategies.

  • The competitive strategy usually involves the collaboration of the vendors with OEM facilities.
  • The addition of 4 eye-tracking systems to enhance accuracy while increasing the safety proposition.
  • Availability of customized systems for different vehicles is also a part of the vendor’s strategy.

Market Developments

  • Continental AG has introduced its cabin interior sensors with sophisticated design and enhanced safety. It comes with a miniaturized camera that can easily integrate with a wide range of displays. The system meets the legal regulations along with Euro NCAP specifications.
  • ZF Friedrichshafen AG has launched advanced sensor technologies with intelligent functions that come with next-generation radar, camera, and LiDAR systems.

Key Players

  • Continental AG
  • ZF Friedrichshafen AG
  • Mobileye
  • Aptiv Plc
  • Veoneer Inc.
  • Valeo SA
  • Magna International
  • Aisin Seiki Co., Ltd
  • Texas Instruments Incorporated
  • NXP Semiconductors N.V
  • Renesas Electronics Corporation
  • Intel Corporation
  • Hitachi, Ltd.

Key Segments Covered

By Technology:

  • Ultrasonic Sensor
  • Lidar Sensor
  • Radar Sensor
  • Camera Sensor
  • Infrared Sensor
  • Pressure Sensor

By Sales Channel:

  • OEM
  • Aftermarket

By Vehicle Type:

  • Passenger Vehicle
  • Light Commercial Vehicle
  • Heavy Commercial Vehicle

Key Regions Covered:

  • North America
    • UNITED STATES
    • Canada
  • Latin America
    • Brazil
    • Mexico
    • Rest of Latin America
  • Europe
    • Germany
    • United Kingdom
    • France
    • Spain
    • Russia
    • Rest of Europe
  • Japan
  • APEJ
    • China
    • India
    • Malaysia
    • Singapore
    • Australia
    • Rest of Asia Pacific Excluding Japan (APEJ)
  • MEA
    • GCC Countries
    • Israel
    • South Africa
    • Rest of Middle East Asia (MEA)

Frequently Asked Questions

How Big is the Driver Monitoring System Market?

The driver monitoring system market is valued at US$ 4.5 billion in 2023.

Who are the Key Players in the Driver Monitoring System Market?

Valeo SA and Mobileye are the key market players.

Which is the Key Segment by Technology?

Ultrasonic Sensors segment is likely to remain preferred through 2033.

Which is the Go-to-Market Strategy?

Players opt for mergers, product launches and acquisitions.

Which Countries are Advancing the Driver Monitoring System Market?

The United States, Germany, and Japan advancing the global market.

Table of Content

1. Executive Summary | Driver Monitoring System Market

    1.1. Global Market Outlook

    1.2. Demand-side Trends

    1.3. Supply-side Trends

    1.4. Technology Roadmap Analysis

    1.5. Analysis and Recommendations

2. Market Overview

    2.1. Market Coverage / Taxonomy

    2.2. Market Definition / Scope / Limitations

3. Market Background

    3.1. Market Dynamics

        3.1.1. Drivers

        3.1.2. Restraints

        3.1.3. Opportunity

        3.1.4. Trends

    3.2. Scenario Forecast

        3.2.1. Demand in Optimistic Scenario

        3.2.2. Demand in Likely Scenario

        3.2.3. Demand in Conservative Scenario

    3.3. Opportunity Map Analysis

    3.4. Product Life Cycle Analysis

    3.5. Supply Chain Analysis

        3.5.1. Supply Side Participants and their Roles

            3.5.1.1. Producers

            3.5.1.2. Mid-Level Participants (Traders/ Agents/ Brokers)

            3.5.1.3. Wholesalers and Distributors

        3.5.2. Value Added and Value Created at Node in the Supply Chain

        3.5.3. List of Raw Material Suppliers

        3.5.4. List of Existing and Potential Buyer’s

    3.6. Investment Feasibility Matrix

    3.7. Value Chain Analysis

        3.7.1. Profit Margin Analysis

        3.7.2. Wholesalers and Distributors

        3.7.3. Retailers

    3.8. PESTLE and Porter’s Analysis

    3.9. Regulatory Landscape

        3.9.1. By Key Regions

        3.9.2. By Key Countries

    3.10. Regional Parent Market Outlook

    3.11. Production and Consumption Statistics

    3.12. Import and Export Statistics

4. Global Market Analysis 2018 to 2022 and Forecast, 2023 to 2033

    4.1. Historical Market Size Value (US$ Million) & Volume (Units) Analysis, 2018 to 2022

    4.2. Current and Future Market Size Value (US$ Million) & Volume (Units) Projections, 2023 to 2033

        4.2.1. Y-o-Y Growth Trend Analysis

        4.2.2. Absolute $ Opportunity Analysis

5. Global Market Analysis 2018 to 2022 and Forecast 2023 to 2033, By Technology

    5.1. Introduction / Key Findings

    5.2. Historical Market Size Value (US$ Million) & Volume (Units) Analysis By Technology, 2018 to 2022

    5.3. Current and Future Market Size Value (US$ Million) & Volume (Units) Analysis and Forecast By Technology, 2023 to 2033

        5.3.1. Ultrasonic Sensor

        5.3.2. Lidar Sensor

        5.3.3. Radar Sensor

        5.3.4. Camera Sensor

        5.3.5. Infrared Sensor

        5.3.6. Pressure Sensor

    5.4. Y-o-Y Growth Trend Analysis By Technology, 2018 to 2022

    5.5. Absolute $ Opportunity Analysis By Technology, 2023 to 2033

6. Global Market Analysis 2018 to 2022 and Forecast 2023 to 2033, By Sales Channel

    6.1. Introduction / Key Findings

    6.2. Historical Market Size Value (US$ Million) & Volume (Units) Analysis By Sales Channel, 2018 to 2022

    6.3. Current and Future Market Size Value (US$ Million) & Volume (Units) Analysis and Forecast By Sales Channel, 2023 to 2033

        6.3.1. OEM

        6.3.2. Aftermarket

    6.4. Y-o-Y Growth Trend Analysis By Sales Channel, 2018 to 2022

    6.5. Absolute $ Opportunity Analysis By Sales Channel, 2023 to 2033

7. Global Market Analysis 2018 to 2022 and Forecast 2023 to 2033, By Vehicle Type

    7.1. Introduction / Key Findings

    7.2. Historical Market Size Value (US$ Million) & Volume (Units) Analysis By Vehicle Type, 2018 to 2022

    7.3. Current and Future Market Size Value (US$ Million) & Volume (Units) Analysis and Forecast By Vehicle Type, 2023 to 2033

        7.3.1. Passenger

        7.3.2. Light Commercial

        7.3.3. Heavy Commercial

    7.4. Y-o-Y Growth Trend Analysis By Vehicle Type, 2018 to 2022

    7.5. Absolute $ Opportunity Analysis By Vehicle Type, 2023 to 2033

8. Global Market Analysis 2018 to 2022 and Forecast 2023 to 2033, By Region

    8.1. Introduction

    8.2. Historical Market Size Value (US$ Million) & Volume (Units) Analysis By Region, 2018 to 2022

    8.3. Current Market Size Value (US$ Million) & Volume (Units) Analysis and Forecast By Region, 2023 to 2033

        8.3.1. North America

        8.3.2. Latin America

        8.3.3. Europe

        8.3.4. Asia Pacific

        8.3.5. MEA

    8.4. Market Attractiveness Analysis By Region

9. North America Market Analysis 2018 to 2022 and Forecast 2023 to 2033, By Country

    9.1. Historical Market Size Value (US$ Million) & Volume (Units) Trend Analysis By Market Taxonomy, 2018 to 2022

    9.2. Market Size Value (US$ Million) & Volume (Units) Forecast By Market Taxonomy, 2023 to 2033

        9.2.1. By Country

            9.2.1.1. The USA

            9.2.1.2. Canada

        9.2.2. By Technology

        9.2.3. By Sales Channel

        9.2.4. By Vehicle Type

    9.3. Market Attractiveness Analysis

        9.3.1. By Country

        9.3.2. By Technology

        9.3.3. By Sales Channel

        9.3.4. By Vehicle Type

    9.4. Key Takeaways

10. Latin America Market Analysis 2018 to 2022 and Forecast 2023 to 2033, By Country

    10.1. Historical Market Size Value (US$ Million) & Volume (Units) Trend Analysis By Market Taxonomy, 2018 to 2022

    10.2. Market Size Value (US$ Million) & Volume (Units) Forecast By Market Taxonomy, 2023 to 2033

        10.2.1. By Country

            10.2.1.1. Brazil

            10.2.1.2. Mexico

            10.2.1.3. Rest of Latin America

        10.2.2. By Technology

        10.2.3. By Sales Channel

        10.2.4. By Vehicle Type

    10.3. Market Attractiveness Analysis

        10.3.1. By Country

        10.3.2. By Technology

        10.3.3. By Sales Channel

        10.3.4. By Vehicle Type

    10.4. Key Takeaways

11. Europe Market Analysis 2018 to 2022 and Forecast 2023 to 2033, By Country

    11.1. Historical Market Size Value (US$ Million) & Volume (Units) Trend Analysis By Market Taxonomy, 2018 to 2022

    11.2. Market Size Value (US$ Million) & Volume (Units) Forecast By Market Taxonomy, 2023 to 2033

        11.2.1. By Country

            11.2.1.1. Germany

            11.2.1.2. United Kingdom

            11.2.1.3. France

            11.2.1.4. Spain

            11.2.1.5. Italy

            11.2.1.6. Rest of Europe

        11.2.2. By Technology

        11.2.3. By Sales Channel

        11.2.4. By Vehicle Type

    11.3. Market Attractiveness Analysis

        11.3.1. By Country

        11.3.2. By Technology

        11.3.3. By Sales Channel

        11.3.4. By Vehicle Type

    11.4. Key Takeaways

12. Asia Pacific Market Analysis 2018 to 2022 and Forecast 2023 to 2033, By Country

    12.1. Historical Market Size Value (US$ Million) & Volume (Units) Trend Analysis By Market Taxonomy, 2018 to 2022

    12.2. Market Size Value (US$ Million) & Volume (Units) Forecast By Market Taxonomy, 2023 to 2033

        12.2.1. By Country

            12.2.1.1. China

            12.2.1.2. Japan

            12.2.1.3. South Korea

            12.2.1.4. Singapore

            12.2.1.5. Thailand

            12.2.1.6. Indonesia

            12.2.1.7. Australia

            12.2.1.8. New Zealand

            12.2.1.9. Rest of Asia Pacific

        12.2.2. By Technology

        12.2.3. By Sales Channel

        12.2.4. By Vehicle Type

    12.3. Market Attractiveness Analysis

        12.3.1. By Country

        12.3.2. By Technology

        12.3.3. By Sales Channel

        12.3.4. By Vehicle Type

    12.4. Key Takeaways

13. MEA Market Analysis 2018 to 2022 and Forecast 2023 to 2033, By Country

    13.1. Historical Market Size Value (US$ Million) & Volume (Units) Trend Analysis By Market Taxonomy, 2018 to 2022

    13.2. Market Size Value (US$ Million) & Volume (Units) Forecast By Market Taxonomy, 2023 to 2033

        13.2.1. By Country

            13.2.1.1. GCC Countries

            13.2.1.2. South Africa

            13.2.1.3. Israel

            13.2.1.4. Rest of MEA

        13.2.2. By Technology

        13.2.3. By Sales Channel

        13.2.4. By Vehicle Type

    13.3. Market Attractiveness Analysis

        13.3.1. By Country

        13.3.2. By Technology

        13.3.3. By Sales Channel

        13.3.4. By Vehicle Type

    13.4. Key Takeaways

14. Key Countries Market Analysis

    14.1. USA

        14.1.1. Pricing Analysis

        14.1.2. Market Share Analysis, 2022

            14.1.2.1. By Technology

            14.1.2.2. By Sales Channel

            14.1.2.3. By Vehicle Type

    14.2. Canada

        14.2.1. Pricing Analysis

        14.2.2. Market Share Analysis, 2022

            14.2.2.1. By Technology

            14.2.2.2. By Sales Channel

            14.2.2.3. By Vehicle Type

    14.3. Brazil

        14.3.1. Pricing Analysis

        14.3.2. Market Share Analysis, 2022

            14.3.2.1. By Technology

            14.3.2.2. By Sales Channel

            14.3.2.3. By Vehicle Type

    14.4. Mexico

        14.4.1. Pricing Analysis

        14.4.2. Market Share Analysis, 2022

            14.4.2.1. By Technology

            14.4.2.2. By Sales Channel

            14.4.2.3. By Vehicle Type

    14.5. Germany

        14.5.1. Pricing Analysis

        14.5.2. Market Share Analysis, 2022

            14.5.2.1. By Technology

            14.5.2.2. By Sales Channel

            14.5.2.3. By Vehicle Type

    14.6. United Kingdom

        14.6.1. Pricing Analysis

        14.6.2. Market Share Analysis, 2022

            14.6.2.1. By Technology

            14.6.2.2. By Sales Channel

            14.6.2.3. By Vehicle Type

    14.7. France

        14.7.1. Pricing Analysis

        14.7.2. Market Share Analysis, 2022

            14.7.2.1. By Technology

            14.7.2.2. By Sales Channel

            14.7.2.3. By Vehicle Type

    14.8. Spain

        14.8.1. Pricing Analysis

        14.8.2. Market Share Analysis, 2022

            14.8.2.1. By Technology

            14.8.2.2. By Sales Channel

            14.8.2.3. By Vehicle Type

    14.9. Italy

        14.9.1. Pricing Analysis

        14.9.2. Market Share Analysis, 2022

            14.9.2.1. By Technology

            14.9.2.2. By Sales Channel

            14.9.2.3. By Vehicle Type

    14.10. China

        14.10.1. Pricing Analysis

        14.10.2. Market Share Analysis, 2022

            14.10.2.1. By Technology

            14.10.2.2. By Sales Channel

            14.10.2.3. By Vehicle Type

    14.11. Japan

        14.11.1. Pricing Analysis

        14.11.2. Market Share Analysis, 2022

            14.11.2.1. By Technology

            14.11.2.2. By Sales Channel

            14.11.2.3. By Vehicle Type

    14.12. South Korea

        14.12.1. Pricing Analysis

        14.12.2. Market Share Analysis, 2022

            14.12.2.1. By Technology

            14.12.2.2. By Sales Channel

            14.12.2.3. By Vehicle Type

    14.13. Singapore

        14.13.1. Pricing Analysis

        14.13.2. Market Share Analysis, 2022

            14.13.2.1. By Technology

            14.13.2.2. By Sales Channel

            14.13.2.3. By Vehicle Type

    14.14. Thailand

        14.14.1. Pricing Analysis

        14.14.2. Market Share Analysis, 2022

            14.14.2.1. By Technology

            14.14.2.2. By Sales Channel

            14.14.2.3. By Vehicle Type

    14.15. Indonesia

        14.15.1. Pricing Analysis

        14.15.2. Market Share Analysis, 2022

            14.15.2.1. By Technology

            14.15.2.2. By Sales Channel

            14.15.2.3. By Vehicle Type

    14.16. Australia

        14.16.1. Pricing Analysis

        14.16.2. Market Share Analysis, 2022

            14.16.2.1. By Technology

            14.16.2.2. By Sales Channel

            14.16.2.3. By Vehicle Type

    14.17. New Zealand

        14.17.1. Pricing Analysis

        14.17.2. Market Share Analysis, 2022

            14.17.2.1. By Technology

            14.17.2.2. By Sales Channel

            14.17.2.3. By Vehicle Type

    14.18. GCC Countries

        14.18.1. Pricing Analysis

        14.18.2. Market Share Analysis, 2022

            14.18.2.1. By Technology

            14.18.2.2. By Sales Channel

            14.18.2.3. By Vehicle Type

    14.19. South Africa

        14.19.1. Pricing Analysis

        14.19.2. Market Share Analysis, 2022

            14.19.2.1. By Technology

            14.19.2.2. By Sales Channel

            14.19.2.3. By Vehicle Type

    14.20. Israel

        14.20.1. Pricing Analysis

        14.20.2. Market Share Analysis, 2022

            14.20.2.1. By Technology

            14.20.2.2. By Sales Channel

            14.20.2.3. By Vehicle Type

15. Market Structure Analysis

    15.1. Competition Dashboard

    15.2. Competition Benchmarking

    15.3. Market Share Analysis of Top Players

        15.3.1. By Regional

        15.3.2. By Technology

        15.3.3. By Sales Channel

        15.3.4. By Vehicle Type

16. Competition Analysis

    16.1. Competition Deep Dive

        16.1.1. Continental AG

            16.1.1.1. Overview

            16.1.1.2. Product Portfolio

            16.1.1.3. Profitability by Market Segments

            16.1.1.4. Sales Footprint

            16.1.1.5. Strategy Overview

                16.1.1.5.1. Marketing Strategy

                16.1.1.5.2. Product Strategy

                16.1.1.5.3. Channel Strategy

        16.1.2. ZF Friedrichshafen AG

            16.1.2.1. Overview

            16.1.2.2. Product Portfolio

            16.1.2.3. Profitability by Market Segments

            16.1.2.4. Sales Footprint

            16.1.2.5. Strategy Overview

                16.1.2.5.1. Marketing Strategy

                16.1.2.5.2. Product Strategy

                16.1.2.5.3. Channel Strategy

        16.1.3. Mobileye

            16.1.3.1. Overview

            16.1.3.2. Product Portfolio

            16.1.3.3. Profitability by Market Segments

            16.1.3.4. Sales Footprint

            16.1.3.5. Strategy Overview

                16.1.3.5.1. Marketing Strategy

                16.1.3.5.2. Product Strategy

                16.1.3.5.3. Channel Strategy

        16.1.4. Aptiv Plc

            16.1.4.1. Overview

            16.1.4.2. Product Portfolio

            16.1.4.3. Profitability by Market Segments

            16.1.4.4. Sales Footprint

            16.1.4.5. Strategy Overview

                16.1.4.5.1. Marketing Strategy

                16.1.4.5.2. Product Strategy

                16.1.4.5.3. Channel Strategy

        16.1.5. Veoneer Inc.

            16.1.5.1. Overview

            16.1.5.2. Product Portfolio

            16.1.5.3. Profitability by Market Segments

            16.1.5.4. Sales Footprint

            16.1.5.5. Strategy Overview

                16.1.5.5.1. Marketing Strategy

                16.1.5.5.2. Product Strategy

                16.1.5.5.3. Channel Strategy

        16.1.6. Valeo SA

            16.1.6.1. Overview

            16.1.6.2. Product Portfolio

            16.1.6.3. Profitability by Market Segments

            16.1.6.4. Sales Footprint

            16.1.6.5. Strategy Overview

                16.1.6.5.1. Marketing Strategy

                16.1.6.5.2. Product Strategy

                16.1.6.5.3. Channel Strategy

        16.1.7. Magna International

            16.1.7.1. Overview

            16.1.7.2. Product Portfolio

            16.1.7.3. Profitability by Market Segments

            16.1.7.4. Sales Footprint

            16.1.7.5. Strategy Overview

                16.1.7.5.1. Marketing Strategy

                16.1.7.5.2. Product Strategy

                16.1.7.5.3. Channel Strategy

        16.1.8. Aisin Seiki Co., Ltd

            16.1.8.1. Overview

            16.1.8.2. Product Portfolio

            16.1.8.3. Profitability by Market Segments

            16.1.8.4. Sales Footprint

            16.1.8.5. Strategy Overview

                16.1.8.5.1. Marketing Strategy

                16.1.8.5.2. Product Strategy

                16.1.8.5.3. Channel Strategy

        16.1.9. Texas Instruments Incorporated

            16.1.9.1. Overview

            16.1.9.2. Product Portfolio

            16.1.9.3. Profitability by Market Segments

            16.1.9.4. Sales Footprint

            16.1.9.5. Strategy Overview

                16.1.9.5.1. Marketing Strategy

                16.1.9.5.2. Product Strategy

                16.1.9.5.3. Channel Strategy

        16.1.10. NXP Semiconductors N.V

            16.1.10.1. Overview

            16.1.10.2. Product Portfolio

            16.1.10.3. Profitability by Market Segments

            16.1.10.4. Sales Footprint

            16.1.10.5. Strategy Overview

                16.1.10.5.1. Marketing Strategy

                16.1.10.5.2. Product Strategy

                16.1.10.5.3. Channel Strategy

        16.1.11. Renesas Electronics Corporation

            16.1.11.1. Overview

            16.1.11.2. Product Portfolio

            16.1.11.3. Profitability by Market Segments

            16.1.11.4. Sales Footprint

            16.1.11.5. Strategy Overview

                16.1.11.5.1. Marketing Strategy

                16.1.11.5.2. Product Strategy

                16.1.11.5.3. Channel Strategy

        16.1.12. Intel Corporation

            16.1.12.1. Overview

            16.1.12.2. Product Portfolio

            16.1.12.3. Profitability by Market Segments

            16.1.12.4. Sales Footprint

            16.1.12.5. Strategy Overview

                16.1.12.5.1. Marketing Strategy

                16.1.12.5.2. Product Strategy

                16.1.12.5.3. Channel Strategy

        16.1.13. Hitachi, Ltd.

            16.1.13.1. Overview

            16.1.13.2. Product Portfolio

            16.1.13.3. Profitability by Market Segments

            16.1.13.4. Sales Footprint

            16.1.13.5. Strategy Overview

                16.1.13.5.1. Marketing Strategy

                16.1.13.5.2. Product Strategy

                16.1.13.5.3. Channel Strategy

17. Assumptions & Acronyms Used

18. Research Methodology

Don't pay for what you don't need

Customize your report by selecting specific countries or regions and save 30%!

List of Tables

Table 1: Global Market Value (US$ Million) Forecast by Region, 2018 to 2033

Table 2: Global Market Volume (Units) Forecast by Region, 2018 to 2033

Table 3: Global Market Value (US$ Million) Forecast by Technology, 2018 to 2033

Table 4: Global Market Volume (Units) Forecast by Technology, 2018 to 2033

Table 5: Global Market Value (US$ Million) Forecast by Sales Channel, 2018 to 2033

Table 6: Global Market Volume (Units) Forecast by Sales Channel, 2018 to 2033

Table 7: Global Market Value (US$ Million) Forecast by Vehicle Type, 2018 to 2033

Table 8: Global Market Volume (Units) Forecast by Vehicle Type, 2018 to 2033

Table 9: North America Market Value (US$ Million) Forecast by Country, 2018 to 2033

Table 10: North America Market Volume (Units) Forecast by Country, 2018 to 2033

Table 11: North America Market Value (US$ Million) Forecast by Technology, 2018 to 2033

Table 12: North America Market Volume (Units) Forecast by Technology, 2018 to 2033

Table 13: North America Market Value (US$ Million) Forecast by Sales Channel, 2018 to 2033

Table 14: North America Market Volume (Units) Forecast by Sales Channel, 2018 to 2033

Table 15: North America Market Value (US$ Million) Forecast by Vehicle Type, 2018 to 2033

Table 16: North America Market Volume (Units) Forecast by Vehicle Type, 2018 to 2033

Table 17: Latin America Market Value (US$ Million) Forecast by Country, 2018 to 2033

Table 18: Latin America Market Volume (Units) Forecast by Country, 2018 to 2033

Table 19: Latin America Market Value (US$ Million) Forecast by Technology, 2018 to 2033

Table 20: Latin America Market Volume (Units) Forecast by Technology, 2018 to 2033

Table 21: Latin America Market Value (US$ Million) Forecast by Sales Channel, 2018 to 2033

Table 22: Latin America Market Volume (Units) Forecast by Sales Channel, 2018 to 2033

Table 23: Latin America Market Value (US$ Million) Forecast by Vehicle Type, 2018 to 2033

Table 24: Latin America Market Volume (Units) Forecast by Vehicle Type, 2018 to 2033

Table 25: Europe Market Value (US$ Million) Forecast by Country, 2018 to 2033

Table 26: Europe Market Volume (Units) Forecast by Country, 2018 to 2033

Table 27: Europe Market Value (US$ Million) Forecast by Technology, 2018 to 2033

Table 28: Europe Market Volume (Units) Forecast by Technology, 2018 to 2033

Table 29: Europe Market Value (US$ Million) Forecast by Sales Channel, 2018 to 2033

Table 30: Europe Market Volume (Units) Forecast by Sales Channel, 2018 to 2033

Table 31: Europe Market Value (US$ Million) Forecast by Vehicle Type, 2018 to 2033

Table 32: Europe Market Volume (Units) Forecast by Vehicle Type, 2018 to 2033

Table 33: Asia Pacific Market Value (US$ Million) Forecast by Country, 2018 to 2033

Table 34: Asia Pacific Market Volume (Units) Forecast by Country, 2018 to 2033

Table 35: Asia Pacific Market Value (US$ Million) Forecast by Technology, 2018 to 2033

Table 36: Asia Pacific Market Volume (Units) Forecast by Technology, 2018 to 2033

Table 37: Asia Pacific Market Value (US$ Million) Forecast by Sales Channel, 2018 to 2033

Table 38: Asia Pacific Market Volume (Units) Forecast by Sales Channel, 2018 to 2033

Table 39: Asia Pacific Market Value (US$ Million) Forecast by Vehicle Type, 2018 to 2033

Table 40: Asia Pacific Market Volume (Units) Forecast by Vehicle Type, 2018 to 2033

Table 41: MEA Market Value (US$ Million) Forecast by Country, 2018 to 2033

Table 42: MEA Market Volume (Units) Forecast by Country, 2018 to 2033

Table 43: MEA Market Value (US$ Million) Forecast by Technology, 2018 to 2033

Table 44: MEA Market Volume (Units) Forecast by Technology, 2018 to 2033

Table 45: MEA Market Value (US$ Million) Forecast by Sales Channel, 2018 to 2033

Table 46: MEA Market Volume (Units) Forecast by Sales Channel, 2018 to 2033

Table 47: MEA Market Value (US$ Million) Forecast by Vehicle Type, 2018 to 2033

Table 48: MEA Market Volume (Units) Forecast by Vehicle Type, 2018 to 2033
Nikhil Kaitwade
Nikhil Kaitwade

Principal Consultant

Talk to Analyst

Find your sweet spots for generating winning opportunities in this market.

List of Charts

Figure 1: Global Market Value (US$ Million) by Technology, 2023 to 2033

Figure 2: Global Market Value (US$ Million) by Sales Channel, 2023 to 2033

Figure 3: Global Market Value (US$ Million) by Vehicle Type, 2023 to 2033

Figure 4: Global Market Value (US$ Million) by Region, 2023 to 2033

Figure 5: Global Market Value (US$ Million) Analysis by Region, 2018 to 2033

Figure 6: Global Market Volume (Units) Analysis by Region, 2018 to 2033

Figure 7: Global Market Value Share (%) and BPS Analysis by Region, 2023 to 2033

Figure 8: Global Market Y-o-Y Growth (%) Projections by Region, 2023 to 2033

Figure 9: Global Market Value (US$ Million) Analysis by Technology, 2018 to 2033

Figure 10: Global Market Volume (Units) Analysis by Technology, 2018 to 2033

Figure 11: Global Market Value Share (%) and BPS Analysis by Technology, 2023 to 2033

Figure 12: Global Market Y-o-Y Growth (%) Projections by Technology, 2023 to 2033

Figure 13: Global Market Value (US$ Million) Analysis by Sales Channel, 2018 to 2033

Figure 14: Global Market Volume (Units) Analysis by Sales Channel, 2018 to 2033

Figure 15: Global Market Value Share (%) and BPS Analysis by Sales Channel, 2023 to 2033

Figure 16: Global Market Y-o-Y Growth (%) Projections by Sales Channel, 2023 to 2033

Figure 17: Global Market Value (US$ Million) Analysis by Vehicle Type, 2018 to 2033

Figure 18: Global Market Volume (Units) Analysis by Vehicle Type, 2018 to 2033

Figure 19: Global Market Value Share (%) and BPS Analysis by Vehicle Type, 2023 to 2033

Figure 20: Global Market Y-o-Y Growth (%) Projections by Vehicle Type, 2023 to 2033

Figure 21: Global Market Attractiveness by Technology, 2023 to 2033

Figure 22: Global Market Attractiveness by Sales Channel, 2023 to 2033

Figure 23: Global Market Attractiveness by Vehicle Type, 2023 to 2033

Figure 24: Global Market Attractiveness by Region, 2023 to 2033

Figure 25: North America Market Value (US$ Million) by Technology, 2023 to 2033

Figure 26: North America Market Value (US$ Million) by Sales Channel, 2023 to 2033

Figure 27: North America Market Value (US$ Million) by Vehicle Type, 2023 to 2033

Figure 28: North America Market Value (US$ Million) by Country, 2023 to 2033

Figure 29: North America Market Value (US$ Million) Analysis by Country, 2018 to 2033

Figure 30: North America Market Volume (Units) Analysis by Country, 2018 to 2033

Figure 31: North America Market Value Share (%) and BPS Analysis by Country, 2023 to 2033

Figure 32: North America Market Y-o-Y Growth (%) Projections by Country, 2023 to 2033

Figure 33: North America Market Value (US$ Million) Analysis by Technology, 2018 to 2033

Figure 34: North America Market Volume (Units) Analysis by Technology, 2018 to 2033

Figure 35: North America Market Value Share (%) and BPS Analysis by Technology, 2023 to 2033

Figure 36: North America Market Y-o-Y Growth (%) Projections by Technology, 2023 to 2033

Figure 37: North America Market Value (US$ Million) Analysis by Sales Channel, 2018 to 2033

Figure 38: North America Market Volume (Units) Analysis by Sales Channel, 2018 to 2033

Figure 39: North America Market Value Share (%) and BPS Analysis by Sales Channel, 2023 to 2033

Figure 40: North America Market Y-o-Y Growth (%) Projections by Sales Channel, 2023 to 2033

Figure 41: North America Market Value (US$ Million) Analysis by Vehicle Type, 2018 to 2033

Figure 42: North America Market Volume (Units) Analysis by Vehicle Type, 2018 to 2033

Figure 43: North America Market Value Share (%) and BPS Analysis by Vehicle Type, 2023 to 2033

Figure 44: North America Market Y-o-Y Growth (%) Projections by Vehicle Type, 2023 to 2033

Figure 45: North America Market Attractiveness by Technology, 2023 to 2033

Figure 46: North America Market Attractiveness by Sales Channel, 2023 to 2033

Figure 47: North America Market Attractiveness by Vehicle Type, 2023 to 2033

Figure 48: North America Market Attractiveness by Country, 2023 to 2033

Figure 49: Latin America Market Value (US$ Million) by Technology, 2023 to 2033

Figure 50: Latin America Market Value (US$ Million) by Sales Channel, 2023 to 2033

Figure 51: Latin America Market Value (US$ Million) by Vehicle Type, 2023 to 2033

Figure 52: Latin America Market Value (US$ Million) by Country, 2023 to 2033

Figure 53: Latin America Market Value (US$ Million) Analysis by Country, 2018 to 2033

Figure 54: Latin America Market Volume (Units) Analysis by Country, 2018 to 2033

Figure 55: Latin America Market Value Share (%) and BPS Analysis by Country, 2023 to 2033

Figure 56: Latin America Market Y-o-Y Growth (%) Projections by Country, 2023 to 2033

Figure 57: Latin America Market Value (US$ Million) Analysis by Technology, 2018 to 2033

Figure 58: Latin America Market Volume (Units) Analysis by Technology, 2018 to 2033

Figure 59: Latin America Market Value Share (%) and BPS Analysis by Technology, 2023 to 2033

Figure 60: Latin America Market Y-o-Y Growth (%) Projections by Technology, 2023 to 2033

Figure 61: Latin America Market Value (US$ Million) Analysis by Sales Channel, 2018 to 2033

Figure 62: Latin America Market Volume (Units) Analysis by Sales Channel, 2018 to 2033

Figure 63: Latin America Market Value Share (%) and BPS Analysis by Sales Channel, 2023 to 2033

Figure 64: Latin America Market Y-o-Y Growth (%) Projections by Sales Channel, 2023 to 2033

Figure 65: Latin America Market Value (US$ Million) Analysis by Vehicle Type, 2018 to 2033

Figure 66: Latin America Market Volume (Units) Analysis by Vehicle Type, 2018 to 2033

Figure 67: Latin America Market Value Share (%) and BPS Analysis by Vehicle Type, 2023 to 2033

Figure 68: Latin America Market Y-o-Y Growth (%) Projections by Vehicle Type, 2023 to 2033

Figure 69: Latin America Market Attractiveness by Technology, 2023 to 2033

Figure 70: Latin America Market Attractiveness by Sales Channel, 2023 to 2033

Figure 71: Latin America Market Attractiveness by Vehicle Type, 2023 to 2033

Figure 72: Latin America Market Attractiveness by Country, 2023 to 2033

Figure 73: Europe Market Value (US$ Million) by Technology, 2023 to 2033

Figure 74: Europe Market Value (US$ Million) by Sales Channel, 2023 to 2033

Figure 75: Europe Market Value (US$ Million) by Vehicle Type, 2023 to 2033

Figure 76: Europe Market Value (US$ Million) by Country, 2023 to 2033

Figure 77: Europe Market Value (US$ Million) Analysis by Country, 2018 to 2033

Figure 78: Europe Market Volume (Units) Analysis by Country, 2018 to 2033

Figure 79: Europe Market Value Share (%) and BPS Analysis by Country, 2023 to 2033

Figure 80: Europe Market Y-o-Y Growth (%) Projections by Country, 2023 to 2033

Figure 81: Europe Market Value (US$ Million) Analysis by Technology, 2018 to 2033

Figure 82: Europe Market Volume (Units) Analysis by Technology, 2018 to 2033

Figure 83: Europe Market Value Share (%) and BPS Analysis by Technology, 2023 to 2033

Figure 84: Europe Market Y-o-Y Growth (%) Projections by Technology, 2023 to 2033

Figure 85: Europe Market Value (US$ Million) Analysis by Sales Channel, 2018 to 2033

Figure 86: Europe Market Volume (Units) Analysis by Sales Channel, 2018 to 2033

Figure 87: Europe Market Value Share (%) and BPS Analysis by Sales Channel, 2023 to 2033

Figure 88: Europe Market Y-o-Y Growth (%) Projections by Sales Channel, 2023 to 2033

Figure 89: Europe Market Value (US$ Million) Analysis by Vehicle Type, 2018 to 2033

Figure 90: Europe Market Volume (Units) Analysis by Vehicle Type, 2018 to 2033

Figure 91: Europe Market Value Share (%) and BPS Analysis by Vehicle Type, 2023 to 2033

Figure 92: Europe Market Y-o-Y Growth (%) Projections by Vehicle Type, 2023 to 2033

Figure 93: Europe Market Attractiveness by Technology, 2023 to 2033

Figure 94: Europe Market Attractiveness by Sales Channel, 2023 to 2033

Figure 95: Europe Market Attractiveness by Vehicle Type, 2023 to 2033

Figure 96: Europe Market Attractiveness by Country, 2023 to 2033

Figure 97: Asia Pacific Market Value (US$ Million) by Technology, 2023 to 2033

Figure 98: Asia Pacific Market Value (US$ Million) by Sales Channel, 2023 to 2033

Figure 99: Asia Pacific Market Value (US$ Million) by Vehicle Type, 2023 to 2033

Figure 100: Asia Pacific Market Value (US$ Million) by Country, 2023 to 2033

Figure 101: Asia Pacific Market Value (US$ Million) Analysis by Country, 2018 to 2033

Figure 102: Asia Pacific Market Volume (Units) Analysis by Country, 2018 to 2033

Figure 103: Asia Pacific Market Value Share (%) and BPS Analysis by Country, 2023 to 2033

Figure 104: Asia Pacific Market Y-o-Y Growth (%) Projections by Country, 2023 to 2033

Figure 105: Asia Pacific Market Value (US$ Million) Analysis by Technology, 2018 to 2033

Figure 106: Asia Pacific Market Volume (Units) Analysis by Technology, 2018 to 2033

Figure 107: Asia Pacific Market Value Share (%) and BPS Analysis by Technology, 2023 to 2033

Figure 108: Asia Pacific Market Y-o-Y Growth (%) Projections by Technology, 2023 to 2033

Figure 109: Asia Pacific Market Value (US$ Million) Analysis by Sales Channel, 2018 to 2033

Figure 110: Asia Pacific Market Volume (Units) Analysis by Sales Channel, 2018 to 2033

Figure 111: Asia Pacific Market Value Share (%) and BPS Analysis by Sales Channel, 2023 to 2033

Figure 112: Asia Pacific Market Y-o-Y Growth (%) Projections by Sales Channel, 2023 to 2033

Figure 113: Asia Pacific Market Value (US$ Million) Analysis by Vehicle Type, 2018 to 2033

Figure 114: Asia Pacific Market Volume (Units) Analysis by Vehicle Type, 2018 to 2033

Figure 115: Asia Pacific Market Value Share (%) and BPS Analysis by Vehicle Type, 2023 to 2033

Figure 116: Asia Pacific Market Y-o-Y Growth (%) Projections by Vehicle Type, 2023 to 2033

Figure 117: Asia Pacific Market Attractiveness by Technology, 2023 to 2033

Figure 118: Asia Pacific Market Attractiveness by Sales Channel, 2023 to 2033

Figure 119: Asia Pacific Market Attractiveness by Vehicle Type, 2023 to 2033

Figure 120: Asia Pacific Market Attractiveness by Country, 2023 to 2033

Figure 121: MEA Market Value (US$ Million) by Technology, 2023 to 2033

Figure 122: MEA Market Value (US$ Million) by Sales Channel, 2023 to 2033

Figure 123: MEA Market Value (US$ Million) by Vehicle Type, 2023 to 2033

Figure 124: MEA Market Value (US$ Million) by Country, 2023 to 2033

Figure 125: MEA Market Value (US$ Million) Analysis by Country, 2018 to 2033

Figure 126: MEA Market Volume (Units) Analysis by Country, 2018 to 2033

Figure 127: MEA Market Value Share (%) and BPS Analysis by Country, 2023 to 2033

Figure 128: MEA Market Y-o-Y Growth (%) Projections by Country, 2023 to 2033

Figure 129: MEA Market Value (US$ Million) Analysis by Technology, 2018 to 2033

Figure 130: MEA Market Volume (Units) Analysis by Technology, 2018 to 2033

Figure 131: MEA Market Value Share (%) and BPS Analysis by Technology, 2023 to 2033

Figure 132: MEA Market Y-o-Y Growth (%) Projections by Technology, 2023 to 2033

Figure 133: MEA Market Value (US$ Million) Analysis by Sales Channel, 2018 to 2033

Figure 134: MEA Market Volume (Units) Analysis by Sales Channel, 2018 to 2033

Figure 135: MEA Market Value Share (%) and BPS Analysis by Sales Channel, 2023 to 2033

Figure 136: MEA Market Y-o-Y Growth (%) Projections by Sales Channel, 2023 to 2033

Figure 137: MEA Market Value (US$ Million) Analysis by Vehicle Type, 2018 to 2033

Figure 138: MEA Market Volume (Units) Analysis by Vehicle Type, 2018 to 2033

Figure 139: MEA Market Value Share (%) and BPS Analysis by Vehicle Type, 2023 to 2033

Figure 140: MEA Market Y-o-Y Growth (%) Projections by Vehicle Type, 2023 to 2033

Figure 141: MEA Market Attractiveness by Technology, 2023 to 2033

Figure 142: MEA Market Attractiveness by Sales Channel, 2023 to 2033

Figure 143: MEA Market Attractiveness by Vehicle Type, 2023 to 2033

Figure 144: MEA Market Attractiveness by Country, 2023 to 2033

Recommendations

Automotive

Biometric Driver Identification System Market

Published : December 2022

Explore Automotive Insights

View Reports

Driver Monitoring System Market