Insulin Pumps Market
Insulin pump market to swell due to rising diabetic cases: Opportunities ahead
Insulin Pumps Market By Type, Product Type, Accessories, End-User & Region - Forecast 2022-2032
Insulin Pumps Market Snapshot
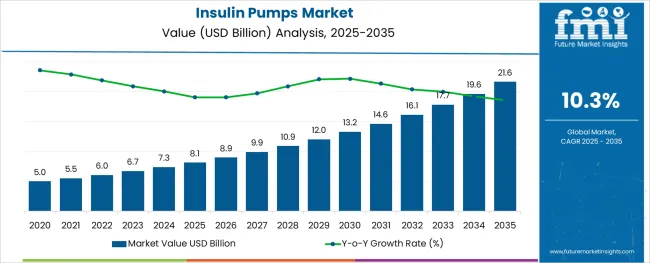
Newly-released Insulin Pump market analysis report by Future Market Insights shows that global sales of the Insulin Pump market in 2021 was held at US$ 5 Bn. With 10.3%, the projected market growth during 2022 - 2032 is expected to be significantly higher than the historical growth. The absolute dollar opportunity for the Insulin Pump market is projected at US$ 9.7 Bn, due to an aging population, an increase in diabetes incidence, and a surge in the prevalence of overweight and obesity.
Attribute |
Details |
Global Insulin Pumps Market (2022) |
US$ 5.5 Bn |
Global Insulin Pumps Market (2032) |
US$ 14.8 Bn |
Global Insulin Pumps Market CAGR (2022 – 2032) |
10.3% |
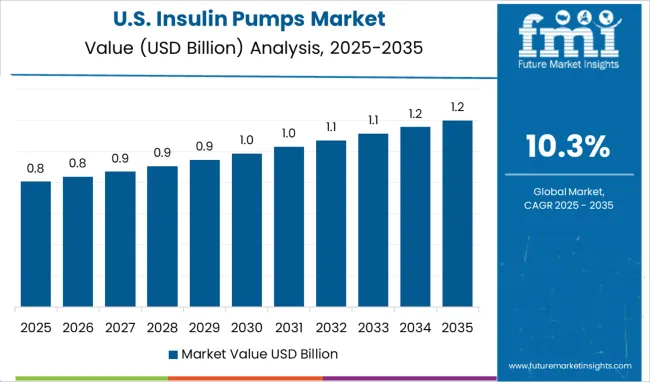
U.S. Insulin Pumps Market (2022) |
8.5% |
Key Companies Profiled |
|
Let us know your requirement to get
100% FREE customization
Revenue of Insulin Pump market from 2017 to 2021 Compared to Demand Outlook for 2022 to 2032
As per the Insulin Pump market research by Future Market Insights - a market research and competitive intelligence provider, historically, from 2017 to 2021, market value of the Insulin Pump markets increased at around 9.6% CAGR, wherein, the region North America held significant share in the global market.
The dominance of chronic diseases like chronic respiratory diseases, mental illnesses, cancer, diabetes surge the demand of Insulin Pump. Apart from this, by 2030, The WHO (World Health Organization) estimated that the global population aged 60 years and over will increase to 1.4 billion. The growing age of elderly population also a key factor for driving the market of Insulin Pump. Owing to this, Insulin Pump market is projected to grow at a CAGR of 9.8% over the coming 10 years.
What will be the growth prospects of Insulin Pump market?
Technological developments and the increasing use of insulin pumps over older techniques which is affecting insulin market growth. Insulin pumps are useful for patients who need several insulin injections on a daily basis. Because these devices are less intrusive, they are widely used by patients. The growing elderly population, rising diabetes incidence, and obesity rates prevalence are factors driving market expansion. Additionally, firms are creating next-generation insulin pumps with advanced technology to improve compliance and interaction with IT devices, which is adding to market growth. Technological advancements such as artificial pancreas and home infusion treatment are also expected to generate major growth prospects in the near future.
One of the reasons driving market expansion is an increase in the incidence of diabetes owing to age, obesity, and an unhealthy lifestyle. Obesity is a primary cause of diabetes, which leads to a rise in the prevalence of diabetes-related ocular illnesses. In 2017, the worldwide incidence of diabetes was estimated to be about 22.9 million, the prevalence was reported to be around 476 million, 1.37 million fatalities were recorded owing to diabetes, and 1.37 million disability-adjusted life-years (DALYs) were reported to be related to diabetes. According to the WHO, over 1.9 billion individuals were overweight in 2017, with around 650 million people classed as obese.
Obesity and being overweight are risk factors that are increasing the occurrence of type II diabetes. As a result, risk factors such as smoking, being overweight, being obese, and having high cholesterol are likely to increase the prevalence of type II diabetes.
Find your sweet spots for generating winning opportunities in this market.
Talk to AnalystWhich Region is projected to Offer the Largest Opportunity for Insulin Pump markets?
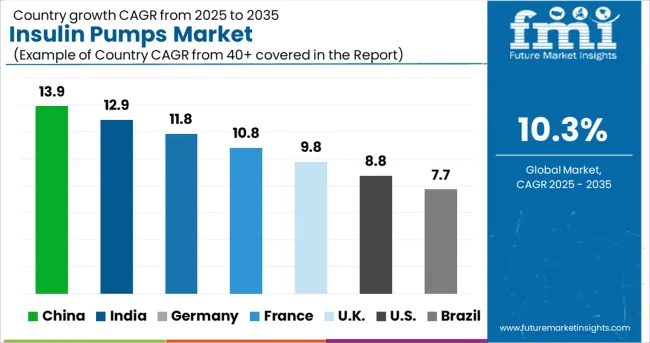
With over 14.8% and 13.1% projected growth rate in China and Japan respectively, Insulin Pump market revenue is expected to grow at fastest pace in Asia Pacific, during 2022 - 2032. Some of the key companies having manufacturing units in all major locations in APAC, have started to expanding their production units to different locations of APAC to increase fast distribution of their products. While this implies to a shift in diversification of global locations, it promises a significant opportunity for the Insulin Pump market.
Technology advancements, increased investment, improved reimbursement scenarios, and an increase in medical tourism are all aspects that are expected to drive market expansion. Furthermore, in the approaching years, the demand in Asia Pacific is predicted to be boosted by a growing aging population combined with an increasing burden of chronic diseases. According to a UNFPA report, the ageing population in the APAC is increasing at an unprecedented rate, and by 2050, one in every four persons in the region would be over 60 years old, bringing the total population to close to 1.3 billion.
Country-wise Analysis
U.S. Insulin Pumps Market Analysis
US dominated North America Insulin Pump market and poised to reach US$ 3.6 Bn by 2032. The growing number of hospital admission and ease of Medicare reimbursement policy favors market growth. The market in the U.S. is projected to garner an absolute dollar opportunity of US$ 2 Bn during 2022 – 2032.
U.K. Insulin Pumps Market Analysis
The market in the U.K. is expected to grow from US$ 269 Mn to reach a valuation of US$ 775 Mn, growing at a CAGR of 11.1% during 2022 – 2032. The market in the country is projected to garner an absolute dollar opportunity of US$ 506 Mn during 2022 – 2032.
Japan Insulin Pumps Market Analysis
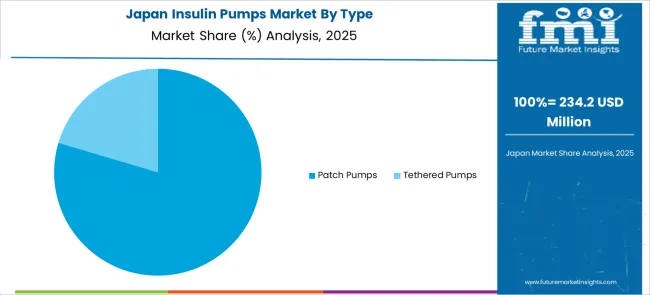
The market in Japan is likely to reach US$ 781 Mn by 2032, growing at a CAGR of 13% during 2022 – 2032. The market in the country is projected to garner an absolute dollar opportunity of US$ 553 Mn.

A unified Market Research Subscription Platform, built for today's disparate research needs.
Category-wise Insights
Which Insulin Pump Type capturing more demand?
In 2021, the tethered pumps category led the market, accounting for 78.5% of the total revenue. During the projection period, the category is predicted to grow at a CAGR of 13.4%. Flexible tubing connects the pump to the cannula in tethered pumps. The segment's enormous market size is mostly due to the dependability of these classic pumps and the variety of devices available on the market.
Competitive Analysis
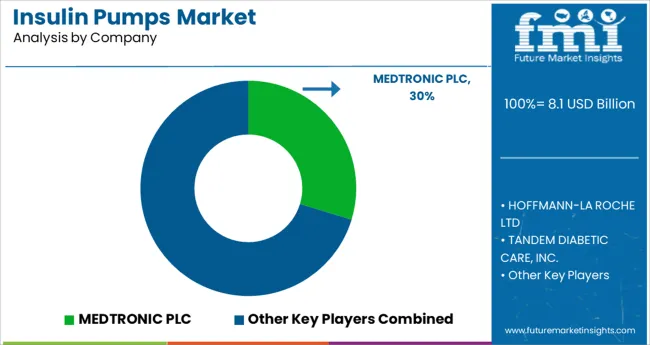
Over the projected period, rising emphasis on innovations and investments among public and private entities is expected to strengthen competition in the market. In addition, product commercialization and partnership tactics are expected to be profitable in the upcoming years.
The key vendors in the global Insulin Pump market are Cellenovo, Sooil Development, Valeritas, Inc, JingasuDelfu Co., Ltd., Medtronic plc, Hoffmann-La Roche Ltd, Tandem Diabetic Care, Inc., Insulet Corporation, and Ypsomed.
Some of the recent developments in Insulin Pump market are:
- In June 2019, Medtronic announced a partnership with Tidepool to develop an interoperable automated insulin pump system. The Medtronic MiniMed pump will serve as one of Tidepool Loop's accessories, designed to communicate with Apple devices.
- In September 2020, Insulet Corporation, stated that its Omnipod DASH Insulin Management System would be widely available in Israel, Switzerland, Austria, Germany, Belgium, and France in the coming weeks. Denmark, Norway, Finland, and Sweden have already exposure to this product.
- In June 2020, Tandem Diabetes Care and Abbott announced a collaboration to develop and commercialize integrated diabetes care solutions. These products will combine Abbott's continuous glucose monitoring technology with Tandem's ground-breaking insulin delivery devices to better diabetic blood sugar control.
- In September 2020, Medtronic announced that their MiniMedTM 770G hybrid closed loop system has received FDA clearance in the United States. This unique insulin administration system, which is equipped with the company's SmartGuard technology, and can be connected to a smartphone and can be modified for youngsters as young as two years old.
Market Segments Covered in Insulin Pump Industry Analysis
By Type:
- Patch Pumps
- Tethered Pumps
By Product Type:
- Tandem
- Accu-Chek
- MiniMed
- Omnipod
- My Life Omnipod
- Other Product Types
By Accessories:
- Insulin reservoir or cartridges
- Insulin set insertion devices
- Battery
By End-User:
- Homecare
- Hospitals & clinics
- Laboratories
By Region:
- North America
- Latin America
- Europe
- APAC
- MEA
Frequently Asked Questions
The global Insulin Pump market is worth more than US$ 5.5 Bn at present.
Value of Insulin Pump market are projected to increase at a CAGR of around 10.3% during 2022 – 2032.
The value of Insulin Pump market increased at a CAGR of around 9.6% during 2017 – 2021.
Top 5 countries driving demand for Insulin Pump market are the U.S., China, Germany, UK and Japan.
The value of Insulin Pump market are projected to increase at a CAGR of around 8.7% during 2022 – 2032 in North America.
The US market for Insulin Pump is projected to expand at a CAGR of around 8.5% during 2022 – 2032.
The major product is MiniMed (630G, 670G, and VEO) that will be accounted for a growth at 10.4% CAGR during forecast period.
The major companies are Medtronic plc, Hoffmann-La Roche Ltd, Tandem Diabetic Care, Inc., Insulet Corporation, and Ypsomed.
Table of Content
1. Executive Summary
1.1. Global Market Outlook
1.2. Summary of Statistics
1.3. Key Market Characteristics & Attributes
1.4. Analysis and Recommendations
2. Market Overview
2.1. Market Coverage
2.2. Market Definition
3. Market Risks and Trends Assessment
3.1. Risk Assessment
3.1.1. COVID-19 Crisis and Impact on Demand
3.1.2. COVID-19 Impact Benchmark with Previous Crisis
3.1.3. Impact on Market Value (US$ Mn)
3.1.4. Assessment by Key Countries
3.1.5. Assessment by Key Market Segments
3.1.6. Action Points and Recommendation for Suppliers
3.2. Key Trends Impacting the Market
3.3. Formulation and Product Development Trends
4. Market Background
4.1. Market, by Key Countries
4.2. Market Opportunity Assessment (US$ Mn)
4.2.1. Total Available Market
4.2.2. Serviceable Addressable Market
4.2.3. Serviceable Obtainable Market
4.3. Market Scenario Forecast
4.3.1. Demand in optimistic Scenario
4.3.2. Demand in Likely Scenario
4.3.3. Demand in Conservative Scenario
4.4. Investment Feasibility Analysis
4.4.1. Investment in Established Markets
4.4.1.1. In Short Term
4.4.1.2. In Long Term
4.4.2. Investment in Emerging Markets
4.4.2.1. In Short Term
4.4.2.2. In Long Term
4.5. Forecast Factors - Relevance & Impact
4.5.1. Top Companies Historical Growth
4.5.2. Growth in Automation, By Country
4.5.3. Adoption Rate, By Country
4.6. Market Dynamics
4.6.1. Market Driving Factors and Impact Assessment
4.6.2. Prominent Market Challenges and Impact Assessment
4.6.3. Market Opportunities
4.6.4. Prominent Trends in the Global Market & Their Impact Assessment
5. Key Success Factors
5.1. Manufacturers’ Focus on Low Penetration High Growth Markets
5.2. Banking on with Segments High Incremental Opportunity
5.3. Peer Benchmarking
6. Global Market Demand Analysis 2017-2021 and Forecast, 2022-2032
6.1. Historical Market Analysis, 2017-2021
6.2. Current and Future Market Projections, 2022-2032
6.3. Y-o-Y Growth Trend Analysis
7. Global Market Value Analysis 2017-2021 and Forecast, 2022-2032
7.1. Historical Market Value (US$ Mn) Analysis, 2017-2021
7.2. Current and Future Market Value (US$ Mn) Projections, 2022-2032
7.2.1. Y-o-Y Growth Trend Analysis
7.2.2. Absolute $ Opportunity Analysis
8. Global Market Analysis 2017-2021 and Forecast 2022-2032, By Type
8.1. Introduction / Key Findings
8.2. Historical Market Size (US$ Mn) Analysis By Type, 2017-2021
8.3. Current and Future Market Size (US$ Mn) Analysis and Forecast By Type, 2022-2032
8.3.1. Patch Pumps
8.3.2. Tethered Pumps
8.4. Market Attractiveness Analysis By Type
9. Global Market Analysis 2017-2021 and Forecast 2022-2032, By Product Type
9.1. Introduction / Key Findings
9.2. Historical Market Size (US$ Mn) Analysis By Product Type, 2017-2021
9.3. Current and Future Market Size (US$ Mn) Analysis and Forecast By Product Type, 2022-2032
9.3.1. Tandem (T: slim X2, G4, T: flex Delivery System)
9.3.2. Accu-Chek (Combo, Insight, and Solo)
9.3.3. MiniMed (630G, 670G, and VEO)
9.3.4. Omnipod
9.3.5. My Life Omnipod
9.3.6. Other Product Types
9.4. Market Attractiveness Analysis By Product Type
10. Global Market Analysis 2017-2021 and Forecast 2022-2032, By Accessories
10.1. Introduction / Key Findings
10.2. Historical Market Size (US$ Mn) Analysis By Accessories, 2017-2021
10.3. Current and Future Market Size (US$ Mn) Analysis and Forecast By Accessories, 2022-2032
10.3.1. Insulin reservoir or cartridges
10.3.2. Insulin set insertion devices
10.3.3. Battery
10.4. Market Attractiveness Analysis By Accessories
11. Global Market Analysis 2017-2021 and Forecast 2022-2032, By End-User
11.1. Introduction / Key Findings
11.2. Historical Market Size (US$ Mn) Analysis By End-User, 2017-2021
11.3. Current and Future Market Size (US$ Mn) Analysis and Forecast By End-User, 2022-2032
11.3.1. Homecare
11.3.2. Hospitals & clinics
11.3.3. Laboratories
11.4. Market Attractiveness Analysis By End-User
12. Global Market Analysis 2017-2021 and Forecast 2022-2032, By Region
12.1. Introduction
12.2. Historical Market Size (US$ Mn) Analysis By Region, 2017-2021
12.3. Current Market Size (US$ Mn) & Analysis and Forecast By Region, 2022-2032
12.3.1. North America
12.3.2. Latin America
12.3.3. Europe
12.3.4. Asia Pacific
12.3.5. Middle East and Africa (MEA)
12.4. Market Attractiveness Analysis By Region
13. North America Market Analysis 2017-2021 and Forecast 2022-2032
13.1. Introduction
13.2. Pricing Analysis
13.3. Historical Market Value (US$ Mn) Trend Analysis By Market Taxonomy, 2017-2021
13.4. Market Value (US$ Mn) & Forecast By Market Taxonomy, 2022-2032
13.4.1. By Country
13.4.1.1. U.S.
13.4.1.2. Canada
13.4.1.3. Rest of North America
13.4.2. By Type
13.4.3. By Product Type
13.4.4. By End-User
13.4.5. By Accessories
13.5. Market Attractiveness Analysis
13.5.1. By Country
13.5.2. By Type
13.5.3. By Product Type
13.5.4. By End-User
13.5.5. By Accessories
14. Latin America Market Analysis 2017-2021 and Forecast 2022-2032
14.1. Introduction
14.2. Pricing Analysis
14.3. Historical Market Value (US$ Mn) Trend Analysis By Market Taxonomy, 2017-2021
14.4. Market Value (US$ Mn) & Forecast By Market Taxonomy, 2022-2032
14.4.1. By Country
14.4.1.1. Brazil
14.4.1.2. Mexico
14.4.1.3. Rest of Latin America
14.4.2. By Type
14.4.3. By Product Type
14.4.4. By End-User
14.4.5. By Accessories
14.5. Market Attractiveness Analysis
14.5.1. By Country
14.5.2. By Type
14.5.3. By Product Type
14.5.4. By End-User
14.5.5. By Accessories
15. Europe Market Analysis 2017-2021 and Forecast 2022-2032
15.1. Introduction
15.2. Pricing Analysis
15.3. Historical Market Value (US$ Mn) Trend Analysis By Market Taxonomy, 2017-2021
15.4. Market Value (US$ Mn) & Forecast By Market Taxonomy, 2022-2032
15.4.1. By Country
15.4.1.1. Germany
15.4.1.2. France
15.4.1.3. U.K.
15.4.1.4. Italy
15.4.1.5. Benelux
15.4.1.6. Nordic Countries
15.4.1.7. Rest of Europe
15.4.2. By Type
15.4.3. By Product Type
15.4.4. By End-User
15.4.5. By Accessories
15.5. Market Attractiveness Analysis
15.5.1. By Country
15.5.2. By Type
15.5.3. By Product Type
15.5.4. By End-User
15.5.5. By Accessories
16. Asia Pacific Market Analysis 2017-2021 and Forecast 2022-2032
16.1. Introduction
16.2. Pricing Analysis
16.3. Historical Market Value (US$ Mn) Trend Analysis By Market Taxonomy, 2017-2021
16.4. Market Value (US$ Mn) & Forecast By Market Taxonomy, 2022-2032
16.4.1. By Country
16.4.1.1. China
16.4.1.2. Japan
16.4.1.3. South Korea
16.4.1.4. Rest of Asia Pacific
16.4.2. By Type
16.4.3. By Product Type
16.4.4. By End-User
16.4.5. By Accessories
16.5. Market Attractiveness Analysis
16.5.1. By Country
16.5.2. By Type
16.5.3. By Product Type
16.5.4. By End-User
16.5.5. By Accessories
17. Middle East and Africa Market Analysis 2017-2021 and Forecast 2022-2032
17.1. Introduction
17.2. Pricing Analysis
17.3. Historical Market Value (US$ Mn) Trend Analysis By Market Taxonomy, 2017-2021
17.4. Market Value (US$ Mn) & Forecast By Market Taxonomy, 2022-2032
17.4.1. By Country
17.4.1.1. GCC Countries
17.4.1.2. South Africa
17.4.1.3. Turkey
17.4.1.4. Rest of Middle East and Africa
17.4.2. By Type
17.4.3. By Product Type
17.4.4. By End-User
17.4.5. By Accessories
17.5. Market Attractiveness Analysis
17.5.1. By Country
17.5.2. By Type
17.5.3. By Product Type
17.5.4. By End-User
17.5.5. By Accessories
18. Key Countries Market Analysis 2017-2021 and Forecast 2022-2032
18.1. Introduction
18.1.1. Market Value Proportion Analysis, By Key Countries
18.1.2. Global Vs. Country Growth Comparison
18.2. US Market Analysis
18.2.1. Value Proportion Analysis by Market Taxonomy
18.2.2. Value Analysis and Forecast by Market Taxonomy, 2017-2032
18.2.2.1. By Type
18.2.2.2. By Product Type
18.2.2.3. By End-User
18.2.2.4. By Accessories
18.3. Canada Market Analysis
18.3.1. Value Proportion Analysis by Market Taxonomy
18.3.2. Value Analysis and Forecast by Market Taxonomy, 2017-2032
18.3.2.1. By Type
18.3.2.2. By Product Type
18.3.2.3. By End-User
18.3.2.4. By Accessories
18.4. Mexico Market Analysis
18.4.1. Value Proportion Analysis by Market Taxonomy
18.4.2. Value Analysis and Forecast by Market Taxonomy, 2017-2032
18.4.2.1. By Type
18.4.2.2. By Product Type
18.4.2.3. By End-User
18.4.2.4. By Accessories
18.5. Brazil Market Analysis
18.5.1. Value Proportion Analysis by Market Taxonomy
18.5.2. Value Analysis and Forecast by Market Taxonomy, 2017-2032
18.5.2.1. By Type
18.5.2.2. By Product Type
18.5.2.3. By End-User
18.5.2.4. By Accessories
18.6. Germany Market Analysis
18.6.1. Value Proportion Analysis by Market Taxonomy
18.6.2. Value Analysis and Forecast by Market Taxonomy, 2017-2032
18.6.2.1. By Type
18.6.2.2. By Product Type
18.6.2.3. By End-User
18.6.2.4. By Accessories
18.7. France Market Analysis
18.7.1. Value Proportion Analysis by Market Taxonomy
18.7.2. Value Analysis and Forecast by Market Taxonomy, 2017-2032
18.7.2.1. By Type
18.7.2.2. By Product Type
18.7.2.3. By End-User
18.7.2.4. By Accessories
18.8. Italy Market Analysis
18.8.1. Value Proportion Analysis by Market Taxonomy
18.8.2. Value Analysis and Forecast by Market Taxonomy, 2017-2032
18.8.2.1. By Type
18.8.2.2. By Product Type
18.8.2.3. By End-User
18.8.2.4. By Accessories
18.9. BENELUX Market Analysis
18.9.1. Value Proportion Analysis by Market Taxonomy
18.9.2. Value Analysis and Forecast by Market Taxonomy, 2017-2032
18.9.2.1. By Type
18.9.2.2. By Product Type
18.9.2.3. By End-User
18.9.2.4. By Accessories
18.10. UK Market Analysis
18.10.1. Value Proportion Analysis by Market Taxonomy
18.10.2. Value Analysis and Forecast by Market Taxonomy, 2017-2032
18.10.2.1. By Type
18.10.2.2. By Product Type
18.10.2.3. By End-User
18.10.2.4. By Accessories
18.11. Nordic Countries Market Analysis
18.11.1. Value Proportion Analysis by Market Taxonomy
18.11.2. Value Analysis and Forecast by Market Taxonomy, 2017-2032
18.11.2.1. By Type
18.11.2.2. By Product Type
18.11.2.3. By End-User
18.11.2.4. By Accessories
18.12. China Market Analysis
18.12.1. Value Proportion Analysis by Market Taxonomy
18.12.2. Value Analysis and Forecast by Market Taxonomy, 2017-2032
18.12.2.1. By Type
18.12.2.2. By Product Type
18.12.2.3. By End-User
18.12.2.4. By Accessories
18.13. Japan Market Analysis
18.13.1. Value Proportion Analysis by Market Taxonomy
18.13.2. Value Analysis and Forecast by Market Taxonomy, 2017-2032
18.13.2.1. By Type
18.13.2.2. By Product Type
18.13.2.3. By End-User
18.13.2.4. By Accessories
18.14. South Korea Market Analysis
18.14.1. Value Proportion Analysis by Market Taxonomy
18.14.2. Value Analysis and Forecast by Market Taxonomy, 2017-2032
18.14.2.1. By Type
18.14.2.2. By Product Type
18.14.2.3. By End-User
18.14.2.4. By Accessories
18.15. GCC Countries Market Analysis
18.15.1. Value Proportion Analysis by Market Taxonomy
18.15.2. Value Analysis and Forecast by Market Taxonomy, 2017-2032
18.15.2.1. By Type
18.15.2.2. By Product Type
18.15.2.3. By End-User
18.15.2.4. By Accessories
18.16. South Africa Market Analysis
18.16.1. Value Proportion Analysis by Market Taxonomy
18.16.2. Value Analysis and Forecast by Market Taxonomy, 2017-2032
18.16.2.1. By Type
18.16.2.2. By Product Type
18.16.2.3. By End-User
18.16.2.4. By Accessories
18.17. Turkey Market Analysis
18.17.1. Value Proportion Analysis by Market Taxonomy
18.17.2. Value Analysis and Forecast by Market Taxonomy, 2017-2032
18.17.2.1. By Type
18.17.2.2. By Product Type
18.17.2.3. By End-User
18.17.2.4. By Accessories
18.17.3. Competition Landscape and Player Concentration in the Country
19. Market Structure Analysis
19.1. Market Analysis by Tier of Companies
19.2. Market Concentration
19.3. Market Share Analysis of Top Players
19.4. Market Presence Analysis
19.4.1. By Regional footprint of Players
19.4.2. Product footprint by Players
20. Competition Analysis
20.1. Competition Dashboard
20.2. Competition Benchmarking
20.3. Competition Deep Dive
20.3.1. MEDTRONIC PLC
20.3.1.1. Overview
20.3.1.2. Product Portfolio
20.3.1.3. Sales Footprint
20.3.1.4. Strategy Overview
20.3.2. HOFFMANN-LA ROCHE LTD
20.3.2.1. Overview
20.3.2.2. Product Portfolio
20.3.2.3. Sales Footprint
20.3.2.4. Strategy Overview
20.3.3. TANDEM DIABETIC CARE, INC.
20.3.3.1. Overview
20.3.3.2. Product Portfolio
20.3.3.3. Sales Footprint
20.3.3.4. Strategy Overview
20.3.4. INSULET CORPORATION
20.3.4.1. Overview
20.3.4.2. Product Portfolio
20.3.4.3. Sales Footprint
20.3.4.4. Strategy Overview
20.3.5. YPSOMED
20.3.5.1. Overview
20.3.5.2. Product Portfolio
20.3.5.3. Sales Footprint
20.3.5.4. Strategy Overview
20.3.6. SOOIL DEVELOPMENT
20.3.6.1. Overview
20.3.6.2. Product Portfolio
20.3.6.3. Sales Footprint
20.3.6.4. Strategy Overview
20.3.7. VALERITAS, INC
20.3.7.1. Overview
20.3.7.2. Product Portfolio
20.3.7.3. Sales Footprint
20.3.7.4. Strategy Overview
20.3.8. JINGASUDELFU CO., LTD.
20.3.8.1. Overview
20.3.8.2. Product Portfolio
20.3.8.3. Sales Footprint
20.3.8.4. Strategy Overview
21. Assumptions and Acronyms Used
22. Research Methodology
Let us know your requirement to get
100% FREE customization
List of Tables
Table 1: Global Market Value (US$ Mn),By Type, 2017 – 2021
Table 2: Global Market Value (US$ Mn),By Type, 2022 – 2032
Table 3: Global Market Value (US$ Mn), By Product Type, 2017 – 2021
Table 4: Global Market Value (US$ Mn), By Product Type, 2022 – 2032
Table 5: Global Market Value (US$ Mn), By Accessories, 2017 – 2021
Table 6: Global Market Value (US$ Mn), By Accessories, 2022 – 2032
Table 7: Global Market Value (US$ Mn), By End-User, 2017 – 2021
Table 8: Global Market Value (US$ Mn), By End-User, 2022 – 2032
Table 9: Global Market, By Region, 2017 – 2021
Table 10: Global Market, By Region, 2022 – 2032
Table 11: North America Market Value (US$ Mn),By Type, 2017 – 2021
Table 12: North America Market Value (US$ Mn),By Type, 2022 – 2032
Table 13: North America Market Value (US$ Mn), By Product Type, 2017 – 2021
Table 14: North America Market Value (US$ Mn), By Product Type, 2022 – 2032
Table 15: North America Market Value (US$ Mn), By Accessories, 2017 – 2021
Table 16: North America Market Value (US$ Mn), By Accessories, 2022 – 2032
Table 17: North America Market Value (US$ Mn), By End-User, 2017 – 2021
Table 18: North America Market Value (US$ Mn), By End-User, 2022 – 2032
Table 19: North America Market, By Country, 2017 – 2021
Table 20: North America Market, By Country, 2022 – 2032
Table 21: Latin America Market Value (US$ Mn),By Type, 2017 – 2021
Table 22: Latin America Market Value (US$ Mn),By Type, 2022 – 2032
Table 23: Latin America Market Value (US$ Mn), By Product Type, 2017 – 2021
Table 24: Latin America Market Value (US$ Mn), By Product Type, 2022 – 2032
Table 25: Latin America Market Value (US$ Mn), By Accessories, 2017 – 2021
Table 26: Latin America Market Value (US$ Mn), By Accessories, 2022 – 2032
Table 27: Latin America Market Value (US$ Mn), By End-User, 2017 – 2021
Table 28: Latin America Market Value (US$ Mn), By End-User, 2022 – 2032
Table 29: Latin America Market, By Country, 2017 – 2021
Table 30: Latin America Market, By Country, 2022 – 2032
Table 31: Europe Market Value (US$ Mn),By Type, 2017 – 2021
Table 32: Europe Market Value (US$ Mn),By Type, 2022 – 2032
Table 33: Europe Market Value (US$ Mn), By Product Type, 2017 – 2021
Table 34: Europe Market Value (US$ Mn), By Product Type, 2022 – 2032
Table 35: Europe Market Value (US$ Mn), By Accessories, 2017 – 2021
Table 36: Europe Market Value (US$ Mn), By Accessories, 2022 – 2032
Table 37: Europe Market Value (US$ Mn), By End-User, 2017 – 2021
Table 38: Europe Market Value (US$ Mn), By End-User, 2022 – 2032
Table 39: Europe Market, By Country, 2017 – 2021
Table 40: Europe Market, By Country, 2022 – 2032
Table 41: Asia Pacific Market Value (US$ Mn),By Type, 2017 – 2021
Table 42: Asia Pacific Market Value (US$ Mn),By Type, 2022 – 2032
Table 43: Asia Pacific Market Value (US$ Mn), By Product Type, 2017 – 2021
Table 44: Asia Pacific Market Value (US$ Mn), By Product Type, 2022 – 2032
Table 45: Asia Pacific Market Value (US$ Mn), By Accessories, 2017 – 2021
Table 46: Asia Pacific Market Value (US$ Mn), By Accessories, 2022 – 2032
Table 47: Asia Pacific Market Value (US$ Mn), By End-User, 2017 – 2021
Table 48: Asia Pacific Market Value (US$ Mn), By End-User, 2022 – 2032
Table 49: Asia Pacific Market, By Country, 2017 – 2021
Table 50: Asia Pacific Market, By Country, 2022 – 2032
Table 51: MEA Market Value (US$ Mn),By Type, 2017 – 2021
Table 52: MEA Market Value (US$ Mn),By Type, 2022 – 2032
Table 53: MEA Market Value (US$ Mn), By Product Type, 2017 – 2021
Table 54: MEA Market Value (US$ Mn), By Product Type, 2022 – 2032
Table 55: MEA Market Value (US$ Mn), By Accessories, 2017 – 2021
Table 56: MEA Market Value (US$ Mn), By Accessories, 2022 – 2032
Table 57: MEA Market Value (US$ Mn), By End-User, 2017 – 2021
Table 58: MEA Market Value (US$ Mn), By End-User, 2022 – 2032
Table 59: MEA Market, By Country, 2017 – 2021
Table 60: MEA Market, By Country, 2022 – 2032
Find your sweet spots for generating winning opportunities in this market.
Talk to AnalystList of Charts
Figure 1: Global Market Value (US$ Mn) and Year-on-Year Growth, 2017-2032
Figure 2: Global Market Absolute $ Historical Gain (2017 - 2021) and Opportunity (2022 – 2032), US$ Mn
Figure 3: Global Market Share, By Type, 2022 & 2032
Figure 4: Global Market Y-o-Y Growth Projections, By Type – 2022-2032
Figure 5: Global Market Attractiveness Index, By Type – 2022-2032
Figure 6: Global Market Share, By Product Type, 2022 & 2032
Figure 7: Global Market Y-o-Y Growth Projections, By Product Type – 2022-2032
Figure 8: Global Market Attractiveness Index, By Product Type – 2022-2032
Figure 9: Global Market Share, By End-User, 2022 & 2032
Figure 10: Global Market Y-o-Y Growth Projections, By End-User – 2022-2032
Figure 11: Global Market Attractiveness Index, By End-User – 2022-2032
Figure 12: Global Market Share, By Accessories, 2022 & 2032
Figure 13: Global Market Y-o-Y Growth Projections, By Accessories – 2022-2032
Figure 14: Global Market Attractiveness Index, By Accessories – 2022-2032
Figure 15: Global Market Share, By Region, 2022 & 2032
Figure 16: Global Market Y-o-Y Growth Projections, By Region – 2022-2032
Figure 17: Global Market Attractiveness Index, By Region – 2022-2032
Figure 18: North America Market Value (US$ Mn) and Year-on-Year Growth, 2017-2032
Figure 19: North America Market Absolute $ Opportunity Historical (2017 - 2021) and Forecast Period (2022 – 2032), US$ Mn
Figure 20: North America Market Share, By Type, 2022 & 2032
Figure 21: North America Market Y-o-Y Growth Projections, By Type – 2022-2032
Figure 22: North America Market Attractiveness Index, By Type – 2022-2032
Figure 23: North America Market Share, By Product Type, 2022 & 2032
Figure 24: North America Market Y-o-Y Growth Projections, By Product Type – 2022-2032
Figure 25: North America Market Attractiveness Index, By Product Type – 2022-2032
Figure 26: North America Market Share, By End-User, 2022 & 2032
Figure 27: North America Market Y-o-Y Growth Projections, By End-User – 2022-2032
Figure 28: North America Market Attractiveness Index, By End-User – 2022-2032
Figure 29: North America Market Share, By Accessories, 2022 & 2032
Figure 30: North America Market Y-o-Y Growth Projections, By Accessories – 2022-2032
Figure 31: North America Market Attractiveness Index, By Accessories – 2022-2032
Figure 32: North America Market Share, By Country, 2022 & 2032
Figure 33: North America Market Y-o-Y Growth Projections, By Country – 2022-2032
Figure 34: North America Market Attractiveness Index, By Country – 2022-2032
Figure 35: Latin America Market Value (US$ Mn) and Year-on-Year Growth, 2017-2032
Figure 36: Latin America Market Absolute $ Opportunity Historical (2017 - 2021) and Forecast Period (2022 – 2032), US$ Mn
Figure 37: Latin America Market Share, By Type, 2022 & 2032
Figure 38: Latin America Market Y-o-Y Growth Projections, By Type – 2022-2032
Figure 39: Latin America Market Attractiveness Index, By Type – 2022-2032
Figure 40: Latin America Market Share, By Product Type, 2022 & 2032
Figure 41: Latin America Market Y-o-Y Growth Projections, By Product Type – 2022-2032
Figure 42: Latin America Market Attractiveness Index, By Product Type – 2022-2032
Figure 43: Latin America Market Share, By End-User, 2022 & 2032
Figure 44: Latin America Market Y-o-Y Growth Projections, By End-User – 2022-2032
Figure 45: Latin America Market Attractiveness Index, By End-User – 2022-2032
Figure 46: Latin America Market Share, By Accessories, 2022 & 2032
Figure 47: Latin America Market Y-o-Y Growth Projections, By Accessories – 2022-2032
Figure 48: Latin America Market Attractiveness Index, By Accessories – 2022-2032
Figure 49: Latin America Market Share, By Country, 2022 & 2032
Figure 50: Latin America Market Y-o-Y Growth Projections, By Country – 2022-2032
Figure 51: Latin America Market Attractiveness Index, By Country – 2022-2032
Figure 52: Europe Market Value (US$ Mn) and Year-on-Year Growth, 2017-2032
Figure 53: Europe Market Absolute $ Opportunity Historical (2017 - 2021) and Forecast Period (2022 – 2032), US$ Mn
Figure 54: Europe Market Share, By Type, 2022 & 2032
Figure 55: Europe Market Y-o-Y Growth Projections, By Type – 2022-2032
Figure 56: Europe Market Attractiveness Index, By Type – 2022-2032
Figure 57: Europe Market Share, By Product Type, 2022 & 2032
Figure 58: Europe Market Y-o-Y Growth Projections, By Product Type – 2022-2032
Figure 59: Europe Market Attractiveness Index, By Product Type – 2022-2032
Figure 60: Europe Market Share, By End-User, 2022 & 2032
Figure 61: Europe Market Y-o-Y Growth Projections, By End-User – 2022-2032
Figure 62: Europe Market Attractiveness Index, By End-User – 2022-2032
Figure 63: Europe Market Share, By Accessories, 2022 & 2032
Figure 64: Europe Market Y-o-Y Growth Projections, By Accessories – 2022-2032
Figure 65: Europe Market Attractiveness Index, By Accessories – 2022-2032
Figure 66: Europe Market Share, By Country, 2022 & 2032
Figure 67: Europe Market Y-o-Y Growth Projections, By Country – 2022-2032
Figure 68: Europe Market Attractiveness Index, By Country – 2022-2032
Figure 69: MEA Market Value (US$ Mn) and Year-on-Year Growth, 2017-2032
Figure 70: MEA Market Absolute $ Opportunity Historical (2017 - 2021) and Forecast Period (2022 – 2032), US$ Mn
Figure 71: MEA Market Share, By Type, 2022 & 2032
Figure 72: MEA Market Y-o-Y Growth Projections, By Type – 2022-2032
Figure 73: MEA Market Attractiveness Index, By Type – 2022-2032
Figure 74: MEA Market Share, By Product Type, 2022 & 2032
Figure 75: MEA Market Y-o-Y Growth Projections, By Product Type – 2022-2032
Figure 76: MEA Market Attractiveness Index, By Product Type – 2022-2032
Figure 77: MEA Market Share, By End-User, 2022 & 2032
Figure 78: MEA Market Y-o-Y Growth Projections, By End-User – 2022-2032
Figure 79: MEA Market Attractiveness Index, By End-User – 2022-2032
Figure 80: MEA Market Share, By Accessories, 2022 & 2032
Figure 81: MEA Market Y-o-Y Growth Projections, By Accessories – 2022-2032
Figure 82: MEA Market Attractiveness Index, By Accessories – 2022-2032
Figure 83: MEA Market Share, By Country, 2022 & 2032
Figure 84: MEA Market Y-o-Y Growth Projections, By Country – 2022-2032
Figure 85: MEA Market Attractiveness Index, By Country – 2022-2032
Figure 86: Asia Pacific Market Value (US$ Mn) and Year-on-Year Growth, 2017-2032
Figure 87: Asia Pacific Market Absolute $ Opportunity Historical (2017 - 2021) and Forecast Period (2022 – 2032), US$ Mn
Figure 88: Asia Pacific Market Share, By Type, 2022 & 2032
Figure 89: Asia Pacific Market Y-o-Y Growth Projections, By Type – 2022-2032
Figure 90: Asia Pacific Market Attractiveness Index, By Type – 2022-2032
Figure 91: Asia Pacific Market Share, By Product Type, 2022 & 2032
Figure 92: Asia Pacific Market Y-o-Y Growth Projections, By Product Type – 2022-2032
Figure 93: Asia Pacific Market Attractiveness Index, By Product Type – 2022-2032
Figure 94: Asia Pacific Market Share, By End-User, 2022 & 2032
Figure 95: Asia Pacific Market Y-o-Y Growth Projections, By End-User – 2022-2032
Figure 96: Asia Pacific Market Attractiveness Index, By End-User – 2022-2032
Figure 97: Asia Pacific Market Share, By Accessories, 2022 & 2032
Figure 98: Asia Pacific Market Y-o-Y Growth Projections, By Accessories – 2022-2032
Figure 99: Asia Pacific Market Attractiveness Index, By Accessories – 2022-2032
Figure 100: Asia Pacific Market Share, By Country, 2022 & 2032
Figure 101: Asia Pacific Market Y-o-Y Growth Projections, By Country – 2022-2032
Figure 102: Asia Pacific Market Attractiveness Index, By Country – 2022-2032
Need specific information?
Request CustomizationExplore Healthcare Insights
View Reports