The CIS Insulin Market is estimated to be valued at USD 506.2 million in 2025 and is projected to reach USD 660.7 million by 2035, registering a compound annual growth rate (CAGR) of 2.7% over the forecast period.
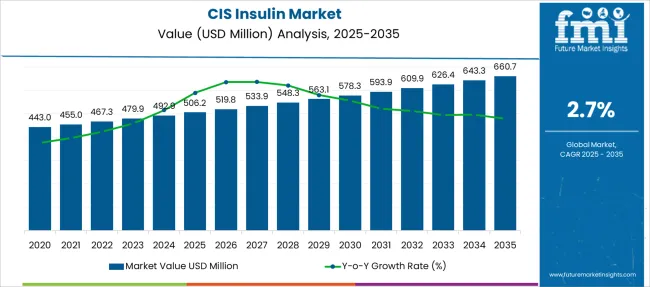
| Metric | Value |
|---|---|
| CIS Insulin Market Estimated Value in (2025 E) | USD 506.2 million |
| CIS Insulin Market Forecast Value in (2035 F) | USD 660.7 million |
| Forecast CAGR (2025 to 2035) | 2.7% |
The CIS insulin market is expanding steadily, driven by the growing prevalence of diabetes and increasing adoption of advanced insulin therapies. Advances in biotechnology have enabled the development of rapid acting CIS insulin formulations that better mimic natural insulin response, improving blood sugar control for patients.
Healthcare systems have increased focus on managing Type II diabetes due to its rising incidence globally, supporting the demand for specialized CIS insulin treatments. Moreover, patient awareness and healthcare provider adoption of human recombinant CIS insulin have improved treatment accessibility and outcomes.
The integration of these therapies into diabetes care protocols is enhancing glycemic management and reducing complications. Future growth is expected to be supported by ongoing innovation in insulin delivery methods and increasing government initiatives promoting diabetes care. Segmental growth is expected to be driven by rapid acting CIS insulin as the leading product type, CIS insulin applications targeting Type II diabetes, and human recombinant CIS insulin as the predominant source.
The market is segmented by Product Type, Application, and Source and region. By Product Type, the market is divided into Rapid Acting CIS Insulin, Long Acting CIS Insulin, Premixed CIS Insulin, Premixed Analog CIS Insulin, Short-Acting CIS Insulin, and Intermediate-Acting CIS Insulin. In terms of Application, the market is classified into CIS Insulin for treating Type II Diabetes and CIS Insulin for treating Type I and Other Diabetes. Based on Source, the market is segmented into Human Recombinant CIS Insulin and Analogs-based CIS Insulin. Regionally, the market is classified into North America, Latin America, Western Europe, Eastern Europe, Balkan & Baltic Countries, Russia & Belarus, Central Asia, East Asia, South Asia & Pacific, and the Middle East & Africa.
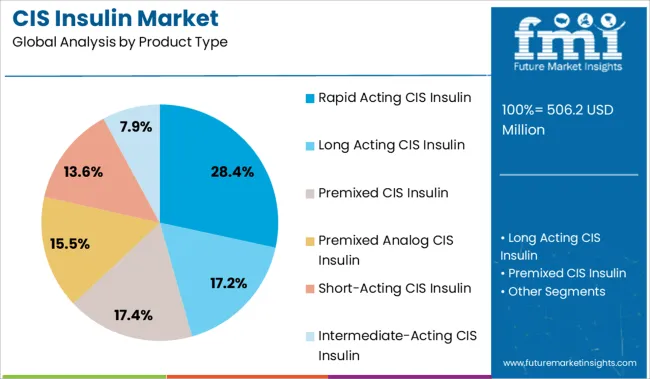
The rapid acting CIS insulin segment is projected to account for 28.4% of the market revenue in 2025, maintaining its leading position among product types. This segment has gained traction due to its ability to rapidly lower blood glucose levels, closely simulating the body's natural insulin release after meals. The faster onset and shorter duration of action improve postprandial glucose control, reducing the risk of hyperglycemia.
Healthcare providers have preferred rapid acting CIS insulin in intensive insulin therapy regimens and for patients requiring flexible dosing schedules. The segment benefits from improved patient adherence due to convenience and reduced side effects compared to traditional insulins.
Continuous innovation in formulation and delivery devices is expected to sustain the growth of rapid acting CIS insulin.
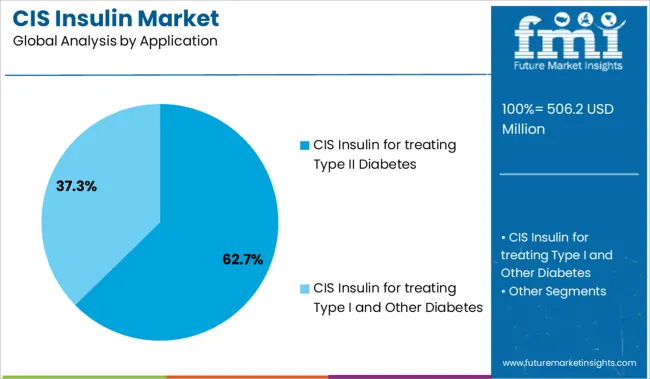
The CIS insulin application segment for treating Type II diabetes is expected to hold 62.7% of the market revenue in 2025, dominating the application landscape. This growth reflects the increasing number of Type II diabetes patients requiring insulin therapy as the disease progresses. Clinicians have incorporated CIS insulin treatments into care plans to enhance glycemic control in patients who do not respond adequately to oral hypoglycemic agents.
The preference for CIS insulin in this segment is supported by its efficacy, safety profile, and ability to reduce long-term complications associated with poor glucose control. Public health efforts focusing on diabetes management and early intervention have also contributed to the expanding use of CIS insulin in this patient group.
As the prevalence of Type II diabetes rises globally, the application of CIS insulin in this category is anticipated to maintain strong growth.
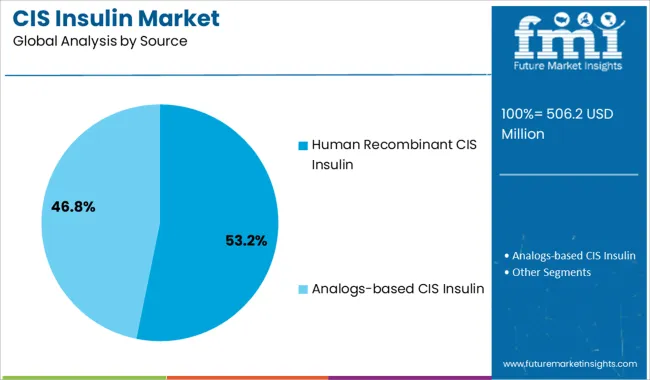
The human recombinant CIS insulin segment is projected to contribute 53.2% of the market revenue in 2025, retaining its position as the dominant insulin source. The preference for human recombinant insulin arises from its close structural similarity to endogenous insulin, resulting in better tolerability and reduced immunogenicity. Advances in recombinant DNA technology have improved production efficiency and purity, making these insulins more widely available and affordable.
Healthcare providers have favored human recombinant CIS insulin due to its predictable pharmacokinetics and proven clinical efficacy. Additionally, patient outcomes have improved with reduced incidence of allergic reactions and injection site complications.
The segment continues to benefit from investments in biotechnological manufacturing and regulatory approvals. As recombinant insulin remains a standard in diabetes management, this segment is expected to maintain its market leadership.
Increased spending on healthcare and advancements in healthcare infrastructure will continue to hold a positive influence on CIS insulin market growth
As per Future Market Insights, the global demand for the CIS Insulin market is anticipated to grow at a CAGR of 2.7% during the forecast period between 2025 and 2035, in comparison to a 2.2% CAGR registered from 2020 to 2024.
Growth in the CIS insulin market is driven by it the increasing prevalence of diabetes patients and changing lifestyles and eating habits resulting in health disorders such as obesity and other metabolic diseases, surging investments in R&D, innovations in insulin products, and a rise in CIS insulin applications for type I and type II diabetes.
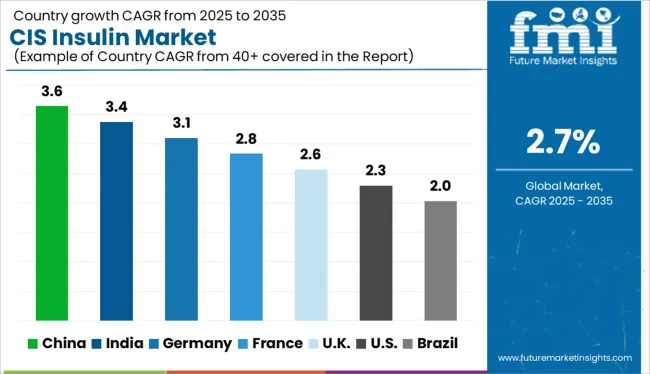
Similarly, increasing government initiatives and investments to provide for high-quality diagnosis, particularly across developed nations like the United States, United Kingdom, and China will expand the CIS insulin market size during the forthcoming years.
According to the World Health Organization, about 422 million people worldwide have diabetes, the majority living in low-and middle-income countries, and 1.5 million deaths are directly attributed to diabetes each year. Both the number of cases and the prevalence of diabetes have been steadily increasing over the past few decades.
Despite optimistic growth projection, the global CIS insulin market is facing various obstacles that are restraining its growth to some extent. Some of these factors include the adverse effect of insulin therapy like hypoglycemia and pain at the site of injection may impact the use among some individuals.
Also, other disadvantages such as weight gain, electrolyte imbalance, and, in rare cases, peripheral hyperinsulinemia, decreased compliance, and high nocturnal glucose levels also lower the growth of the CIS insulin market. Increasing incidence of insulin resistance, particularly among obese individuals may restrain the growth of the market.
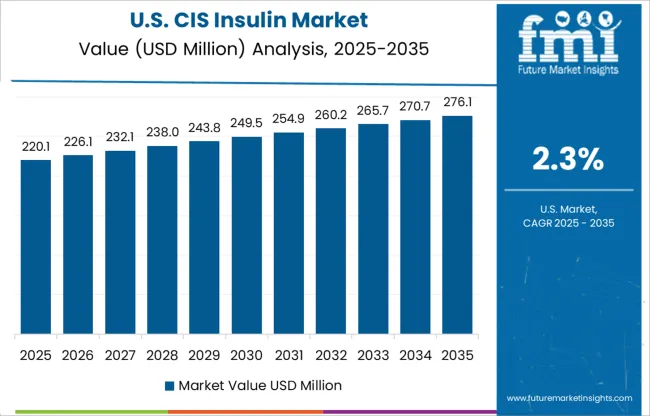
Initiatives to curb diabetes to drive the CIS Insulin Market in the USA
Over the years, CIS insulin sales have risen at a substantial pace across USA and the trend is likely to continue even during the forecast period, owing to the rapid surge in the number of diabetic people, due to the rising healthcare spending, favorable government initiatives, and presence of large number of CIS Insulin market players in the region.
North America is anticipated to lead the global CIS insulin market during the forecast period, with the USA expected to lead across the region. As per Future Market Insights, the market in the USA is likely to garner USD 506.2 Million while exhibiting a CAGR of 4.6% from 2025 to 2035.
North America is expected to hold a large share in the global CIS insulin market due to the presence of leading technological advancements in the healthcare sector and increasing expenditure on healthcare by governments. Similarly, with an increase in the number of hospitals and healthcare facilities with the advancements in technology, many new products are being introduced in the global CIS insulin market will boost sales to new heights.
For instance, Novo Nordisk launched its smart insulin pen which comes with inbuilt Bluetooth. The smart pen can record the dose of insulin and maintain timely logs. The best part about this pen is that it does not pain that much when compared to normal insulin pens.
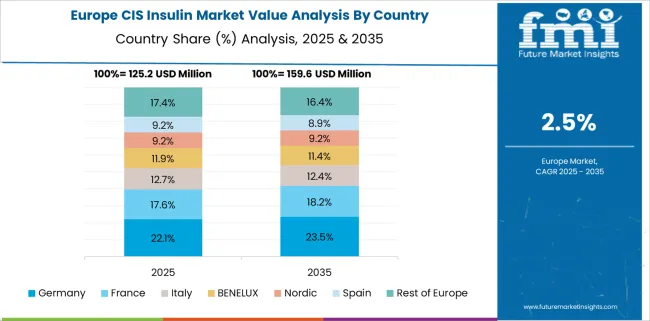
Rapid technological advances in healthcare to boost the growth of the CIS insulin market in Europe
As per FMI, the CIS insulin market in Europe is poised to exhibit strong growth on the back of surging technologically advanced research & treatment platforms for the diagnosis of chronic diseases, expanding healthcare infrastructure, and advancement in IT healthcare organizations. Also, increasing awareness and greater spending on healthcare treatments and procedures. With such as acceleration in the healthcare industry, manufacturers of CIS insulin are focusing on leading economies to strengthen their market footprint globally.
The rapid technological development and extensive government initiatives for the production and the regulation of price increases will boost the growth of the CIS insulin market across Europe during the forthcoming period. Amongst all countries, the UK is slated to emerge as the most lucrative in Europe, expected to flourish at a 3.4% CAGR until 2035, reaching USD 33 Million.
Rapid Acting CIS Insulin to experience Maximum Uptake
Based on product type, rapid-acting CIS insulin is likely to account for maximum growth, growing at a 2.2% CAGR. As rapid-acting insulins work very quickly to minimize the rise in blood sugar after eating and their effect lasts for a couple of hours. This type of insulin is often used with longer-acting insulin for maintaining blood glucose for a longer period.
Rapid-acting insulin replaces the insulin that is normally produced by the body and by helping sugar move from the blood into other body tissues where it is used for energy inhibiting the liver from producing more sugar is another factor that makes them a preferred choice among physicians as well as patients. This will boost the demand for the segment in the forecasting period.
Treatment for Type I and other Diabetes to Contribute a Significant Portion to Market Growth
Based on application, FMI’s latest report on the CIS insulin market forecast Type I and Other Diabetes segment to grow at a CAGR of 2.1% during the assessment period. The increasing diagnosis rate of type I and other diabetes boost the growth of the segment.
According to the International Diabetic Federation around 10% of all people with diabetes have type 1 diabetes. All people with type 1 diabetes need to take insulin to control their blood glucose levels. Increasing the production of insulin in developed countries and various new products will boost the growth of the segment.
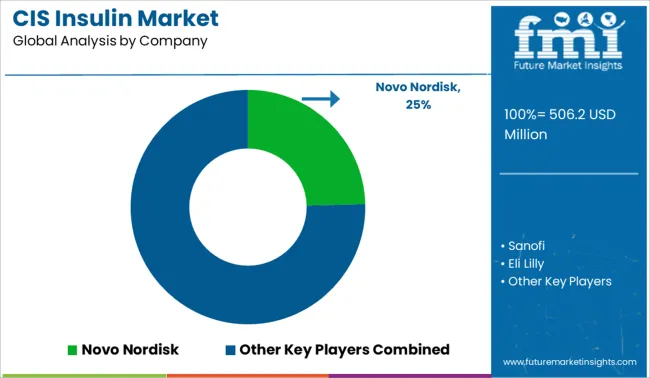
Some of the leading cis insulin include Novo Nordisk, Sanofi, Eli Lilly, Bristol-Myers Squibb and Novartis among others. These key CIS Insulin providers are adopting various strategies such as new product launches and approvals, partnerships, collaborations, acquisitions, mergers, etc. to increase their sales and gain a competitive edge in the global CIS Insulin market.
| Report Attribute | Details |
|---|---|
| Growth Rate | 2.7% CAGR from 2025 to 2035 |
| Market Value for 2025 | USD 506.2 million |
| Market Value for 2035 | USD 660.7 million |
| Base Year for Estimation | 2024 |
| Historical Data | 2020 to 2024 |
| Forecast Period | 2025 to 2035 |
| Quantitative Units | USD Million for Value |
| Report Coverage | Revenue Forecast, Company Ranking, Competitive Landscape, Growth Factors, Trends, and Pricing Analysis |
| Segments Covered | Product Type, Application, Source, Region |
| Regions Covered | North America; Europe; Asia Pacific; Latin America; Middle East & Africa |
| Key Countries Profiled | USA, Canada, Brazil, Mexico, Germany, France, UK, Italy, BENELUX, Nordics, China, Japan, South Korea, GCC, South Africa, Turkey |
| Key Companies Profiled | Sanofi; Eli Lilly; Bristol-Myers Squibb; Novartis; Takeda Pharmaceuticals; Boehringer Ingelheim; Biocon; Dongbao Enterprise Group Co. Ltd.; Merck KGaA; Oramed Pharmaceuticals Inc.; Halozyme Therapeutics; Wanbang Biopharma; Xinbai Pharmaceutical; Indrar; Farmak |
| Report Customization & Pricing | Available upon Request |
The global cis insulin market is estimated to be valued at USD 506.2 million in 2025.
The market size for the cis insulin market is projected to reach USD 660.7 million by 2035.
The cis insulin market is expected to grow at a 2.7% CAGR between 2025 and 2035.
The key product types in cis insulin market are rapid acting cis insulin, long acting cis insulin, premixed cis insulin, premixed analog cis insulin, short-acting cis insulin and intermediate-acting cis insulin.
In terms of application, cis insulin for treating type ii diabetes segment to command 62.7% share in the cis insulin market in 2025.


Full Research Suite comprises of:
Market outlook & trends analysis
Interviews & case studies
Strategic recommendations
Vendor profiles & capabilities analysis
5-year forecasts
8 regions and 60+ country-level data splits
Market segment data splits
12 months of continuous data updates
DELIVERED AS:
PDF EXCEL ONLINE
Cissus Quadrangularis Market Analysis by Product Form, Grade, End Use and Sales Channel Through 2035
Scissor Lift Market Size and Share Forecast Outlook 2025 to 2035
Decision Intelligence Market Forecast and Outlook 2025 to 2035
Decision Management Applications Market Size and Share Forecast Outlook 2025 to 2035
Precision Livestock Farming Market Size and Share Forecast Outlook 2025 to 2035
Precision Wire Drawing Service Market Size and Share Forecast Outlook 2025 to 2035
Precision Planting Market Size and Share Forecast Outlook 2025 to 2035
Precision Bearing Market Size and Share Forecast Outlook 2025 to 2035
Precision Laser Engraving Machines Market Size and Share Forecast Outlook 2025 to 2035
Precision Analog Potentiometer Market Size and Share Forecast Outlook 2025 to 2035
Precision Blanking Dies Market Size and Share Forecast Outlook 2025 to 2035
Precision Components And Tooling Systems Market Size and Share Forecast Outlook 2025 to 2035
Precision Chemicals Market Size and Share Forecast Outlook 2025 to 2035
Precision Fermentation Ingredients Market Size and Share Forecast Outlook 2025 to 2035
Precision-Fermented Casein for QSR Pizza Cheese Market Analysis - Size, Share, and Forecast Outlook 2025 to 2035
Precision Ruminant Minerals Market Analysis - Size and Share Forecast Outlook 2025 to 2035
Precision Forestry Market Size and Share Forecast Outlook 2025 to 2035
Precision Stainless Steel Market Size and Share Forecast Outlook 2025 to 2035
Precision Machine For Polymers Market Size and Share Forecast Outlook 2025 to 2035
Precision Aquaculture Market Size and Share Forecast Outlook 2025 to 2035

Thank you!
You will receive an email from our Business Development Manager. Please be sure to check your SPAM/JUNK folder too.
Chat With
MaRIA