Precision Ruminant Minerals Market Size and Share Forecast Outlook 2025 to 2035

The Precision Ruminant Minerals Market is expected to record a valuation of USD 0.45 billion in 2025 and USD 0.77 billion in 2035, with an increase of USD 0.32 billion, representing a 1.7X expansion in market size over the decade. The overall growth corresponds to a 5.5% CAGR from 2025 to 2035.
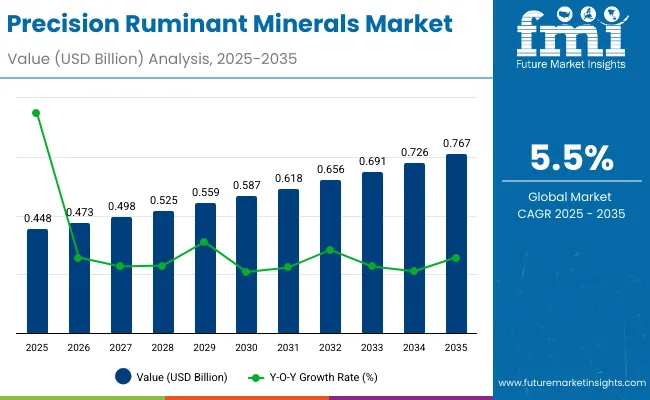
Quick Stats for Precision Ruminant Minerals Market

  • Market Value (2025): USD 0.45 billion
  • Forecast Value (2035): USD 0.77 billion
  • Forecast CAGR (2025 to 2035): 5.5%
  • Leading Segment in 2025: Macro Minerals
  • Key Growth Regions: North America, Europe, South Asia & Pacific
  • Top Companies: Zinpro Corporation, Alltech, DSM-Firmenich, Cargill Animal Nutrition, Kemin Industries, Balchem Corporation, Trouw Nutrition (Nutreco), Phibro Animal Health Corporation, Novus International, Virbac

Precision Ruminant Minerals Market

Precision Ruminant Minerals Market Key Takeaways

Metric Value
Market Estimated Value in (2025E) USD 0.45 billion
Market Forecast Value in (2035F) USD 0.77 billion
Forecast CAGR (2025 to 2035) 5.5%

During the first five-year period from 2025 to 2030, the market is expected to increase from USD 0.45 billion to USD 0.59 billion, adding nearly USD 0.14 billion, which accounts for about 45% of the total decade growth. This phase records steady adoption in dairy nutrition, reproductive health improvement, and milk quality optimization, driven by the growing precision-feeding culture. Macro minerals dominate this period as they remain critical for metabolic and structural balance across ruminant herds.

The second half from 2030 to 2035 contributes an additional USD 0.18 billion, equal to 55% of total growth, as the market rises from USD 0.59 billion to USD 0.77 billion. This acceleration is powered by the widespread integration of precision livestock farming technologies, digital ration formulation platforms, and sustainability-linked feed programs. Specialty and functional minerals, along with chelated organic formulations, are projected to capture a larger share by the end of the decade. Analytics-driven supplementation and compliance-based programs are also expected to add recurring value across markets.

From 2020 to 2024, the precision minerals space advanced steadily, though broader mineral supplementation remained commodity-focused. During this period, the market structure was led by macro and inorganic minerals controlling the bulk of volume, with companies like Alltech, Zinpro, and Cargill dominating supply chains. Differentiation relied largely on feed-grade consistency and cost optimization, while value-added solutions such as chelated forms and hydroxy trace minerals represented emerging niches.

Demand for precision ruminant minerals is set to expand to USD 0.45 billion in 2025, with the revenue mix shifting toward chelated and specialty minerals that enhance bioavailability and sustainability outcomes. Traditional bulk mineral suppliers face rising competition from players offering data-driven, farm-specific solutions, AI-assisted ration tools, and sustainability certifications. Established vendors are pivoting to hybrid models that combine raw mineral supply with digital analytics and traceability platforms. Competitive advantage is shifting away from low-cost provisioning to ecosystem-based offerings, compliance-readiness, and performance-linked outcomes.

Why the Precision Ruminant Minerals Market is Growing?

Advances in feed formulation technologies have improved mineral bioavailability and delivery precision, enabling more efficient nutrient absorption across diverse ruminant production systems. Macro and trace minerals are increasingly being formulated into chelated and functional forms, ensuring higher uptake and reduced antagonistic interactions. The rising adoption of precision livestock farming tools has contributed to real-time monitoring of mineral intake and animal health parameters, reinforcing demand for tailored supplementation programs. Dairy and beef producers are driving demand for precision mineral solutions that can integrate seamlessly with TMR systems, premixes, and digital ration balancing software.

The expansion of automated feeding systems and compliance-linked nutritional strategies has further fueled market growth. Innovations in delivery formats such as boluses, liquid supplements, and water-soluble applications are opening new opportunities for targeted supplementation. Segment growth is expected to be led by macro minerals in overall volume, while organic/chelated minerals are expected to advance rapidly due to sustainability benefits, better traceability, and improved efficiency across dairy, beef, and small ruminants.

Segmental Analysis

The Precision Ruminant Minerals Market is segmented by mineral type, source form, functionality, livestock type, delivery format, application method, sales channel, and region. Mineral type covers macro minerals, trace minerals, and specialty or functional minerals, reflecting their vital roles in growth, reproduction, immunity, and metabolic balance. Source form is classified into inorganic options such as oxides, sulfates, carbonates, and chlorides, as well as organic or chelated formats including amino acid chelates, proteinates, complexed minerals, hydroxy trace minerals, and nano minerals. Functionality segmentation spans areas such as growth and weight gain, milk production and quality, reproductive health, hoof and bone strength, immunity support, heat stress reduction, and metabolic efficiency, underlining the diverse applications of precision supplementation.

By livestock type, the market encompasses dairy cattle, beef cattle, sheep, goats, and buffalo, each presenting distinct nutritional requirements. Delivery format is categorized into premixes or mineral mixes, lick blocks, boluses or capsules, loose powders, and liquid supplements, offering flexibility in on-farm administration. Application method includes feed inclusion within TMR or compound feed, free-choice supplementation, and water-soluble applications, highlighting the adaptability of precision minerals to modern feeding systems. Sales channel segmentation spans direct supply to farms, distribution through feed manufacturers or integrators, and networks of distributors and dealers. Regionally, the market scope extends across North America, Europe, Asia-Pacific, Latin America, and the Middle East and Africa, with South Asia and Pacific emerging as a key growth cluster due to rising herd populations and increasing adoption of precision nutrition practices.
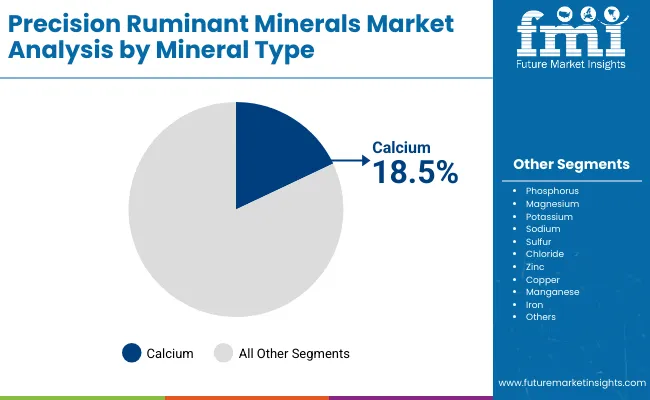
Insights into the Mineral Type Segment with Calcium Leading in Market Share

Precision Ruminant Minerals Market By Mineral

Mineral Type Segment Value Share (%)
Calcium 18.50%
Phosphorus 14.20%
Magnesium 10.50%
Potassium 8.40%
Sodium 7.10%
Sulfur 5.90%
Chloride 4.80%
Zinc 9.60%
Copper 6.40%
Manganese 5.20%
Iron 3.90%
Iodine 2.80%
Selenium 1.80%
Cobalt 0.90%
Chromium 0.70%
Molybdenum 0.50%
Boron 0.30%
Silicon 0.30%

The mineral type segment is dominated by Calcium, accounting for 18.5% of market value share in 2025, reflecting its essential role in bone development, milk production, and metabolic stability in ruminants. Calcium demand continues to be prioritized as dairy systems expand and precision feeding practices reinforce the need for balanced structural minerals. Phosphorus follows with 14.2% share, driven by its role in energy metabolism and reproduction efficiency, while Magnesium (10.5%) and Zinc (9.6%) contribute significantly due to their relevance in enzyme activation, immune support, and stress mitigation.

The segment’s growth is supported by rising adoption of multi-mineral blends that combine macro and trace minerals to deliver targeted functional benefits across cattle, sheep, goats, and buffalo. Investments in organic and chelated forms of calcium, phosphorus, and zinc are enhancing absorption rates, thereby reducing wastage and environmental excretion. The growing emphasis on sustainability, animal welfare, and precision supplementation strategies ensures that Calcium is expected to retain its leading position throughout the forecast period, with strong reinforcement from phosphorus and zinc as complementary pillars of the mineral nutrition market.
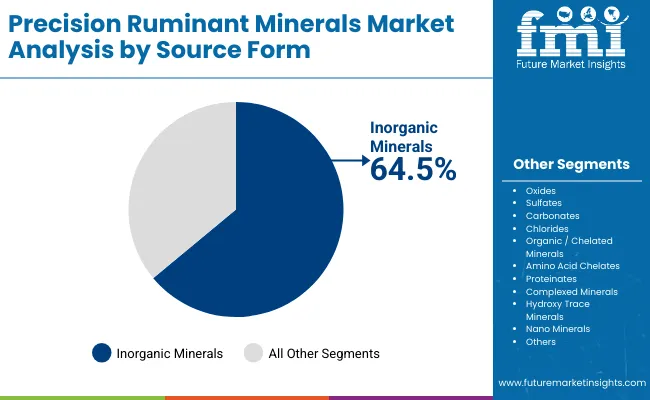
Insights into the Source Form Segment with Inorganic Minerals Leading in Market Share

Precision Ruminant Minerals Market By Source

Source Form Type Segment Value Share (%)
Inorganic Minerals 64.50%
Oxides 18.00%
Sulfates 16.50%
Carbonates 15.00%
Chlorides 15.00%
Organic / Chelated Minerals 25.50%
Amino Acid Chelates 10.50%
Proteinates 9.20%
Complexed Minerals 5.80%
Hydroxy Trace Minerals 6.80%
Nano Minerals 3.20%

The source form segment is led by Inorganic Minerals, which capture 64.5% of the market value in 2025. This dominance is attributed to their widespread availability, lower cost, and long-standing use in bulk feed supplementation programs. Within this category, Oxides (18.0%), Sulfates (16.5%), Carbonates (15.0%), and Chlorides (15.0%) remain the core formats, valued for consistency in supply and cost-effectiveness. Their growth continues to be reinforced by large-scale dairy and beef operations seeking reliable inputs for baseline mineral requirements.

However, the segment is undergoing a gradual shift toward Organic and Chelated Minerals, which collectively account for 25.5% of the market share. Sub-categories such as Amino Acid Chelates (10.5%) and Proteinates (9.2%) are gaining traction due to their superior bioavailability and reduced antagonistic interactions in ruminant diets. Hydroxy trace minerals (6.8%) and Nano minerals (3.2%) represent emerging high-value niches, reflecting innovation aimed at improving absorption, animal performance, and environmental outcomes.

As sustainability-linked feeding strategies become more prevalent, the balance between inorganic affordability and organic efficacy is expected to define purchasing decisions. Inorganic minerals are projected to retain their leading position in absolute terms, but organic formats are expected to expand more rapidly, gradually reshaping the competitive structure of the source form landscape.
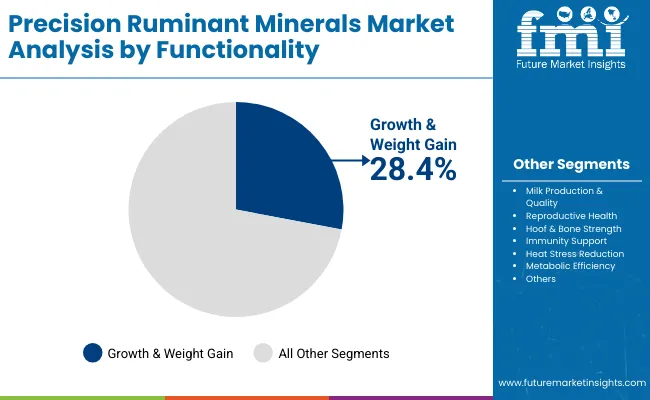
Insights into the Functionality Segment with Growth & Weight Gain Leading in Market Share

Precision Ruminant Minerals Market By Functionality

Functionality Segment Value Share (%)
Growth & Weight Gain 28.40%
Milk Production & Quality 24.50%
Reproductive Health 14.20%
Hoof & Bone Strength 10.10%
Immunity Support 9.80%
Heat Stress Reduction 7.00%
Metabolic Efficiency 6.00%

The functionality segment is dominated by Growth & Weight Gain, accounting for 28.4% of the market share in 2025. This leadership reflects the consistent priority placed on achieving optimal feed-to-weight conversion in beef production systems and ensuring steady growth performance in dairy replacements. The emphasis on carcass yield and finishing efficiency continues to sustain demand for precision mineral supplementation targeted at growth outcomes.

Milk Production & Quality, with a 24.5% share, represents the second-largest segment, underpinned by the critical role of minerals in enhancing lactation efficiency, milk yield, and component quality. The Reproductive Health segment, at 14.2%, is expected to gain momentum as fertility metrics and conception rates are increasingly tied to mineral balance and trace element adequacy.

Meanwhile, Hoof & Bone Strength (10.1%) and Immunity Support (9.8%) are growing in relevance as producers seek to minimize health-related losses and improve animal welfare standards. Functional categories such as Heat Stress Reduction (7.0%) and Metabolic Efficiency (6.0%) are emerging as forward-looking niches, particularly in tropical and high-temperature geographies, where environmental stress poses a direct risk to productivity.

What are the Drivers, Restraints, and Key Trends of the Precision Ruminant Minerals Market?

Adoption of precision ruminant minerals is being shaped by economic pressures, regulatory mandates, and nutritional science advances, even as producers pursue efficiency gains. Market outcomes are increasingly linked to sustainability objectives, digital ration analytics, and farm-level validation of mineral utilization efficiency.

Integration of Digital Nutrition Platforms

The integration of digital nutrition platforms into livestock feeding operations is expected to fundamentally transform precision mineral adoption. Ration-balancing tools, supported by real-time biomarker monitoring and milk component analytics, are being deployed to validate mineral utilization with measurable outcomes. By embedding mineral optimization within digital herd management dashboards, producers are projected to align supplementation strategies directly with reproductive performance, milk yield, and health metrics. This integration is anticipated to shift minerals from a cost-input category to a performance-linked investment. Over the forecast period, the credibility established through digital traceability is projected to strengthen adoption among progressive dairy and beef operations.

Sustainability-Linked Nutritional Compliance

Sustainability-linked nutritional compliance is being positioned as a defining trend in the precision minerals market. Policymakers are tightening thresholds for phosphorus runoff, trace element excretion, and greenhouse gas emissions, while processors and cooperatives are linking premium payments to environmental performance indicators. Precision mineral strategies, particularly organic and chelated forms, are being recognized as tools for lowering waste and reducing ecological footprints without compromising productivity. As compliance frameworks become harmonized with carbon accounting and animal welfare audits, precision minerals are expected to gain traction as compliance enablers. This evolution is anticipated to strengthen supplier differentiation and enhance long-term market resilience.
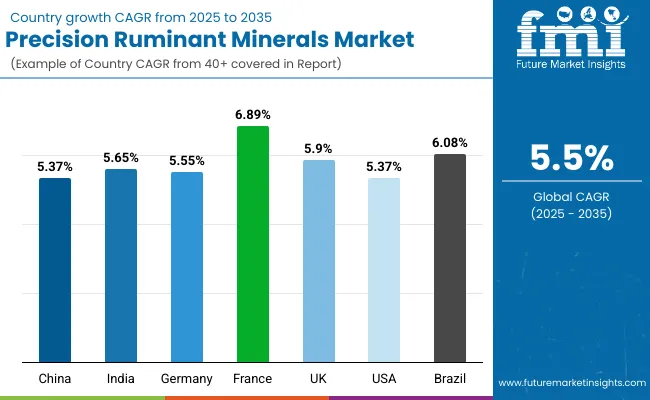
Analysis of Precision Ruminant Minerals Market By Key Countries

Precision Ruminant Minerals Market By Country

Countries CAGR
China 5.37%
India 5.65%
Germany 5.55%
France 6.89%
UK 5.90%
USA 5.37%
Brazil 6.08%

The global Precision Ruminant Minerals Market shows a pronounced regional disparity in adoption speed, strongly influenced by livestock intensification, sustainability mandates, and feed modernization. Asia-Pacific emerges as the fastest-growing region, anchored by China at 5.4% CAGR and India at 5.7% CAGR. China’s trajectory is being reinforced by government-backed sustainability programs, stricter nutrient management policies, and expanding dairy and beef herds that demand high-precision mineral balancing. India’s growth reflects modernization of cooperatives, buffalo-focused supplementation, and increasing use of digital ration tools to improve productivity and export competitiveness.

Europe maintains a strong growth profile, led by Germany, France, and the UK, where stringent EU phosphorus runoff regulations, animal welfare compliance, and widespread adoption of digital feeding platforms accelerate precision mineral demand. Strong regulatory frameworks and investments in feed analytics keep Europe ahead of North America in terms of compliance-driven adoption. North America demonstrates moderate but steady expansion, with the USA at 6.1% CAGR, reflecting maturity in supplementation practices but rising adoption of premium chelated formulations and sustainability-linked milk pricing models.

Growth in North America is expected to be more solution-driven, with increasing reliance on digital nutrition platforms and farm-level data integration rather than sheer volume expansion. Latin America, anchored by Brazil, contributes selectively through feedlot intensification and structured mineral programs tied to beef exports.
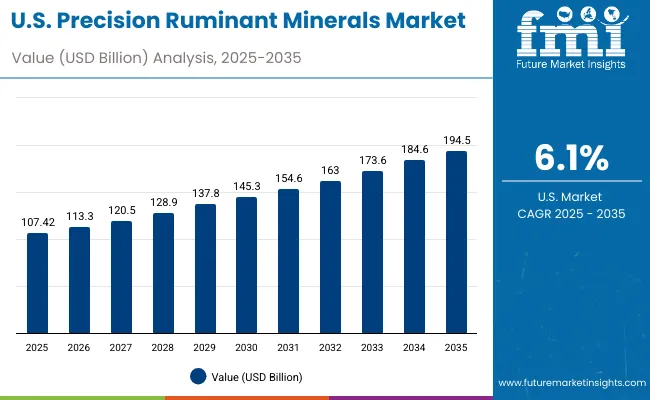
Sales Outlook for Precision Ruminant Minerals in the United States

Precision Ruminant Minerals Market Usa

Year USA Precision Ruminant Minerals Market (USD Billion)
2025 107.42
2026 113.3
2027 120.5
2028 128.9
2029 137.8
2030 145.3
2031 154.6
2032 163.0
2033 173.6
2034 184.6
2035 194.5

The Precision Ruminant Minerals Market in the United States is projected to grow at a CAGR of 6.1%, supported by advanced dairy and beef production systems and increasing integration of digital nutrition platforms. Year-on-year growth has been notable in reproductive health and immunity-focused supplementation, particularly among progressive dairy herds adopting precision mineral balancing for fertility and milk component optimization. The beef feedlot sector has also been expanding structured mineral programs, with chelated trace elements increasingly used to improve feed conversion and carcass yield.

The dairy industry, supported by sustainability-linked pricing models, is prioritizing mineral programs that align with nutrient excretion regulations and milk quality standards. Adoption is further expanding into small-ruminant and specialty herds, where tailored mineral strategies are improving productivity and resilience. The integration of digital ration-balancing software and compliance-driven traceability systems is creating opportunities for bundled mineral-analytics solutions and long-term supplier partnerships in USA livestock nutrition.

  • Reproductive health supplementation is a major use case driving adoption in dairy herds.
  • Beef feedlots are integrating chelated minerals to optimize feed conversion and carcass quality.
  • Bundled mineral-analytics solutions are gaining traction as compliance and sustainability requirements intensify.

Growth and Expansion Outlook for Precision Ruminant Minerals Market in the United Kingdom

The Precision Ruminant Minerals Market in the United Kingdom is projected to grow at a CAGR of 5.8%, shaped by environmental compliance frameworks, dairy intensification, and consumer-driven sustainability standards. Adoption is being reinforced by government-backed programs targeting nutrient runoff reduction, while large cooperatives are linking milk pricing to mineral-based herd health improvements. Universities and research centers are collaborating with feed manufacturers to validate bioavailability advantages of chelated and hydroxy trace minerals. These efforts are enhancing confidence in premium formulations and creating opportunities for suppliers offering traceability solutions. As the livestock sector faces increasing pressure from carbon accounting and welfare audits, precision minerals are being positioned not only as productivity enhancers but also as compliance tools.

  • Dairy cooperatives are prioritizing mineral programs linked to milk quality and sustainability metrics.
  • Academic partnerships are advancing research on chelated minerals for improved absorption.
  • Traceability initiatives are driving adoption of precision formulations across beef and dairy systems.

Growth and Expansion Outlook for Precision Ruminant Minerals Market in India

India’s Precision Ruminant Minerals Market is forecast to expand at a CAGR of 5.7% through 2035, supported by the world’s largest dairy herd and increasing modernization of cooperative-led production systems. Buffalo populations, which play a central role in milk output, are increasingly targeted with tailored mineral programs to improve fertility and yield efficiency. Cost-effective premixes are being adopted across Tier-2 cities and rural markets, supported by extension services and awareness campaigns promoting balanced mineral intake. Government-backed nutrition initiatives and partnerships with veterinary institutions are fostering structured adoption, particularly in regions with high reproductive inefficiencies. Over the next decade, India’s mineral market is expected to evolve from basic supplementation toward precision-driven solutions integrated with milk procurement and quality monitoring.

  • Buffalo-focused supplementation programs are accelerating mineral adoption in northern and eastern states.
  • Dairy cooperatives are integrating precision minerals into milk procurement and quality assurance schemes.
  • Educational and extension initiatives are building awareness of mineral balancing among smallholders.

Sales Outlook for Precision Ruminant Minerals Market in China

The Precision Ruminant Minerals Market in China is expected to grow at a CAGR of 5.4%, the highest among leading economies, driven by rapid dairy intensification, feedlot expansion, and government policies targeting sustainable livestock production. Large-scale dairy clusters are adopting digital feeding systems that incorporate mineral balancing to enhance feed efficiency while meeting emission reduction requirements. Chelated and organic mineral formulations are gaining prominence as regulators impose stricter controls on phosphorus and trace mineral excretion. Domestic feed manufacturers are investing in competitive formulations, enabling both affordability and compliance alignment. Municipal initiatives promoting sustainable farming practices, alongside processor-driven sustainability audits, are reinforcing the shift toward precision nutrition. This dynamic is positioning China as both a volume and innovation leader in the global precision mineral space.
  • Government-backed emission reduction mandates are strengthening demand for precision mineral balancing.
  • Large-scale dairy farms are adopting digital ration systems integrating mineral optimization.
  • Domestic suppliers are offering competitive organic and chelated mineral products to expand adoption.

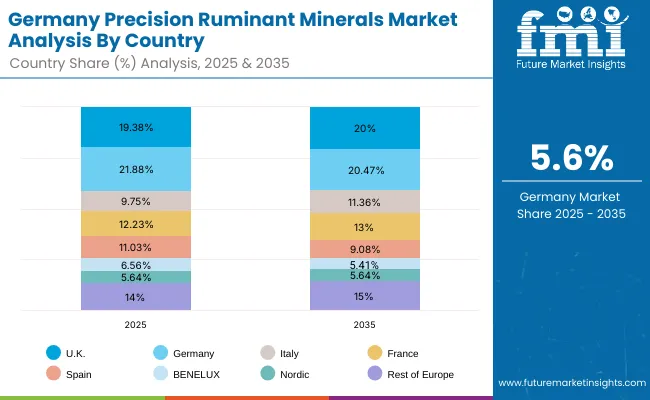
In-depth Analysis of Precision Ruminant Minerals in Germany

Precision Ruminant Minerals Market Germany

Countries 2025
UK 19.38%
Germany 21.88%
Italy 9.75%
France 12.23%
Spain 11.03%
BNELUX 6.56%
Nordic 5.64%
Rest of Europe 14%
Countries 2035
UK 20.00%
Germany 20.47%
Italy 11.36%
France 13.00%
Spain 9.08%
BNELUX 5.41%
Nordic 5.64%
Rest of Europe 15%

The Precision Ruminant Minerals Market in Germany is projected to grow at a CAGR of 5.6%, supported by the country’s leadership in advanced dairy operations, stringent EU compliance, and innovation in feed technology. German farms are integrating precision mineral programs into digital herd management systems, enabling real-time monitoring of reproductive health, immunity, and metabolic efficiency. Dairy cooperatives are linking mineral supplementation to sustainability metrics and traceability requirements, reinforcing adoption across both large-scale and family-owned herds. Research institutes and veterinary networks are validating the performance of chelated minerals in improving absorption efficiency, positioning premium formulations as compliance-ready solutions. With strict EU nutrient excretion regulations and climate-related sustainability targets, Germany is expected to remain a frontrunner in Europe’s precision mineral adoption.
  • Dairy cooperatives are linking mineral programs to sustainability and milk quality compliance.
  • Digital herd management platforms are integrating mineral optimization into reproductive and health metrics.
  • Research institutes are validating chelated minerals for superior absorption and regulatory alignment.

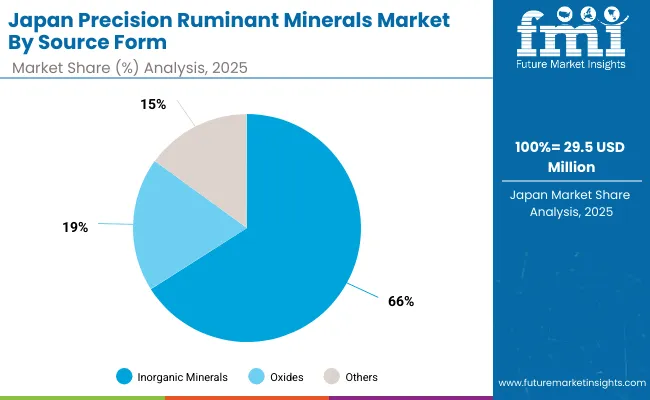
Growth Outlook for Precision Ruminant Minerals Market in Japan

Precision Ruminant Minerals Market Japan

Source Form Segment Market Value Share, 2025
Inorganic Minerals 66.00%
Oxides 19.00%
Sulfates 17.20%
Carbonates 15.20%
Chlorides 14.60%
Organic / Chelated Minerals 24.00%
Amino Acid Chelates 9.80%
Proteinates 8.60%
Complexed Minerals 5.60%
Hydroxy Trace Minerals 6.50%
Nano Minerals 3.50%

The Precision Ruminant Minerals Market in Japan is projected at USD 29.5 million in 2025. Inorganic minerals contribute 66%, while organic and chelated minerals account for 24%, reflecting a gradual value transition toward premium formulations that improve bioavailability and compliance outcomes. This growing emphasis on organics is being shaped by the rising complexity of nutritional management, where sustainability metrics, herd health efficiency, and regulatory compliance require advanced solutions beyond traditional bulk supplementation. Organic and chelated forms provide recurring opportunities through long-term herd health benefits and reduced environmental excretion, unlike inorganic formats that are often viewed as low-cost, one-time inputs.

The increasing integration of digital ration-balancing platforms and sustainability-linked nutrition programs is a major catalyst, as these applications demand precise mineral efficiency and traceable outcomes. Japanese dairy systems also emphasize high-value milk quality and nutrient compliance, which further amplifies the adoption of chelated and nano mineral formulations. As farm automation deepens, integrated feeding strategies that combine mineral optimization with digital monitoring will define the competitive landscape in Japan.
  • Market in Japan holds ~6.6% share of global value in 2025
  • Inorganic minerals dominate at 66% vs. 24% for organics
  • Growth supported by digital rationing and sustainability-linked nutrition programs

Opportunity Analysis of South Korea Precision Ruminant Minerals Market

Precision Ruminant Minerals Market South Korea

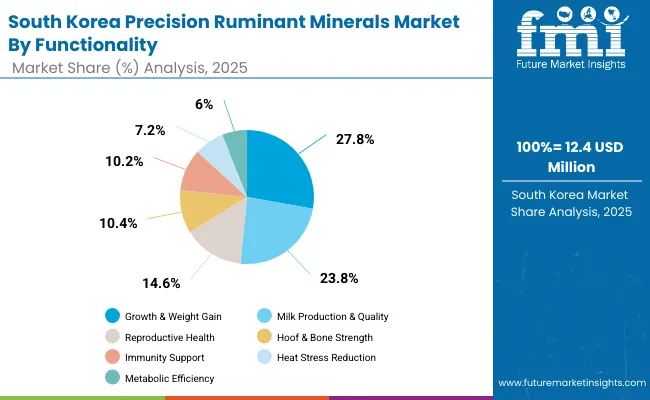
The Precision Ruminant Minerals Market in South Korea is valued at USD 12.4 million in 2025, with Growth & Weight Gain leading at 27.8%, followed by Milk Production & Quality at 23.8%, and Reproductive Health at 14.6%.The dominance of growth-focused functionality reflects South Korea’s livestock structure, where feed efficiency and carcass quality are prioritized in beef and dairy operations. Precision supplementation for milk production is also expanding as cooperatives emphasize high-value dairy exports and compliance with nutritional quality standards. Increasing attention to reproductive health highlights a shift toward reducing fertility losses and improving herd sustainability.

This advantage positions functionality-driven mineral programs as critical enablers of productivity, health, and regulatory alignment. Niche areas such as immunity support (10.2%)and heat stress reduction (7.2%)are emerging as strategic focus points in response to climate-related stress and disease risks. As Industry 4.0 frameworks extend into livestock management, digital rationing and biomarker-driven supplementation are expected to further enhance adoption.
  • Market size for South Korea in 2025 is USD 12.4 million
  • Global market share is approximately 2.8%
  • Growth & Weight Gain leads at 27.8%, followed by Milk Production & Quality at 23.8%

Competitive Landscape of Precision Ruminant Minerals Market

Precision Ruminant Minerals Market By Company

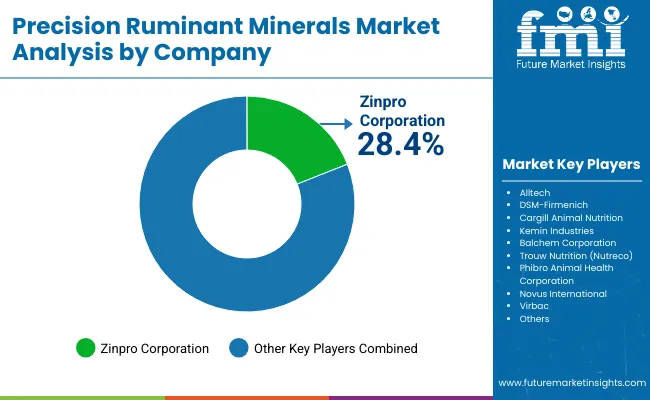
The Precision Ruminant Minerals Market is moderately fragmented, with multinational nutrition giants, specialized mineral innovators, and region-focused suppliers competing across dairy, beef, and small-ruminant nutrition. Global leaders such as Zinpro Corporation, DSM-Firmenich, and Cargill Animal Nutrition hold significant market share, supported by diversified portfolios, advanced chelated trace mineral technologies, and deep integration with digital feeding platforms. Their strategies increasingly emphasize sustainability-linked supplementation, farm-level data analytics, and end-to-end nutrition programs validated through measurable outcomes.

Mid-sized players, including Alltech, Balchem Corporation, and Trouw Nutrition (Nutreco), cater to targeted demand for organic and hydroxy trace minerals. These firms are advancing adoption through farmer-focused extension services, hybrid distribution models, and bundled offerings that combine minerals with functional feed additives. Their strength lies in bioavailability validation and alignment with regulatory compliance requirements.

Specialist providers such as Phibro Animal Health, Novus International, and Virbac focus on cost-effective, application-specific solutions, particularly in reproductive health, immunity support, and niche ruminant categories. Their differentiation is tied to product customization, regional adaptability, and value-added services rather than global scale.

Competitive differentiation is shifting away from commodity mineral supply toward integrated ecosystems that include digital ration optimization, sustainability certifications, and subscription-based nutrition services, positioning precision minerals as a strategic enabler of productivity and compliance.

Key Developments in Precision Ruminant Minerals Market

  • On February 5, 2025,Zinpro Corporation launched a next-generation trace mineral platform integrating digital ration analytics. The platform enables real-time mineral balancing linked to herd performance dashboards, positioning minerals as measurable performance drivers across dairy and beef systems.
  • On April 22, 2025, DSM-Firmenich partnered with European dairy cooperatives to pilot chelated mineral programs tied to sustainability-linked milk contracts. The initiative uses verified data on mineral excretion reduction to secure premiums for farmers, aligning nutritional innovation with environmental compliance.

Scope of the Report

Item Value
Quantitative Units USD Billion (Value)
Mineral Type Macro Minerals (Calcium, Phosphorus, Magnesium, Potassium, Sodium, Sulfur, Chloride) and Trace Minerals (Zinc, Copper, Manganese, Iron, Iodine, Selenium, Cobalt) along with Specialty/Functional Minerals (Chromium, Molybdenum, Boron, Silicon)
Source Form Inorganic Minerals (Oxides, Sulfates, Carbonates, Chlorides) and Organic/Chelated Minerals (Amino Acid Chelates, Proteinates, Complexed Minerals, Hydroxy Trace Minerals, Nano Minerals)
Functionality Growth & Weight Gain, Milk Production & Quality, Reproductive Health, Hoof & Bone Strength, Immunity Support, Heat Stress Reduction, Metabolic Efficiency
Livestock Type Dairy Cattle, Beef Cattle, Sheep, Goats, Buffalo
Delivery Format Premix / Mineral Mix, Lick Blocks, Boluses / Capsules, Loose Powders, Liquid Supplements
Application Method Feed Inclusion (TMR, Compound Feed), Free-choice Supplementation, Water-soluble Application
Sales Channels Direct to Farms (B2B), Through Feed Manufacturers / Integrators, Distributors & Dealers
Regions Covered North America, Europe, Asia-Pacific, Latin America, Middle East & Africa
Countries Covered United States, Canada, Germany, France, United Kingdom, China, Japan, India, Brazil, South Africa
Key Companies Profiled Zinpro Corporation, Alltech, DSM- Firmenich, Cargill Animal Nutrition, Kemin Industries, Balchem Corporation, Trouw Nutrition (Nutreco), Phibro Animal Health Corporation, Novus International, Virbac
Additional Attributes Dollar sales by mineral type, functionality, and livestock category; adoption of chelated and organic minerals; sector-specific growth in dairy, beef, and small ruminants; digital rationing and precision feeding trends; regulatory drivers around nutrient excretion and sustainability compliance; regional dynamics shaped by cooperative systems, farm size, and climate stress; innovations in hydroxy trace minerals, nano minerals, and bioavailability-enhancing technologies.

Key Segments

By Mineral Type:

  • Macro Minerals
    • Calcium
    • Phosphorus
    • Magnesium
    • Potassium
    • Sodium
    • Sulfur
    • Chloride
  • Trace Minerals
    • Zinc
    • Copper
    • Manganese
    • Iron
    • Iodine
    • Selenium
    • Cobalt
  • Specialty / Functional Minerals
    • Chromium
    • Molybdenum
    • Boron
    • Silicon

By Source Form:

  • Inorganic Minerals
    • Oxides
    • Sulfates
    • Carbonates
    • Chlorides
  • Organic / Chelated Minerals
    • Amino Acid Chelates
    • Proteinates
    • Complexed Minerals
  • Hydroxy Trace Minerals
  • Nano Minerals

By Functionality:

  • Growth & Weight Gain
  • Milk Production & Quality
  • Reproductive Health
  • Hoof & Bone Strength
  • Immunity Support
  • Heat Stress Reduction
  • Metabolic Efficiency

By Livestock Type:

  • Dairy Cattle
  • Beef Cattle
  • Sheep
  • Goats
  • Buffalo

By Delivery Format:

  • Premix / Mineral Mix
  • Lick Blocks / Mineral Blocks
  • Bolus / Capsules
  • Loose Powder
  • Liquid Supplements

By Application Method:

  • Feed Inclusion (TMR, Compound Feed)
  • Free-choice Supplementation
  • Water-soluble Application

By Sales Channel:

  • Direct to Farms (B2B)
  • Through Feed Manufacturers / Integrators
  • Distributors & Dealers

By Region:

  • North America
  • Latin America
  • Europe
  • East Asia
  • South Asia & Pacific
  • Middle East and Africa

Table of Content

  1. Executive Summary
    • Global Market Outlook
    • Demand-side Trends
    • Supply-side Trends
    • Technology Roadmap Analysis
    • Analysis and Recommendations
  2. Market Overview
    • Market Coverage / Taxonomy
    • Market Definition / Scope / Limitations
  3. Market Background
    • Market Dynamics
      • Drivers
      • Restraints
      • Opportunity
      • Trends
    • Scenario Forecast
      • Demand in Optimistic Scenario
      • Demand in Likely Scenario
      • Demand in Conservative Scenario
    • Opportunity Map Analysis
    • Product Life Cycle Analysis
    • Supply Chain Analysis
    • Investment Feasibility Matrix
    • Value Chain Analysis
    • PESTLE and Porter’s Analysis
    • Regulatory Landscape
    • Regional Parent Market Outlook
    • Production and Consumption Statistics
    • Import and Export Statistics
  4. Global Market Analysis 2020 to 2024 and Forecast, 2025 to 2035
    • Historical Market Size Value (USD Million) Analysis, 2020 to 2024
    • Current and Future Market Size Value (USD Million) Projections, 2025 to 2035
      • Y-o-Y Growth Trend Analysis
      • Absolute $ Opportunity Analysis
  5. Global Market Pricing Analysis 2020 to 2024 and Forecast 2025 to 2035
  6. Global Market Analysis 2020 to 2024 and Forecast 2025 to 2035, By Mineral Type
    • Introduction / Key Findings
    • Historical Market Size Value (USD Million) Analysis By Mineral Type, 2020 to 2024
    • Current and Future Market Size Value (USD Million) Analysis and Forecast By Mineral Type, 2025 to 2035
      • Macro Minerals
        • Calcium
        • Phosphorus
        • Magnesium
        • Potassium
        • Sodium
        • Sulfur
        • Chloride
      • Trace Minerals
        • Zinc
        • Copper
        • Manganese
        • Iron
        • Iodine
        • Selenium
        • Cobalt
      • Specialty / Functional Minerals
        • Chromium
        • Molybdenum
        • Boron
        • Silicon
    • Y-o-Y Growth Trend Analysis By Mineral Type, 2020 to 2024
    • Absolute $ Opportunity Analysis By Mineral Type, 2025 to 2035
  7. Global Market Analysis 2020 to 2024 and Forecast 2025 to 2035, By Source Form
    • Introduction / Key Findings
    • Historical Market Size Value (USD Million) Analysis By Source Form, 2020 to 2024
    • Current and Future Market Size Value (USD Million) Analysis and Forecast By Source Form, 2025 to 2035
      • Inorganic Minerals
        • Oxides
        • Sulfates
        • Carbonates
        • Chlorides
      • Organic / Chelated Minerals
        • Amino Acid Chelates
        • Proteinates
        • Complexed Minerals
      • Hydroxy Trace Minerals
      • Nano Minerals
    • Y-o-Y Growth Trend Analysis By Source Form, 2020 to 2024
    • Absolute $ Opportunity Analysis By Source Form, 2025 to 2035
  8. Global Market Analysis 2020 to 2024 and Forecast 2025 to 2035, By Functionality
    • Introduction / Key Findings
    • Historical Market Size Value (USD Million) Analysis By Functionality, 2020 to 2024
    • Current and Future Market Size Value (USD Million) Analysis and Forecast By Functionality, 2025 to 2035
      • Growth & Weight Gain
      • Milk Production & Quality
      • Reproductive Health
      • Hoof & Bone Strength
      • Immunity Support
      • Heat Stress Reduction
      • Metabolic Efficiency
    • Y-o-Y Growth Trend Analysis By Functionality, 2020 to 2024
    • Absolute $ Opportunity Analysis By Functionality, 2025 to 2035
  9. Global Market Analysis 2020 to 2024 and Forecast 2025 to 2035, By Livestock Type
    • Introduction / Key Findings
    • Historical Market Size Value (USD Million) Analysis By Livestock Type, 2020 to 2024
    • Current and Future Market Size Value (USD Million) Analysis and Forecast By Livestock Type, 2025 to 2035
      • Dairy Cattle
      • Beef Cattle
      • Sheep
      • Goats
      • Buffalo
    • Y-o-Y Growth Trend Analysis By Livestock Type, 2020 to 2024
    • Absolute $ Opportunity Analysis By Livestock Type, 2025 to 2035
  10. Global Market Analysis 2020 to 2024 and Forecast 2025 to 2035, By Delivery Format
    • Introduction / Key Findings
    • Historical Market Size Value (USD Million) Analysis By Delivery Format, 2020 to 2024
    • Current and Future Market Size Value (USD Million) Analysis and Forecast By Delivery Format, 2025 to 2035
      • Premix / Mineral Mix
      • Lick Blocks / Mineral Blocks
      • Bolus / Capsules
      • Loose Powder
      • Liquid Supplements
    • Y-o-Y Growth Trend Analysis By Delivery Format, 2020 to 2024
    • Absolute $ Opportunity Analysis By Delivery Format, 2025 to 2035
  11. Global Market Analysis 2020 to 2024 and Forecast 2025 to 2035, By Application Method
    • Introduction / Key Findings
    • Historical Market Size Value (USD Million) Analysis By Application Method, 2020 to 2024
    • Current and Future Market Size Value (USD Million) Analysis and Forecast By Application Method, 2025 to 2035
      • Feed Inclusion (TMR, Compound Feed)
      • Free-choice Supplementation
      • Water-soluble Application
    • Y-o-Y Growth Trend Analysis By Application Method, 2020 to 2024
    • Absolute $ Opportunity Analysis By Application Method, 2025 to 2035
  12. Global Market Analysis 2020 to 2024 and Forecast 2025 to 2035, By Sales Channel
    • Introduction / Key Findings
    • Historical Market Size Value (USD Million) Analysis By Sales Channel, 2020 to 2024
    • Current and Future Market Size Value (USD Million) Analysis and Forecast By Sales Channel, 2025 to 2035
      • Direct to Farms (B2B)
      • Through Feed Manufacturers / Integrators
      • Distributors & Dealers
    • Y-o-Y Growth Trend Analysis By Sales Channel, 2020 to 2024
    • Absolute $ Opportunity Analysis By Sales Channel, 2025 to 2035
  13. Global Market Analysis 2020 to 2024 and Forecast 2025 to 2035, By Region
    • Introduction
    • Historical Market Size Value (USD Million) Analysis By Region, 2020 to 2024
    • Current Market Size Value (USD Million) Analysis and Forecast By Region, 2025 to 2035
      • North America
      • Latin America
      • Europe
      • East Asia
      • South Asia & Pacific
      • Middle East and Africa
    • Market Attractiveness Analysis By Region
  14. North America Market Analysis 2020 to 2024 and Forecast 2025 to 2035, By Country
    • Historical Market Size Value (USD Million) Trend Analysis By Market Taxonomy, 2020 to 2024
    • Market Size Value (USD Million) Forecast By Market Taxonomy, 2025 to 2035
      • By Country
        • USA
        • Canada
      • By Mineral Type
      • By Source Form
      • By Functionality
      • By Livestock Type
      • By Delivery Format
      • By Application Method
      • By Sales Channel
    • Market Attractiveness Analysis
      • By Country
      • By Mineral Type
      • By Source Form
      • By Functionality
      • By Livestock Type
      • By Delivery Format
      • By Application Method
      • By Sales Channel
    • Key Takeaways
  15. Latin America Market Analysis 2020 to 2024 and Forecast 2025 to 2035, By Country
    • Historical Market Size Value (USD Million) Trend Analysis By Market Taxonomy, 2020 to 2024
    • Market Size Value (USD Million) Forecast By Market Taxonomy, 2025 to 2035
      • By Country
        • Brazil
        • Mexico
        • Colombia
        • Rest of Latin America
      • By Mineral Type
      • By Source Form
      • By Functionality
      • By Livestock Type
      • By Delivery Format
      • By Application Method
      • By Sales Channel
    • Market Attractiveness Analysis
      • By Country
      • By Mineral Type
      • By Source Form
      • By Functionality
      • By Livestock Type
      • By Delivery Format
      • By Application Method
      • By Sales Channel
    • Key Takeaways
  16. Europe Market Analysis 2020 to 2024 and Forecast 2025 to 2035, By Country
    • Historical Market Size Value (USD Million) Trend Analysis By Market Taxonomy, 2020 to 2024
    • Market Size Value (USD Million) Forecast By Market Taxonomy, 2025 to 2035
      • By Country
        • Germany
        • UK
        • France
        • Italy
        • Spain
        • Belgium
        • Netherlands
        • Nordic
        • Switzerland
        • Russia
        • Poland
        • Rest of Europe
      • By Mineral Type
      • By Source Form
      • By Functionality
      • By Livestock Type
      • By Delivery Format
      • By Application Method
      • By Sales Channel
    • Market Attractiveness Analysis
      • By Country
      • By Mineral Type
      • By Source Form
      • By Functionality
      • By Livestock Type
      • By Delivery Format
      • By Application Method
      • By Sales Channel
    • Key Takeaways
  17. East Asia Market Analysis 2020 to 2024 and Forecast 2025 to 2035, By Country
    • Historical Market Size Value (USD Million) Trend Analysis By Market Taxonomy, 2020 to 2024
    • Market Size Value (USD Million) Forecast By Market Taxonomy, 2025 to 2035
      • By Country
        • China
        • Japan
        • South Korea
      • By Mineral Type
      • By Source Form
      • By Functionality
      • By Livestock Type
      • By Delivery Format
      • By Application Method
      • By Sales Channel
    • Market Attractiveness Analysis
      • By Country
      • By Mineral Type
      • By Source Form
      • By Functionality
      • By Livestock Type
      • By Delivery Format
      • By Application Method
      • By Sales Channel
    • Key Takeaways
  18. South Asia & Pacific Market Analysis 2020 to 2024 and Forecast 2025 to 2035, By Country
    • Historical Market Size Value (USD Million) Trend Analysis By Market Taxonomy, 2020 to 2024
    • Market Size Value (USD Million) Forecast By Market Taxonomy, 2025 to 2035
      • By Country
        • India
        • Thailand
        • Malaysia
        • Indonesia
        • Singapore
        • Vietnam
        • Australia
        • New Zealand
        • Rest of South Asia
      • By Mineral Type
      • By Source Form
      • By Functionality
      • By Livestock Type
      • By Delivery Format
      • By Application Method
      • By Sales Channel
    • Market Attractiveness Analysis
      • By Country
      • By Mineral Type
      • By Source Form
      • By Functionality
      • By Livestock Type
      • By Delivery Format
      • By Application Method
      • By Sales Channel
    • Key Takeaways
  19. Middle East and Africa Market Analysis 2020 to 2024 and Forecast 2025 to 2035, By Country
    • Historical Market Size Value (USD Million) Trend Analysis By Market Taxonomy, 2020 to 2024
    • Market Size Value (USD Million) Forecast By Market Taxonomy, 2025 to 2035
      • By Country
        • Turkey
        • UAE
        • Saudi Arabia
        • Israel
        • Other GCC Countries
        • North Africa
        • South Africa
      • By Mineral Type
      • By Source Form
      • By Functionality
      • By Livestock Type
      • By Delivery Format
      • By Application Method
      • By Sales Channel
    • Market Attractiveness Analysis
      • By Country
      • By Mineral Type
      • By Source Form
      • By Functionality
      • By Livestock Type
      • By Delivery Format
      • By Application Method
      • By Sales Channel
    • Key Takeaways
  20. Key Countries Market Analysis
    • USA
      • Pricing Analysis
      • Market Share Analysis, 2024
        • By Mineral Type
        • By Source Form
        • By Functionality
        • By Livestock Type
        • By Delivery Format
        • By Application Method
        • By Sales Channel
    • Canada
      • Pricing Analysis
      • Market Share Analysis, 2024
        • By Mineral Type
        • By Source Form
        • By Functionality
        • By Livestock Type
        • By Delivery Format
        • By Application Method
        • By Sales Channel
    • Brazil
      • Pricing Analysis
      • Market Share Analysis, 2024
        • By Mineral Type
        • By Source Form
        • By Functionality
        • By Livestock Type
        • By Delivery Format
        • By Application Method
        • By Sales Channel
    • Mexico
      • Pricing Analysis
      • Market Share Analysis, 2024
        • By Mineral Type
        • By Source Form
        • By Functionality
        • By Livestock Type
        • By Delivery Format
        • By Application Method
        • By Sales Channel
    • Colombia
      • Pricing Analysis
      • Market Share Analysis, 2024
        • By Mineral Type
        • By Source Form
        • By Functionality
        • By Livestock Type
        • By Delivery Format
        • By Application Method
        • By Sales Channel
    • Rest of Latin America
      • Pricing Analysis
      • Market Share Analysis, 2024
        • By Mineral Type
        • By Source Form
        • By Functionality
        • By Livestock Type
        • By Delivery Format
        • By Application Method
        • By Sales Channel
    • Germany
      • Pricing Analysis
      • Market Share Analysis, 2024
        • By Mineral Type
        • By Source Form
        • By Functionality
        • By Livestock Type
        • By Delivery Format
        • By Application Method
        • By Sales Channel
    • UK
      • Pricing Analysis
      • Market Share Analysis, 2024
        • By Mineral Type
        • By Source Form
        • By Functionality
        • By Livestock Type
        • By Delivery Format
        • By Application Method
        • By Sales Channel
    • France
      • Pricing Analysis
      • Market Share Analysis, 2024
        • By Mineral Type
        • By Source Form
        • By Functionality
        • By Livestock Type
        • By Delivery Format
        • By Application Method
        • By Sales Channel
    • Italy
      • Pricing Analysis
      • Market Share Analysis, 2024
        • By Mineral Type
        • By Source Form
        • By Functionality
        • By Livestock Type
        • By Delivery Format
        • By Application Method
        • By Sales Channel
    • Spain
      • Pricing Analysis
      • Market Share Analysis, 2024
        • By Mineral Type
        • By Source Form
        • By Functionality
        • By Livestock Type
        • By Delivery Format
        • By Application Method
        • By Sales Channel
    • Belgium
      • Pricing Analysis
      • Market Share Analysis, 2024
        • By Mineral Type
        • By Source Form
        • By Functionality
        • By Livestock Type
        • By Delivery Format
        • By Application Method
        • By Sales Channel
    • Netherlands
      • Pricing Analysis
      • Market Share Analysis, 2024
        • By Mineral Type
        • By Source Form
        • By Functionality
        • By Livestock Type
        • By Delivery Format
        • By Application Method
        • By Sales Channel
    • Nordic
      • Pricing Analysis
      • Market Share Analysis, 2024
        • By Mineral Type
        • By Source Form
        • By Functionality
        • By Livestock Type
        • By Delivery Format
        • By Application Method
        • By Sales Channel
    • Switzerland
      • Pricing Analysis
      • Market Share Analysis, 2024
        • By Mineral Type
        • By Source Form
        • By Functionality
        • By Livestock Type
        • By Delivery Format
        • By Application Method
        • By Sales Channel
    • Russia
      • Pricing Analysis
      • Market Share Analysis, 2024
        • By Mineral Type
        • By Source Form
        • By Functionality
        • By Livestock Type
        • By Delivery Format
        • By Application Method
        • By Sales Channel
    • Poland
      • Pricing Analysis
      • Market Share Analysis, 2024
        • By Mineral Type
        • By Source Form
        • By Functionality
        • By Livestock Type
        • By Delivery Format
        • By Application Method
        • By Sales Channel
    • Rest of Europe
      • Pricing Analysis
      • Market Share Analysis, 2024
        • By Mineral Type
        • By Source Form
        • By Functionality
        • By Livestock Type
        • By Delivery Format
        • By Application Method
        • By Sales Channel
    • China
      • Pricing Analysis
      • Market Share Analysis, 2024
        • By Mineral Type
        • By Source Form
        • By Functionality
        • By Livestock Type
        • By Delivery Format
        • By Application Method
        • By Sales Channel
    • Japan
      • Pricing Analysis
      • Market Share Analysis, 2024
        • By Mineral Type
        • By Source Form
        • By Functionality
        • By Livestock Type
        • By Delivery Format
        • By Application Method
        • By Sales Channel
    • South Korea
      • Pricing Analysis
      • Market Share Analysis, 2024
        • By Mineral Type
        • By Source Form
        • By Functionality
        • By Livestock Type
        • By Delivery Format
        • By Application Method
        • By Sales Channel
    • India
      • Pricing Analysis
      • Market Share Analysis, 2024
        • By Mineral Type
        • By Source Form
        • By Functionality
        • By Livestock Type
        • By Delivery Format
        • By Application Method
        • By Sales Channel
    • Thailand
      • Pricing Analysis
      • Market Share Analysis, 2024
        • By Mineral Type
        • By Source Form
        • By Functionality
        • By Livestock Type
        • By Delivery Format
        • By Application Method
        • By Sales Channel
    • Malaysia
      • Pricing Analysis
      • Market Share Analysis, 2024
        • By Mineral Type
        • By Source Form
        • By Functionality
        • By Livestock Type
        • By Delivery Format
        • By Application Method
        • By Sales Channel
    • Indonesia
      • Pricing Analysis
      • Market Share Analysis, 2024
        • By Mineral Type
        • By Source Form
        • By Functionality
        • By Livestock Type
        • By Delivery Format
        • By Application Method
        • By Sales Channel
    • Singapore
      • Pricing Analysis
      • Market Share Analysis, 2024
        • By Mineral Type
        • By Source Form
        • By Functionality
        • By Livestock Type
        • By Delivery Format
        • By Application Method
        • By Sales Channel
    • Vietnam
      • Pricing Analysis
      • Market Share Analysis, 2024
        • By Mineral Type
        • By Source Form
        • By Functionality
        • By Livestock Type
        • By Delivery Format
        • By Application Method
        • By Sales Channel
    • Australia
      • Pricing Analysis
      • Market Share Analysis, 2024
        • By Mineral Type
        • By Source Form
        • By Functionality
        • By Livestock Type
        • By Delivery Format
        • By Application Method
        • By Sales Channel
    • New Zealand
      • Pricing Analysis
      • Market Share Analysis, 2024
        • By Mineral Type
        • By Source Form
        • By Functionality
        • By Livestock Type
        • By Delivery Format
        • By Application Method
        • By Sales Channel
    • Rest of South Asia
      • Pricing Analysis
      • Market Share Analysis, 2024
        • By Mineral Type
        • By Source Form
        • By Functionality
        • By Livestock Type
        • By Delivery Format
        • By Application Method
        • By Sales Channel
  21. Market Structure Analysis
    • Competition Dashboard
    • Competition Benchmarking
    • Market Share Analysis of Top Players
      • By Regional
      • By Mineral Type
      • By Source Form
      • By Functionality
      • By Livestock Type
      • By Delivery Format
      • By Application Method
      • By Sales Channel
  22. Competition Analysis
    • Competition Deep Dive
      • Zinpro Corporation
        • Overview
        • Product Portfolio
        • Profitability by Market Segments (Product/Age /Sales Channel/Region)
        • Sales Footprint
        • Strategy Overview
        • Alltech
        • DSM-Firmenich
        • Cargill Animal Nutrition
        • Kemin Industries
        • Balchem Corporation
        • Trouw Nutrition (Nutreco)
        • Phibro Animal Health Corporation
        • Novus International
        • Virbac
        • Others
    • Assumptions & Acronyms Used
    • Research Methodology

List of Tables

  • Table 1: Global Market Value (USD Million) Forecast by Region, 2020-2035
  • Table 2: Global Market Value (USD Million) Forecast by Mineral Type, 2020-2035
  • Table 3: Global Market Value (USD Million) Forecast by Source Form, 2020-2035
  • Table 4: Global Market Value (USD Million) Forecast by Functionality, 2020-2035
  • Table 5: Global Market Value (USD Million) Forecast by Livestock Type, 2020-2035
  • Table 6: Global Market Value (USD Million) Forecast by Delivery Format, 2020-2035
  • Table 7: Global Market Value (USD Million) Forecast by Application Method, 2020-2035
  • Table 8: Global Market Value (USD Million) Forecast by Sales Channel, 2020-2035
  • Table 9: North America Market Value (USD Million) Forecast by Country, 2020-2035
  • Table 10: North America Market Value (USD Million) Forecast by Mineral Type, 2020-2035
  • Table 11: North America Market Value (USD Million) Forecast by Source Form, 2020-2035
  • Table 12: North America Market Value (USD Million) Forecast by Functionality, 2020-2035
  • Table 13: North America Market Value (USD Million) Forecast by Livestock Type, 2020-2035
  • Table 14: North America Market Value (USD Million) Forecast by Delivery Format, 2020-2035
  • Table 15: North America Market Value (USD Million) Forecast by Application Method, 2020-2035
  • Table 16: North America Market Value (USD Million) Forecast by Sales Channel, 2020-2035
  • Table 17: Latin America Market Value (USD Million) Forecast by Country, 2020-2035
  • Table 18: Latin America Market Value (USD Million) Forecast by Mineral Type, 2020-2035
  • Table 19: Latin America Market Value (USD Million) Forecast by Source Form, 2020-2035
  • Table 20: Latin America Market Value (USD Million) Forecast by Functionality, 2020-2035
  • Table 21: Latin America Market Value (USD Million) Forecast by Livestock Type, 2020-2035
  • Table 22: Latin America Market Value (USD Million) Forecast by Delivery Format, 2020-2035
  • Table 23: Latin America Market Value (USD Million) Forecast by Application Method, 2020-2035
  • Table 24: Latin America Market Value (USD Million) Forecast by Sales Channel, 2020-2035
  • Table 25: Europe Market Value (USD Million) Forecast by Country, 2020-2035
  • Table 26: Europe Market Value (USD Million) Forecast by Mineral Type, 2020-2035
  • Table 27: Europe Market Value (USD Million) Forecast by Source Form, 2020-2035
  • Table 28: Europe Market Value (USD Million) Forecast by Functionality, 2020-2035
  • Table 29: Europe Market Value (USD Million) Forecast by Livestock Type, 2020-2035
  • Table 30: Europe Market Value (USD Million) Forecast by Delivery Format, 2020-2035
  • Table 31: Europe Market Value (USD Million) Forecast by Application Method, 2020-2035
  • Table 32: Europe Market Value (USD Million) Forecast by Sales Channel, 2020-2035
  • Table 33: East Asia Market Value (USD Million) Forecast by Country, 2020-2035
  • Table 34: East Asia Market Value (USD Million) Forecast by Mineral Type, 2020-2035
  • Table 35: East Asia Market Value (USD Million) Forecast by Source Form, 2020-2035
  • Table 36: East Asia Market Value (USD Million) Forecast by Functionality, 2020-2035
  • Table 37: East Asia Market Value (USD Million) Forecast by Livestock Type, 2020-2035
  • Table 38: East Asia Market Value (USD Million) Forecast by Delivery Format, 2020-2035
  • Table 39: East Asia Market Value (USD Million) Forecast by Application Method, 2020-2035
  • Table 40: East Asia Market Value (USD Million) Forecast by Sales Channel, 2020-2035
  • Table 41: South Asia & Pacific Market Value (USD Million) Forecast by Country, 2020-2035
  • Table 42: South Asia & Pacific Market Value (USD Million) Forecast by Mineral Type, 2020-2035
  • Table 43: South Asia & Pacific Market Value (USD Million) Forecast by Source Form, 2020-2035
  • Table 44: South Asia & Pacific Market Value (USD Million) Forecast by Functionality, 2020-2035
  • Table 45: South Asia & Pacific Market Value (USD Million) Forecast by Livestock Type, 2020-2035
  • Table 46: South Asia & Pacific Market Value (USD Million) Forecast by Delivery Format, 2020-2035
  • Table 47: South Asia & Pacific Market Value (USD Million) Forecast by Application Method, 2020-2035
  • Table 48: South Asia & Pacific Market Value (USD Million) Forecast by Sales Channel, 2020-2035
  • Table 49: Middle East and Africa Market Value (USD Million) Forecast by Country, 2020-2035
  • Table 50: Middle East and Africa Market Value (USD Million) Forecast by Mineral Type, 2020-2035
  • Table 51: Middle East and Africa Market Value (USD Million) Forecast by Source Form, 2020-2035
  • Table 52: Middle East and Africa Market Value (USD Million) Forecast by Functionality, 2020-2035
  • Table 53: Middle East and Africa Market Value (USD Million) Forecast by Livestock Type, 2020-2035
  • Table 54: Middle East and Africa Market Value (USD Million) Forecast by Delivery Format, 2020-2035
  • Table 55: Middle East and Africa Market Value (USD Million) Forecast by Application Method, 2020-2035
  • Table 56: Middle East and Africa Market Value (USD Million) Forecast by Sales Channel, 2020-2035

List of Figures

  • Figure 1: Global Market Pricing Analysis
  • Figure 2: Global Market Value (USD Million) Forecast 2020-2035
  • Figure 3: Global Market Value Share and BPS Analysis by Mineral Type, 2025 and 2035
  • Figure 4: Global Market Y-o-Y Growth Comparison by Mineral Type, 2025-2035
  • Figure 5: Global Market Attractiveness Analysis by Mineral Type
  • Figure 6: Global Market Value Share and BPS Analysis by Source Form, 2025 and 2035
  • Figure 7: Global Market Y-o-Y Growth Comparison by Source Form, 2025-2035
  • Figure 8: Global Market Attractiveness Analysis by Source Form
  • Figure 9: Global Market Value Share and BPS Analysis by Functionality, 2025 and 2035
  • Figure 10: Global Market Y-o-Y Growth Comparison by Functionality, 2025-2035
  • Figure 11: Global Market Attractiveness Analysis by Functionality
  • Figure 12: Global Market Value Share and BPS Analysis by Livestock Type, 2025 and 2035
  • Figure 13: Global Market Y-o-Y Growth Comparison by Livestock Type, 2025-2035
  • Figure 14: Global Market Attractiveness Analysis by Livestock Type
  • Figure 15: Global Market Value Share and BPS Analysis by Delivery Format, 2025 and 2035
  • Figure 16: Global Market Y-o-Y Growth Comparison by Delivery Format, 2025-2035
  • Figure 17: Global Market Attractiveness Analysis by Delivery Format
  • Figure 18: Global Market Value Share and BPS Analysis by Application Method, 2025 and 2035
  • Figure 19: Global Market Y-o-Y Growth Comparison by Application Method, 2025-2035
  • Figure 20: Global Market Attractiveness Analysis by Application Method
  • Figure 21: Global Market Value Share and BPS Analysis by Sales Channel, 2025 and 2035
  • Figure 22: Global Market Y-o-Y Growth Comparison by Sales Channel, 2025-2035
  • Figure 23: Global Market Attractiveness Analysis by Sales Channel
  • Figure 24: Global Market Value (USD Million) Share and BPS Analysis by Region, 2025 and 2035
  • Figure 25: Global Market Y-o-Y Growth Comparison by Region, 2025-2035
  • Figure 26: Global Market Attractiveness Analysis by Region
  • Figure 27: North America Market Incremental $ Opportunity, 2025-2035
  • Figure 28: Latin America Market Incremental $ Opportunity, 2025-2035
  • Figure 29: Europe Market Incremental $ Opportunity, 2025-2035
  • Figure 30: East Asia Market Incremental $ Opportunity, 2025-2035
  • Figure 31: South Asia & Pacific Market Incremental $ Opportunity, 2025-2035
  • Figure 32: Middle East and Africa Market Incremental $ Opportunity, 2025-2035
  • Figure 33: North America Market Value Share and BPS Analysis by Country, 2025 and 2035
  • Figure 34: North America Market Value Share and BPS Analysis by Mineral Type, 2025 and 2035
  • Figure 35: North America Market Y-o-Y Growth Comparison by Mineral Type, 2025-2035
  • Figure 36: North America Market Attractiveness Analysis by Mineral Type
  • Figure 37: North America Market Value Share and BPS Analysis by Source Form, 2025 and 2035
  • Figure 38: North America Market Y-o-Y Growth Comparison by Source Form, 2025-2035
  • Figure 39: North America Market Attractiveness Analysis by Source Form
  • Figure 40: North America Market Value Share and BPS Analysis by Functionality, 2025 and 2035
  • Figure 41: North America Market Y-o-Y Growth Comparison by Functionality, 2025-2035
  • Figure 42: North America Market Attractiveness Analysis by Functionality
  • Figure 43: North America Market Value Share and BPS Analysis by Livestock Type, 2025 and 2035
  • Figure 44: North America Market Y-o-Y Growth Comparison by Livestock Type, 2025-2035
  • Figure 45: North America Market Attractiveness Analysis by Livestock Type
  • Figure 46: North America Market Value Share and BPS Analysis by Delivery Format, 2025 and 2035
  • Figure 47: North America Market Y-o-Y Growth Comparison by Delivery Format, 2025-2035
  • Figure 48: North America Market Attractiveness Analysis by Delivery Format
  • Figure 49: North America Market Value Share and BPS Analysis by Application Method, 2025 and 2035
  • Figure 50: North America Market Y-o-Y Growth Comparison by Application Method, 2025-2035
  • Figure 51: North America Market Attractiveness Analysis by Application Method
  • Figure 52: North America Market Value Share and BPS Analysis by Sales Channel, 2025 and 2035
  • Figure 53: North America Market Y-o-Y Growth Comparison by Sales Channel, 2025-2035
  • Figure 54: North America Market Attractiveness Analysis by Sales Channel
  • Figure 55: Latin America Market Value Share and BPS Analysis by Country, 2025 and 2035
  • Figure 56: Latin America Market Value Share and BPS Analysis by Mineral Type, 2025 and 2035
  • Figure 57: Latin America Market Y-o-Y Growth Comparison by Mineral Type, 2025-2035
  • Figure 58: Latin America Market Attractiveness Analysis by Mineral Type
  • Figure 59: Latin America Market Value Share and BPS Analysis by Source Form, 2025 and 2035
  • Figure 60: Latin America Market Y-o-Y Growth Comparison by Source Form, 2025-2035
  • Figure 61: Latin America Market Attractiveness Analysis by Source Form
  • Figure 62: Latin America Market Value Share and BPS Analysis by Functionality, 2025 and 2035
  • Figure 63: Latin America Market Y-o-Y Growth Comparison by Functionality, 2025-2035
  • Figure 64: Latin America Market Attractiveness Analysis by Functionality
  • Figure 65: Latin America Market Value Share and BPS Analysis by Livestock Type, 2025 and 2035
  • Figure 66: Latin America Market Y-o-Y Growth Comparison by Livestock Type, 2025-2035
  • Figure 67: Latin America Market Attractiveness Analysis by Livestock Type
  • Figure 68: Latin America Market Value Share and BPS Analysis by Delivery Format, 2025 and 2035
  • Figure 69: Latin America Market Y-o-Y Growth Comparison by Delivery Format, 2025-2035
  • Figure 70: Latin America Market Attractiveness Analysis by Delivery Format
  • Figure 71: Latin America Market Value Share and BPS Analysis by Application Method, 2025 and 2035
  • Figure 72: Latin America Market Y-o-Y Growth Comparison by Application Method, 2025-2035
  • Figure 73: Latin America Market Attractiveness Analysis by Application Method
  • Figure 74: Latin America Market Value Share and BPS Analysis by Sales Channel, 2025 and 2035
  • Figure 75: Latin America Market Y-o-Y Growth Comparison by Sales Channel, 2025-2035
  • Figure 76: Latin America Market Attractiveness Analysis by Sales Channel
  • Figure 77: Europe Market Value Share and BPS Analysis by Country, 2025 and 2035
  • Figure 78: Europe Market Value Share and BPS Analysis by Mineral Type, 2025 and 2035
  • Figure 79: Europe Market Y-o-Y Growth Comparison by Mineral Type, 2025-2035
  • Figure 80: Europe Market Attractiveness Analysis by Mineral Type
  • Figure 81: Europe Market Value Share and BPS Analysis by Source Form, 2025 and 2035
  • Figure 82: Europe Market Y-o-Y Growth Comparison by Source Form, 2025-2035
  • Figure 83: Europe Market Attractiveness Analysis by Source Form
  • Figure 84: Europe Market Value Share and BPS Analysis by Functionality, 2025 and 2035
  • Figure 85: Europe Market Y-o-Y Growth Comparison by Functionality, 2025-2035
  • Figure 86: Europe Market Attractiveness Analysis by Functionality
  • Figure 87: Europe Market Value Share and BPS Analysis by Livestock Type, 2025 and 2035
  • Figure 88: Europe Market Y-o-Y Growth Comparison by Livestock Type, 2025-2035
  • Figure 89: Europe Market Attractiveness Analysis by Livestock Type
  • Figure 90: Europe Market Value Share and BPS Analysis by Delivery Format, 2025 and 2035
  • Figure 91: Europe Market Y-o-Y Growth Comparison by Delivery Format, 2025-2035
  • Figure 92: Europe Market Attractiveness Analysis by Delivery Format
  • Figure 93: Europe Market Value Share and BPS Analysis by Application Method, 2025 and 2035
  • Figure 94: Europe Market Y-o-Y Growth Comparison by Application Method, 2025-2035
  • Figure 95: Europe Market Attractiveness Analysis by Application Method
  • Figure 96: Europe Market Value Share and BPS Analysis by Sales Channel, 2025 and 2035
  • Figure 97: Europe Market Y-o-Y Growth Comparison by Sales Channel, 2025-2035
  • Figure 98: Europe Market Attractiveness Analysis by Sales Channel
  • Figure 99: East Asia Market Value Share and BPS Analysis by Country, 2025 and 2035
  • Figure 100: East Asia Market Value Share and BPS Analysis by Mineral Type, 2025 and 2035
  • Figure 101: East Asia Market Y-o-Y Growth Comparison by Mineral Type, 2025-2035
  • Figure 102: East Asia Market Attractiveness Analysis by Mineral Type
  • Figure 103: East Asia Market Value Share and BPS Analysis by Source Form, 2025 and 2035
  • Figure 104: East Asia Market Y-o-Y Growth Comparison by Source Form, 2025-2035
  • Figure 105: East Asia Market Attractiveness Analysis by Source Form
  • Figure 106: East Asia Market Value Share and BPS Analysis by Functionality, 2025 and 2035
  • Figure 107: East Asia Market Y-o-Y Growth Comparison by Functionality, 2025-2035
  • Figure 108: East Asia Market Attractiveness Analysis by Functionality
  • Figure 109: East Asia Market Value Share and BPS Analysis by Livestock Type, 2025 and 2035
  • Figure 110: East Asia Market Y-o-Y Growth Comparison by Livestock Type, 2025-2035
  • Figure 111: East Asia Market Attractiveness Analysis by Livestock Type
  • Figure 112: East Asia Market Value Share and BPS Analysis by Delivery Format, 2025 and 2035
  • Figure 113: East Asia Market Y-o-Y Growth Comparison by Delivery Format, 2025-2035
  • Figure 114: East Asia Market Attractiveness Analysis by Delivery Format
  • Figure 115: East Asia Market Value Share and BPS Analysis by Application Method, 2025 and 2035
  • Figure 116: East Asia Market Y-o-Y Growth Comparison by Application Method, 2025-2035
  • Figure 117: East Asia Market Attractiveness Analysis by Application Method
  • Figure 118: East Asia Market Value Share and BPS Analysis by Sales Channel, 2025 and 2035
  • Figure 119: East Asia Market Y-o-Y Growth Comparison by Sales Channel, 2025-2035
  • Figure 120: East Asia Market Attractiveness Analysis by Sales Channel
  • Figure 121: South Asia & Pacific Market Value Share and BPS Analysis by Country, 2025 and 2035
  • Figure 122: South Asia & Pacific Market Value Share and BPS Analysis by Mineral Type, 2025 and 2035
  • Figure 123: South Asia & Pacific Market Y-o-Y Growth Comparison by Mineral Type, 2025-2035
  • Figure 124: South Asia & Pacific Market Attractiveness Analysis by Mineral Type
  • Figure 125: South Asia & Pacific Market Value Share and BPS Analysis by Source Form, 2025 and 2035
  • Figure 126: South Asia & Pacific Market Y-o-Y Growth Comparison by Source Form, 2025-2035
  • Figure 127: South Asia & Pacific Market Attractiveness Analysis by Source Form
  • Figure 128: South Asia & Pacific Market Value Share and BPS Analysis by Functionality, 2025 and 2035
  • Figure 129: South Asia & Pacific Market Y-o-Y Growth Comparison by Functionality, 2025-2035
  • Figure 130: South Asia & Pacific Market Attractiveness Analysis by Functionality
  • Figure 131: South Asia & Pacific Market Value Share and BPS Analysis by Livestock Type, 2025 and 2035
  • Figure 132: South Asia & Pacific Market Y-o-Y Growth Comparison by Livestock Type, 2025-2035
  • Figure 133: South Asia & Pacific Market Attractiveness Analysis by Livestock Type
  • Figure 134: South Asia & Pacific Market Value Share and BPS Analysis by Delivery Format, 2025 and 2035
  • Figure 135: South Asia & Pacific Market Y-o-Y Growth Comparison by Delivery Format, 2025-2035
  • Figure 136: South Asia & Pacific Market Attractiveness Analysis by Delivery Format
  • Figure 137: South Asia & Pacific Market Value Share and BPS Analysis by Application Method, 2025 and 2035
  • Figure 138: South Asia & Pacific Market Y-o-Y Growth Comparison by Application Method, 2025-2035
  • Figure 139: South Asia & Pacific Market Attractiveness Analysis by Application Method
  • Figure 140: South Asia & Pacific Market Value Share and BPS Analysis by Sales Channel, 2025 and 2035
  • Figure 141: South Asia & Pacific Market Y-o-Y Growth Comparison by Sales Channel, 2025-2035
  • Figure 142: South Asia & Pacific Market Attractiveness Analysis by Sales Channel
  • Figure 143: Middle East and Africa Market Value Share and BPS Analysis by Country, 2025 and 2035
  • Figure 144: Middle East and Africa Market Value Share and BPS Analysis by Mineral Type, 2025 and 2035
  • Figure 145: Middle East and Africa Market Y-o-Y Growth Comparison by Mineral Type, 2025-2035
  • Figure 146: Middle East and Africa Market Attractiveness Analysis by Mineral Type
  • Figure 147: Middle East and Africa Market Value Share and BPS Analysis by Source Form, 2025 and 2035
  • Figure 148: Middle East and Africa Market Y-o-Y Growth Comparison by Source Form, 2025-2035
  • Figure 149: Middle East and Africa Market Attractiveness Analysis by Source Form
  • Figure 150: Middle East and Africa Market Value Share and BPS Analysis by Functionality, 2025 and 2035
  • Figure 151: Middle East and Africa Market Y-o-Y Growth Comparison by Functionality, 2025-2035
  • Figure 152: Middle East and Africa Market Attractiveness Analysis by Functionality
  • Figure 153: Middle East and Africa Market Value Share and BPS Analysis by Livestock Type, 2025 and 2035
  • Figure 154: Middle East and Africa Market Y-o-Y Growth Comparison by Livestock Type, 2025-2035
  • Figure 155: Middle East and Africa Market Attractiveness Analysis by Livestock Type
  • Figure 156: Middle East and Africa Market Value Share and BPS Analysis by Delivery Format, 2025 and 2035
  • Figure 157: Middle East and Africa Market Y-o-Y Growth Comparison by Delivery Format, 2025-2035
  • Figure 158: Middle East and Africa Market Attractiveness Analysis by Delivery Format
  • Figure 159: Middle East and Africa Market Value Share and BPS Analysis by Application Method, 2025 and 2035
  • Figure 160: Middle East and Africa Market Y-o-Y Growth Comparison by Application Method, 2025-2035
  • Figure 161: Middle East and Africa Market Attractiveness Analysis by Application Method
  • Figure 162: Middle East and Africa Market Value Share and BPS Analysis by Sales Channel, 2025 and 2035
  • Figure 163: Middle East and Africa Market Y-o-Y Growth Comparison by Sales Channel, 2025-2035
  • Figure 164: Middle East and Africa Market Attractiveness Analysis by Sales Channel
  • Figure 165: Global Market - Tier Structure Analysis
  • Figure 166: Global Market - Company Share Analysis

Frequently Asked Questions

How big is the Precision Ruminant Minerals Market in 2025?

The global Precision Ruminant Minerals Market is estimated to be valued at USD 0.45 billion in 2025.

What will be the size of the Precision Ruminant Minerals Market in 2035?

The market size for the Precision Ruminant Minerals Market is projected to reach USD 0.77 billion by 2035.

How much will be the Precision Ruminant Minerals Market growth between 2025 and 2035?

The Precision Ruminant Minerals Market is expected to grow at a CAGR of 5.5% between 2025 and 2035.

What are the key product types in the Precision Ruminant Minerals Market?

The key mineral types in the Precision Ruminant Minerals Market are Macro Minerals, Trace Minerals, and Specialty/Functional Minerals.

Which functionality segment will contribute significant share in the Precision Ruminant Minerals Market in 2025?

In terms of functionality, Growth & Weight Gain is projected to command the largest share at 28.4% in 2025.

Explore Similar Insights

Future Market Insights

Precision Ruminant Minerals Market