Precision Planting Market Size and Share Forecast Outlook From 2024 to 2034

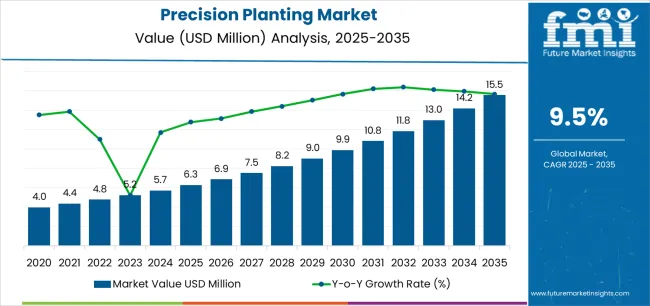
The precision planting market is estimated to be valued at USD 5.7 billion in 2024. The precision planting market is predicted to rise at a CAGR of 10% from 2024 to 2034. The global precision planting market is anticipated to reach USD 14.7 billion by 2034.

Precision planting technology has revolutionized modern agriculture by enhancing crop productivity, optimizing resource utilization, and improving environmental sustainability. This market snapshot encapsulates the key trends, innovations, and players driving the precision planting industry.

Precision planting involves the use of advanced technologies such as GPS, sensors, automation, and data analytics to precisely control the planting process, including seed placement, spacing, depth, and timing. By fine-tuning these variables, farmers can maximize yields, minimize input costs, and reduce environmental impact.

Attributes Key Insights
Estimated Market Size in 2024 USD 5.7 billion
Projected Market Value in 2034 USD 14.7 billion
Value-based CAGR from 2024 to 2034 10%

Comparison of Historical vs Future Outlook for the Precision Planting Market (2019 to 2023 vs 2024 to 2034)

From 2019 to 2023, the precision planting market experienced a CAGR of 12.4%. The adoption of precision planting technology gained momentum with the development of more advanced systems incorporating precision seed meters, automated row shut-off, and variable rate seeding capabilities. As precision planting systems became more affordable and accessible, adoption rates increased, particularly among larger farms in developed regions.

Ongoing advancements in sensor technology, automation, and data analytics will continue to drive innovation in precision planting systems, enabling farmers to achieve higher levels of accuracy, efficiency, and productivity in their planting operations.

Emerging agricultural markets, particularly in developing regions, will present significant growth opportunities for the precision planting market. As farmers in these regions seek to improve productivity and profitability, they will increasingly adopt precision planting solutions tailored to their specific needs and conditions.

As precision planting becomes increasingly integrated into mainstream agriculture, it will play a crucial role in shaping the future of farming and food production worldwide. Projections indicate that the global precision planting market is expected to experience a CAGR of 10% from 2024 to 2034.

Historical CAGR from 2019 to 2023 12.4%
Forecast CAGR from 2024 to 2034 10%

Key Drivers of Growth in the Precision Planting Market

  • The increased urbanization and rising income levels, present growth opportunities for precision planting technology as farmers seek to improve productivity and profitability.
  • Continuous innovation in precision planting technologies, such as GPS guidance systems, sensors, and automation, enhances planting accuracy, efficiency, and productivity, driving adoption among farmers.
  • Precision planting plays a crucial role in promoting sustainable farming practices by reducing input usage, minimizing environmental impact, and enhancing soil health. As consumers and regulators increasingly prioritize sustainability, the demand for precision planting solutions is expected to rise.
  • The agriculture industry is undergoing a digital transformation, with farmers embracing digital technologies to improve efficiency, productivity, and decision-making, driving market demand.

Key Challenges in the Precision Planting Market

  • Precision planting technology often requires significant upfront investment in equipment, sensors, software, and infrastructure.
  • Access to reliable high-speed internet connectivity is essential for leveraging the full potential of precision planting technology, particularly in rural or remote farming areas where infrastructure may be lacking.
  • Poor connectivity can hamper data transfer, remote monitoring, and software updates, limiting the effectiveness of precision planting solutions.
  • Uncertainty surrounding regulatory compliance and policy changes can create barriers to adoption and investment in precision planting systems.

Analysis of Top Countries Producing, Formulating, Packaging, Distributing, and Using Precision Planting Solutions

The provided table highlights the top five countries in terms of revenue, with Japan and South Korea leading the list. A strong emphasis on adopting innovative agricultural technologies to enhance productivity and efficiency in farming practices in Japan drives market growth.

The governments of South Korea have been actively promoting the adoption of precision agriculture technologies to address challenges related to food security, environmental sustainability, and rural development.

Countries Forecast CAGRs from 2024 to 2034
The United States 10.1%
The United Kingdom 10.5%
China 10.2%
Japan 11.5%
South Korea 11.1%

Farmers' Growing Recognition of Precision Agriculture's Yield Maximization Potential Fuelling Market in the United States

The precision planting market in the United States is expected to expand with a CAGR of 10.1% from 2024 to 2034. The United States has been at the forefront of technological innovation in agriculture, and precision planting is no exception.

Continuous advancements in GPS, sensors, automation, and data analytics have enabled farmers to adopt precision planting systems that offer higher accuracy, efficiency, and yield optimization.

The trend towards larger farm sizes and increased mechanization has driven demand for precision planting technology among large-scale farming operations in the United States Consolidation allows for greater economies of scale, making investments in precision planting equipment and technology more feasible and attractive.

Rising Adoption of Advanced Agricultural Technologies Drives Market Demand in the United Kingdom

Farmers in the United Kingdom are increasingly embracing precision agriculture technologies to improve efficiency, optimize resource use, and enhance productivity.

Precision planting is seen as a key component of this digital transformation, offering benefits such as improved seed placement, reduced input costs, and higher yields. The precision planting market in the United Kingdom is expected to expand with a CAGR of 10.5% from 2024 to 2034

The United Kingdom government has been supporting initiatives aimed at promoting sustainable agriculture practices and innovation in the farming sector. Funding programs, grants, and incentives are available to farmers investing in precision planting equipment and technologies, encouraging adoption and driving market growth.

Increased Government Support to Boost Market in China

China has one of the largest agricultural sectors globally, with a diverse range of crops grown across vast areas. Precision planting technologies offer significant benefits in terms of efficiency, productivity, and resource optimization, making them increasingly attractive to Chinese farmers. The precision planting market in China is expected to expand with a CAGR of 10.2% from 2024 to 2034

With a growing population and changing dietary patterns, there is a heightened focus on enhancing food security and self-sufficiency in China. Precision planting helps maximize agricultural productivity while minimizing resource inputs, contributing to food security goals.

The Chinese government has been actively promoting agricultural modernization and technological advancement as part of its broader rural development and food security initiatives. Policies, subsidies, and incentives are provided to encourage farmers to adopt precision planting technologies.

The Growing Need for Labor-Saving Solutions will continue to drive the Expansion of the Precision Planting Market in Japan.

The precision planting market in Japan is expected to expand with a CAGR of 11.5% from 2024 to 2034. Japan's farming population is aging, leading to a labor shortage and increased demand for labor saving technologies.

Precision planting systems, with their automation and efficiency-enhancing features, help address this challenge by reducing the need for manual labor and increasing productivity per worker.

The Japanese government has been actively promoting agricultural modernization and productivity improvement through policies, subsidies, and incentives. Initiatives such as the 'Agricultural ICT Promotion Plan' and the 'Next-Generation Agriculture Support Program' provide support for adopting precision planting technologies and other advanced agricultural practices. Precision planting technologies offer solutions to maximize productivity and optimize resource use in Japan's constrained agricultural landscape.

Sustainability in Agriculture Drives Market for Precision Planting in South Korea

South Korea is known for its advanced technology sector and its agricultural industry benefits from innovations in precision planting technology. Local companies develop and offer cutting-edge solutions incorporating GPS guidance, automated control, and data analytics to improve planting accuracy and efficiency.

Environmental concerns, including soil erosion, water scarcity, and pollution, are driving the adoption of precision planting technologies in South Korea.

By optimizing seed placement and reducing chemical inputs, precision planting helps minimize environmental impact and promote sustainable farming practices. The precision planting market in South Korea is expected to expand with a CAGR of 11.1% from 2024 to 2034

Precision Planting Industry Analysis by Top Investment Segments

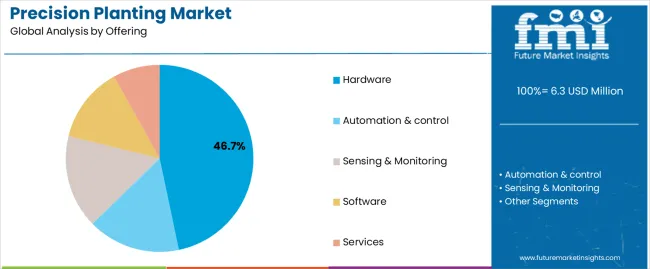
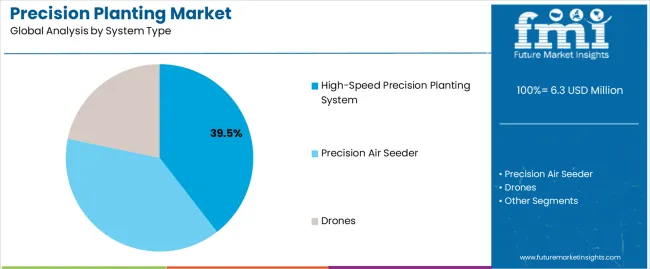
The below section shows the leading segment. The hardware segment is to rise at a CAGR of 9.8% from 2024 to 2034. Based on system type, the high-speed precision planting system segment is anticipated to hold a dominant share through 2034. It is set to exhibit a CAGR of 9.6% from 2024 to 2034.

Category CAGR
Hardware 9.8%
High-speed precision planting system 9.6%

Hardware Emerges as a Significant Segment in the Market

Based on the offering, the hardware segment is anticipated to thrive at a CAGR of 9.8% from 2024 to 2034. Hardware such as precision planters, seed meters, sensors, GPS receivers, and control systems are essential components of precision planting technology.

These hardware components are necessary for accurately planting seeds at the desired depth, spacing, and timing, which are critical factors for optimizing crop yields.

Precision planting hardware enables farmers to achieve high levels of precision and accuracy in their planting operations. Advanced technologies such as GPS guidance, variable rate seeding, and automated control systems ensure consistent seed placement, uniform plant spacing, and optimal plant populations, leading to improved crop performance and yield outcomes.

Precision planting hardware helps farmers increase efficiency and productivity by automating planting operations, reducing manual labor requirements, and enabling faster and more precise planting across large agricultural areas. This allows farmers to cover more ground in less time while maintaining planting accuracy and consistency.

High Speed Precision Planting System Segment is expected to Expand Substantially

Based on the system type, the high-speed precision planting system segment is anticipated to thrive at a CAGR of 9.6% from 2024 to 2034.

High-speed precision planting systems allow farmers to cover more ground in less time compared to traditional planting methods. By planting at higher speeds without sacrificing accuracy, farmers can complete planting operations more quickly, enabling them to take advantage of optimal planting windows and weather conditions.

Time is a critical factor in agriculture, especially during busy planting seasons. High-speed precision planting systems help farmers save time by reducing the time required to plant each acre of land. This allows farmers to manage larger acreages with fewer resources and labor hours, leading to increased operational efficiency.

With high-speed precision planting systems, farmers can plant more acres in a given period, resulting in improved productivity and higher overall yields. By maximizing planting efficiency, farmers can achieve higher crop yields while minimizing labor and equipment costs.
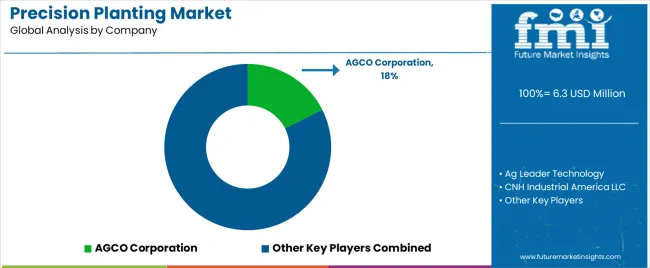
Competitive Landscape of the Precision Planting Market

Market players invest heavily in research and development to innovate and develop advanced precision planting technologies. This includes improving hardware components such as planters, seed meters, and sensors, as well as software solutions for data analytics, automation, and decision support systems.

Continuous technological innovation allows companies to offer cutting-edge solutions that meet the evolving needs of farmers and enhance their operational efficiency.

  • Ag Leader focuses on developing innovative precision planting solutions, including hardware such as GPS-guided planters and software for data analytics and decision support. The company provides extensive customer support services, including training, technical assistance, and software updates, to ensure farmers maximize the benefits of their precision planting technology.
  • AGCO offers a diverse range of precision planting equipment under brands like Fendt, Massey Ferguson, and Challenger, catering to different farm sizes and needs. AGCO emphasizes the integration of precision planting technology with other precision agriculture tools, such as guidance systems and telemetry, to provide comprehensive farm management solutions.

Key Coverage in the Precision Planting Market Report

  • Sales Forecast for Precision Planting in East Asia
  • Demand for Precision Planting in the United Kingdom
  • Strategies of Key Players of the Precision Planting Market
  • Recent Advances in Precision Planting Market
  • Promising Opportunities in Precision Planting in the Middle East and Africa Market

Scope and Coverage of the Precision Planting Market Report

Attributes Details
Estimated Market Size in 2024 USD 5.7 billion
Projected Market Valuation in 2034 USD 14.7 billion
Value-based CAGR 2024 to 2034 10%
Forecast Period 2024 to 2034
Historical Data Available for 2019 to 2023
Market Analysis Value in USD billion
Key Regions Covered north america; latin america; western europe; eastern europe; south asia and pacific; east asia; middle east and africa
Key Market Segments Covered offering, system type, drive type, crop type, region
Key Countries Profiled the united states, canada, brazil, mexico, germany, the united kingdom, france, spain, italy, russia, poland, czech republic, romania, india, bangladesh, australia, new zealand, china, japan, south korea, gcc countries, south africa, israel
Key Companies Profiled ag leader technology; agco corporation; cnh industrial america llc; kubota corporation; morris industries ltd.; precision ag solutions; precision seeding solutions; titan machinery; trimble inc.; vaderstad

Top Segments Studied in the Precision Planting Market

By Offering:

  • Hardware
    • Automation & control
    • Sensing & Monitoring
  • Software
  • Services

By System Type:

  • High-speed Precision Planting System
  • Precision Air Seeder
  • Drones

By Drive Type:

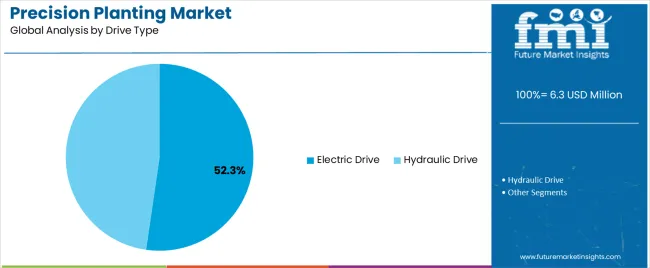
  • Electric drive
  • Hydraulic drive

By Crop Type:

  • Row crops
  • Grains, oilseeds & pulses
  • Forestry
  • Others

By Region:

  • North America
  • Latin America
  • Western Europe
  • Eastern Europe
  • South Asia and Pacific
  • East Asia
  • The Middle East and Africa

Table of Content

  • 1. Executive Summary
  • 2. Market Overview
  • 3. Market Background
  • 4. Global Market Analysis 2019 to 2023 and Forecast, 2024 to 2034
  • 5. Global Market Analysis 2019 to 2023 and Forecast 2024 to 2034, By Offering
    • 5.1. Hardware
      • 5.1.1. Automation & control
      • 5.1.2. Sensing & monitoring
    • 5.2. Software
    • 5.3. Services
  • 6. Global Market Analysis 2019 to 2023 and Forecast 2024 to 2034, By System Type
    • 6.1. High-speed precision planting system
    • 6.2. Precision air seeder
    • 6.3. Drones
  • 7. Global Market Analysis 2019 to 2023 and Forecast 2024 to 2034, By Drive Type
    • 7.1. Electric drive
    • 7.2. Hydraulic drive
  • 8. Global Market Analysis 2019 to 2023 and Forecast 2024 to 2034, By Crop Type
    • 8.1. Row crops
    • 8.2. Grains, oilseeds & pulses
    • 8.3. Forestry
    • 8.4. Others
  • 9. Global Market Analysis 2019 to 2023 and Forecast 2024 to 2034, By Region
    • 9.1. North America
    • 9.2. Latin America
    • 9.3. Western Europe
    • 9.4. Eastern Europe
    • 9.5. South Asia and Pacific
    • 9.6. East Asia
    • 9.7. Middle East and Africa
  • 10. North America Market Analysis 2019 to 2023 and Forecast 2024 to 2034, By Country
  • 11. Latin America Market Analysis 2019 to 2023 and Forecast 2024 to 2034, By Country
  • 12. Western Europe Market Analysis 2019 to 2023 and Forecast 2024 to 2034, By Country
  • 13. Eastern Europe Market Analysis 2019 to 2023 and Forecast 2024 to 2034, By Country
  • 14. South Asia and Pacific Market Analysis 2019 to 2023 and Forecast 2024 to 2034, By Country
  • 15. East Asia Market Analysis 2019 to 2023 and Forecast 2024 to 2034, By Country
  • 16. Middle East and Africa Market Analysis 2019 to 2023 and Forecast 2024 to 2034, By Country
  • 17. Key Countries Market Analysis
  • 18. Market Structure Analysis
  • 19. Competition Analysis
    • 19.1. Ag Leader Technology
    • 19.2. AGCO Corporation
    • 19.3. CNH Industrial America LLC
    • 19.4. KUBOTA Corporation
    • 19.5. Morris Industries Ltd.
    • 19.6. Precision Ag Solutions
    • 19.7. Precision Seeding Solutions
    • 19.8. Titan Machinery
    • 19.9. Trimble Inc.
    • 19.10. Vaderstad
  • 20. Assumptions & Acronyms Used
  • 21. Research Methodology

List of Tables

Table 1: Global Market Value (US$ Million) Forecast by Region, 2019 to 2034

Table 2: Global Market Value (US$ Million) Forecast by Offering, 2019 to 2034

Table 3: Global Market Value (US$ Million) Forecast by System Type, 2019 to 2034

Table 4: Global Market Value (US$ Million) Forecast by Drive Type, 2019 to 2034

Table 5: Global Market Value (US$ Million) Forecast by Crop Type, 2019 to 2034

Table 6: North America Market Value (US$ Million) Forecast by Country, 2019 to 2034

Table 7: North America Market Value (US$ Million) Forecast by Offering, 2019 to 2034

Table 8: North America Market Value (US$ Million) Forecast by System Type, 2019 to 2034

Table 9: North America Market Value (US$ Million) Forecast by Drive Type, 2019 to 2034

Table 10: North America Market Value (US$ Million) Forecast by Crop Type, 2019 to 2034

Table 11: Latin America Market Value (US$ Million) Forecast by Country, 2019 to 2034

Table 12: Latin America Market Value (US$ Million) Forecast by Offering, 2019 to 2034

Table 13: Latin America Market Value (US$ Million) Forecast by System Type, 2019 to 2034

Table 14: Latin America Market Value (US$ Million) Forecast by Drive Type, 2019 to 2034

Table 15: Latin America Market Value (US$ Million) Forecast by Crop Type, 2019 to 2034

Table 16: Western Europe Market Value (US$ Million) Forecast by Country, 2019 to 2034

Table 17: Western Europe Market Value (US$ Million) Forecast by Offering, 2019 to 2034

Table 18: Western Europe Market Value (US$ Million) Forecast by System Type, 2019 to 2034

Table 19: Western Europe Market Value (US$ Million) Forecast by Drive Type, 2019 to 2034

Table 20: Western Europe Market Value (US$ Million) Forecast by Crop Type, 2019 to 2034

Table 21: Eastern Europe Market Value (US$ Million) Forecast by Country, 2019 to 2034

Table 22: Eastern Europe Market Value (US$ Million) Forecast by Offering, 2019 to 2034

Table 23: Eastern Europe Market Value (US$ Million) Forecast by System Type, 2019 to 2034

Table 24: Eastern Europe Market Value (US$ Million) Forecast by Drive Type, 2019 to 2034

Table 25: Eastern Europe Market Value (US$ Million) Forecast by Crop Type, 2019 to 2034

Table 26: South Asia and Pacific Market Value (US$ Million) Forecast by Country, 2019 to 2034

Table 27: South Asia and Pacific Market Value (US$ Million) Forecast by Offering, 2019 to 2034

Table 28: South Asia and Pacific Market Value (US$ Million) Forecast by System Type, 2019 to 2034

Table 29: South Asia and Pacific Market Value (US$ Million) Forecast by Drive Type, 2019 to 2034

Table 30: South Asia and Pacific Market Value (US$ Million) Forecast by Crop Type, 2019 to 2034

Table 31: East Asia Market Value (US$ Million) Forecast by Country, 2019 to 2034

Table 32: East Asia Market Value (US$ Million) Forecast by Offering, 2019 to 2034

Table 33: East Asia Market Value (US$ Million) Forecast by System Type, 2019 to 2034

Table 34: East Asia Market Value (US$ Million) Forecast by Drive Type, 2019 to 2034

Table 35: East Asia Market Value (US$ Million) Forecast by Crop Type, 2019 to 2034

Table 36: Middle East and Africa Market Value (US$ Million) Forecast by Country, 2019 to 2034

Table 37: Middle East and Africa Market Value (US$ Million) Forecast by Offering, 2019 to 2034

Table 38: Middle East and Africa Market Value (US$ Million) Forecast by System Type, 2019 to 2034

Table 39: Middle East and Africa Market Value (US$ Million) Forecast by Drive Type, 2019 to 2034

Table 40: Middle East and Africa Market Value (US$ Million) Forecast by Crop Type, 2019 to 2034

List of Figures

Figure 1: Global Market Value (US$ Million) by Offering, 2024 to 2034

Figure 2: Global Market Value (US$ Million) by System Type, 2024 to 2034

Figure 3: Global Market Value (US$ Million) by Drive Type, 2024 to 2034

Figure 4: Global Market Value (US$ Million) by Crop Type, 2024 to 2034

Figure 5: Global Market Value (US$ Million) by Region, 2024 to 2034

Figure 6: Global Market Value (US$ Million) Analysis by Region, 2019 to 2034

Figure 7: Global Market Value Share (%) and BPS Analysis by Region, 2024 to 2034

Figure 8: Global Market Y-o-Y Growth (%) Projections by Region, 2024 to 2034

Figure 9: Global Market Value (US$ Million) Analysis by Offering, 2019 to 2034

Figure 10: Global Market Value Share (%) and BPS Analysis by Offering, 2024 to 2034

Figure 11: Global Market Y-o-Y Growth (%) Projections by Offering, 2024 to 2034

Figure 12: Global Market Value (US$ Million) Analysis by System Type, 2019 to 2034

Figure 13: Global Market Value Share (%) and BPS Analysis by System Type, 2024 to 2034

Figure 14: Global Market Y-o-Y Growth (%) Projections by System Type, 2024 to 2034

Figure 15: Global Market Value (US$ Million) Analysis by Drive Type, 2019 to 2034

Figure 16: Global Market Value Share (%) and BPS Analysis by Drive Type, 2024 to 2034

Figure 17: Global Market Y-o-Y Growth (%) Projections by Drive Type, 2024 to 2034

Figure 18: Global Market Value (US$ Million) Analysis by Crop Type, 2019 to 2034

Figure 19: Global Market Value Share (%) and BPS Analysis by Crop Type, 2024 to 2034

Figure 20: Global Market Y-o-Y Growth (%) Projections by Crop Type, 2024 to 2034

Figure 21: Global Market Attractiveness by Offering, 2024 to 2034

Figure 22: Global Market Attractiveness by System Type, 2024 to 2034

Figure 23: Global Market Attractiveness by Drive Type, 2024 to 2034

Figure 24: Global Market Attractiveness by Crop Type, 2024 to 2034

Figure 25: Global Market Attractiveness by Region, 2024 to 2034

Figure 26: North America Market Value (US$ Million) by Offering, 2024 to 2034

Figure 27: North America Market Value (US$ Million) by System Type, 2024 to 2034

Figure 28: North America Market Value (US$ Million) by Drive Type, 2024 to 2034

Figure 29: North America Market Value (US$ Million) by Crop Type, 2024 to 2034

Figure 30: North America Market Value (US$ Million) by Country, 2024 to 2034

Figure 31: North America Market Value (US$ Million) Analysis by Country, 2019 to 2034

Figure 32: North America Market Value Share (%) and BPS Analysis by Country, 2024 to 2034

Figure 33: North America Market Y-o-Y Growth (%) Projections by Country, 2024 to 2034

Figure 34: North America Market Value (US$ Million) Analysis by Offering, 2019 to 2034

Figure 35: North America Market Value Share (%) and BPS Analysis by Offering, 2024 to 2034

Figure 36: North America Market Y-o-Y Growth (%) Projections by Offering, 2024 to 2034

Figure 37: North America Market Value (US$ Million) Analysis by System Type, 2019 to 2034

Figure 38: North America Market Value Share (%) and BPS Analysis by System Type, 2024 to 2034

Figure 39: North America Market Y-o-Y Growth (%) Projections by System Type, 2024 to 2034

Figure 40: North America Market Value (US$ Million) Analysis by Drive Type, 2019 to 2034

Figure 41: North America Market Value Share (%) and BPS Analysis by Drive Type, 2024 to 2034

Figure 42: North America Market Y-o-Y Growth (%) Projections by Drive Type, 2024 to 2034

Figure 43: North America Market Value (US$ Million) Analysis by Crop Type, 2019 to 2034

Figure 44: North America Market Value Share (%) and BPS Analysis by Crop Type, 2024 to 2034

Figure 45: North America Market Y-o-Y Growth (%) Projections by Crop Type, 2024 to 2034

Figure 46: North America Market Attractiveness by Offering, 2024 to 2034

Figure 47: North America Market Attractiveness by System Type, 2024 to 2034

Figure 48: North America Market Attractiveness by Drive Type, 2024 to 2034

Figure 49: North America Market Attractiveness by Crop Type, 2024 to 2034

Figure 50: North America Market Attractiveness by Country, 2024 to 2034

Figure 51: Latin America Market Value (US$ Million) by Offering, 2024 to 2034

Figure 52: Latin America Market Value (US$ Million) by System Type, 2024 to 2034

Figure 53: Latin America Market Value (US$ Million) by Drive Type, 2024 to 2034

Figure 54: Latin America Market Value (US$ Million) by Crop Type, 2024 to 2034

Figure 55: Latin America Market Value (US$ Million) by Country, 2024 to 2034

Figure 56: Latin America Market Value (US$ Million) Analysis by Country, 2019 to 2034

Figure 57: Latin America Market Value Share (%) and BPS Analysis by Country, 2024 to 2034

Figure 58: Latin America Market Y-o-Y Growth (%) Projections by Country, 2024 to 2034

Figure 59: Latin America Market Value (US$ Million) Analysis by Offering, 2019 to 2034

Figure 60: Latin America Market Value Share (%) and BPS Analysis by Offering, 2024 to 2034

Figure 61: Latin America Market Y-o-Y Growth (%) Projections by Offering, 2024 to 2034

Figure 62: Latin America Market Value (US$ Million) Analysis by System Type, 2019 to 2034

Figure 63: Latin America Market Value Share (%) and BPS Analysis by System Type, 2024 to 2034

Figure 64: Latin America Market Y-o-Y Growth (%) Projections by System Type, 2024 to 2034

Figure 65: Latin America Market Value (US$ Million) Analysis by Drive Type, 2019 to 2034

Figure 66: Latin America Market Value Share (%) and BPS Analysis by Drive Type, 2024 to 2034

Figure 67: Latin America Market Y-o-Y Growth (%) Projections by Drive Type, 2024 to 2034

Figure 68: Latin America Market Value (US$ Million) Analysis by Crop Type, 2019 to 2034

Figure 69: Latin America Market Value Share (%) and BPS Analysis by Crop Type, 2024 to 2034

Figure 70: Latin America Market Y-o-Y Growth (%) Projections by Crop Type, 2024 to 2034

Figure 71: Latin America Market Attractiveness by Offering, 2024 to 2034

Figure 72: Latin America Market Attractiveness by System Type, 2024 to 2034

Figure 73: Latin America Market Attractiveness by Drive Type, 2024 to 2034

Figure 74: Latin America Market Attractiveness by Crop Type, 2024 to 2034

Figure 75: Latin America Market Attractiveness by Country, 2024 to 2034

Figure 76: Western Europe Market Value (US$ Million) by Offering, 2024 to 2034

Figure 77: Western Europe Market Value (US$ Million) by System Type, 2024 to 2034

Figure 78: Western Europe Market Value (US$ Million) by Drive Type, 2024 to 2034

Figure 79: Western Europe Market Value (US$ Million) by Crop Type, 2024 to 2034

Figure 80: Western Europe Market Value (US$ Million) by Country, 2024 to 2034

Figure 81: Western Europe Market Value (US$ Million) Analysis by Country, 2019 to 2034

Figure 82: Western Europe Market Value Share (%) and BPS Analysis by Country, 2024 to 2034

Figure 83: Western Europe Market Y-o-Y Growth (%) Projections by Country, 2024 to 2034

Figure 84: Western Europe Market Value (US$ Million) Analysis by Offering, 2019 to 2034

Figure 85: Western Europe Market Value Share (%) and BPS Analysis by Offering, 2024 to 2034

Figure 86: Western Europe Market Y-o-Y Growth (%) Projections by Offering, 2024 to 2034

Figure 87: Western Europe Market Value (US$ Million) Analysis by System Type, 2019 to 2034

Figure 88: Western Europe Market Value Share (%) and BPS Analysis by System Type, 2024 to 2034

Figure 89: Western Europe Market Y-o-Y Growth (%) Projections by System Type, 2024 to 2034

Figure 90: Western Europe Market Value (US$ Million) Analysis by Drive Type, 2019 to 2034

Figure 91: Western Europe Market Value Share (%) and BPS Analysis by Drive Type, 2024 to 2034

Figure 92: Western Europe Market Y-o-Y Growth (%) Projections by Drive Type, 2024 to 2034

Figure 93: Western Europe Market Value (US$ Million) Analysis by Crop Type, 2019 to 2034

Figure 94: Western Europe Market Value Share (%) and BPS Analysis by Crop Type, 2024 to 2034

Figure 95: Western Europe Market Y-o-Y Growth (%) Projections by Crop Type, 2024 to 2034

Figure 96: Western Europe Market Attractiveness by Offering, 2024 to 2034

Figure 97: Western Europe Market Attractiveness by System Type, 2024 to 2034

Figure 98: Western Europe Market Attractiveness by Drive Type, 2024 to 2034

Figure 99: Western Europe Market Attractiveness by Crop Type, 2024 to 2034

Figure 100: Western Europe Market Attractiveness by Country, 2024 to 2034

Figure 101: Eastern Europe Market Value (US$ Million) by Offering, 2024 to 2034

Figure 102: Eastern Europe Market Value (US$ Million) by System Type, 2024 to 2034

Figure 103: Eastern Europe Market Value (US$ Million) by Drive Type, 2024 to 2034

Figure 104: Eastern Europe Market Value (US$ Million) by Crop Type, 2024 to 2034

Figure 105: Eastern Europe Market Value (US$ Million) by Country, 2024 to 2034

Figure 106: Eastern Europe Market Value (US$ Million) Analysis by Country, 2019 to 2034

Figure 107: Eastern Europe Market Value Share (%) and BPS Analysis by Country, 2024 to 2034

Figure 108: Eastern Europe Market Y-o-Y Growth (%) Projections by Country, 2024 to 2034

Figure 109: Eastern Europe Market Value (US$ Million) Analysis by Offering, 2019 to 2034

Figure 110: Eastern Europe Market Value Share (%) and BPS Analysis by Offering, 2024 to 2034

Figure 111: Eastern Europe Market Y-o-Y Growth (%) Projections by Offering, 2024 to 2034

Figure 112: Eastern Europe Market Value (US$ Million) Analysis by System Type, 2019 to 2034

Figure 113: Eastern Europe Market Value Share (%) and BPS Analysis by System Type, 2024 to 2034

Figure 114: Eastern Europe Market Y-o-Y Growth (%) Projections by System Type, 2024 to 2034

Figure 115: Eastern Europe Market Value (US$ Million) Analysis by Drive Type, 2019 to 2034

Figure 116: Eastern Europe Market Value Share (%) and BPS Analysis by Drive Type, 2024 to 2034

Figure 117: Eastern Europe Market Y-o-Y Growth (%) Projections by Drive Type, 2024 to 2034

Figure 118: Eastern Europe Market Value (US$ Million) Analysis by Crop Type, 2019 to 2034

Figure 119: Eastern Europe Market Value Share (%) and BPS Analysis by Crop Type, 2024 to 2034

Figure 120: Eastern Europe Market Y-o-Y Growth (%) Projections by Crop Type, 2024 to 2034

Figure 121: Eastern Europe Market Attractiveness by Offering, 2024 to 2034

Figure 122: Eastern Europe Market Attractiveness by System Type, 2024 to 2034

Figure 123: Eastern Europe Market Attractiveness by Drive Type, 2024 to 2034

Figure 124: Eastern Europe Market Attractiveness by Crop Type, 2024 to 2034

Figure 125: Eastern Europe Market Attractiveness by Country, 2024 to 2034

Figure 126: South Asia and Pacific Market Value (US$ Million) by Offering, 2024 to 2034

Figure 127: South Asia and Pacific Market Value (US$ Million) by System Type, 2024 to 2034

Figure 128: South Asia and Pacific Market Value (US$ Million) by Drive Type, 2024 to 2034

Figure 129: South Asia and Pacific Market Value (US$ Million) by Crop Type, 2024 to 2034

Figure 130: South Asia and Pacific Market Value (US$ Million) by Country, 2024 to 2034

Figure 131: South Asia and Pacific Market Value (US$ Million) Analysis by Country, 2019 to 2034

Figure 132: South Asia and Pacific Market Value Share (%) and BPS Analysis by Country, 2024 to 2034

Figure 133: South Asia and Pacific Market Y-o-Y Growth (%) Projections by Country, 2024 to 2034

Figure 134: South Asia and Pacific Market Value (US$ Million) Analysis by Offering, 2019 to 2034

Figure 135: South Asia and Pacific Market Value Share (%) and BPS Analysis by Offering, 2024 to 2034

Figure 136: South Asia and Pacific Market Y-o-Y Growth (%) Projections by Offering, 2024 to 2034

Figure 137: South Asia and Pacific Market Value (US$ Million) Analysis by System Type, 2019 to 2034

Figure 138: South Asia and Pacific Market Value Share (%) and BPS Analysis by System Type, 2024 to 2034

Figure 139: South Asia and Pacific Market Y-o-Y Growth (%) Projections by System Type, 2024 to 2034

Figure 140: South Asia and Pacific Market Value (US$ Million) Analysis by Drive Type, 2019 to 2034

Figure 141: South Asia and Pacific Market Value Share (%) and BPS Analysis by Drive Type, 2024 to 2034

Figure 142: South Asia and Pacific Market Y-o-Y Growth (%) Projections by Drive Type, 2024 to 2034

Figure 143: South Asia and Pacific Market Value (US$ Million) Analysis by Crop Type, 2019 to 2034

Figure 144: South Asia and Pacific Market Value Share (%) and BPS Analysis by Crop Type, 2024 to 2034

Figure 145: South Asia and Pacific Market Y-o-Y Growth (%) Projections by Crop Type, 2024 to 2034

Figure 146: South Asia and Pacific Market Attractiveness by Offering, 2024 to 2034

Figure 147: South Asia and Pacific Market Attractiveness by System Type, 2024 to 2034

Figure 148: South Asia and Pacific Market Attractiveness by Drive Type, 2024 to 2034

Figure 149: South Asia and Pacific Market Attractiveness by Crop Type, 2024 to 2034

Figure 150: South Asia and Pacific Market Attractiveness by Country, 2024 to 2034

Figure 151: East Asia Market Value (US$ Million) by Offering, 2024 to 2034

Figure 152: East Asia Market Value (US$ Million) by System Type, 2024 to 2034

Figure 153: East Asia Market Value (US$ Million) by Drive Type, 2024 to 2034

Figure 154: East Asia Market Value (US$ Million) by Crop Type, 2024 to 2034

Figure 155: East Asia Market Value (US$ Million) by Country, 2024 to 2034

Figure 156: East Asia Market Value (US$ Million) Analysis by Country, 2019 to 2034

Figure 157: East Asia Market Value Share (%) and BPS Analysis by Country, 2024 to 2034

Figure 158: East Asia Market Y-o-Y Growth (%) Projections by Country, 2024 to 2034

Figure 159: East Asia Market Value (US$ Million) Analysis by Offering, 2019 to 2034

Figure 160: East Asia Market Value Share (%) and BPS Analysis by Offering, 2024 to 2034

Figure 161: East Asia Market Y-o-Y Growth (%) Projections by Offering, 2024 to 2034

Figure 162: East Asia Market Value (US$ Million) Analysis by System Type, 2019 to 2034

Figure 163: East Asia Market Value Share (%) and BPS Analysis by System Type, 2024 to 2034

Figure 164: East Asia Market Y-o-Y Growth (%) Projections by System Type, 2024 to 2034

Figure 165: East Asia Market Value (US$ Million) Analysis by Drive Type, 2019 to 2034

Figure 166: East Asia Market Value Share (%) and BPS Analysis by Drive Type, 2024 to 2034

Figure 167: East Asia Market Y-o-Y Growth (%) Projections by Drive Type, 2024 to 2034

Figure 168: East Asia Market Value (US$ Million) Analysis by Crop Type, 2019 to 2034

Figure 169: East Asia Market Value Share (%) and BPS Analysis by Crop Type, 2024 to 2034

Figure 170: East Asia Market Y-o-Y Growth (%) Projections by Crop Type, 2024 to 2034

Figure 171: East Asia Market Attractiveness by Offering, 2024 to 2034

Figure 172: East Asia Market Attractiveness by System Type, 2024 to 2034

Figure 173: East Asia Market Attractiveness by Drive Type, 2024 to 2034

Figure 174: East Asia Market Attractiveness by Crop Type, 2024 to 2034

Figure 175: East Asia Market Attractiveness by Country, 2024 to 2034

Figure 176: Middle East and Africa Market Value (US$ Million) by Offering, 2024 to 2034

Figure 177: Middle East and Africa Market Value (US$ Million) by System Type, 2024 to 2034

Figure 178: Middle East and Africa Market Value (US$ Million) by Drive Type, 2024 to 2034

Figure 179: Middle East and Africa Market Value (US$ Million) by Crop Type, 2024 to 2034

Figure 180: Middle East and Africa Market Value (US$ Million) by Country, 2024 to 2034

Figure 181: Middle East and Africa Market Value (US$ Million) Analysis by Country, 2019 to 2034

Figure 182: Middle East and Africa Market Value Share (%) and BPS Analysis by Country, 2024 to 2034

Figure 183: Middle East and Africa Market Y-o-Y Growth (%) Projections by Country, 2024 to 2034

Figure 184: Middle East and Africa Market Value (US$ Million) Analysis by Offering, 2019 to 2034

Figure 185: Middle East and Africa Market Value Share (%) and BPS Analysis by Offering, 2024 to 2034

Figure 186: Middle East and Africa Market Y-o-Y Growth (%) Projections by Offering, 2024 to 2034

Figure 187: Middle East and Africa Market Value (US$ Million) Analysis by System Type, 2019 to 2034

Figure 188: Middle East and Africa Market Value Share (%) and BPS Analysis by System Type, 2024 to 2034

Figure 189: Middle East and Africa Market Y-o-Y Growth (%) Projections by System Type, 2024 to 2034

Figure 190: Middle East and Africa Market Value (US$ Million) Analysis by Drive Type, 2019 to 2034

Figure 191: Middle East and Africa Market Value Share (%) and BPS Analysis by Drive Type, 2024 to 2034

Figure 192: Middle East and Africa Market Y-o-Y Growth (%) Projections by Drive Type, 2024 to 2034

Figure 193: Middle East and Africa Market Value (US$ Million) Analysis by Crop Type, 2019 to 2034

Figure 194: Middle East and Africa Market Value Share (%) and BPS Analysis by Crop Type, 2024 to 2034

Figure 195: Middle East and Africa Market Y-o-Y Growth (%) Projections by Crop Type, 2024 to 2034

Figure 196: Middle East and Africa Market Attractiveness by Offering, 2024 to 2034

Figure 197: Middle East and Africa Market Attractiveness by System Type, 2024 to 2034

Figure 198: Middle East and Africa Market Attractiveness by Drive Type, 2024 to 2034

Figure 199: Middle East and Africa Market Attractiveness by Crop Type, 2024 to 2034

Figure 200: Middle East and Africa Market Attractiveness by Country, 2024 to 2034

Frequently Asked Questions

What is the expected worth of the precision planting market in 2024?

As of 2024, the market for precision planting is expected to be valued at USD 5.7 billion.

What is the anticipated market value for the precision planting in 2034?

By 2034, the market value of precision planting is expected to reach USD 14.7 billion.

What is the projected forecast CAGR for the precision planting market from 2024 to 2034?

From 2024 to 2034, the Precision Planting market is expected to flourish at a CAGR of 10%.

Based on the offering, which segment dominates the precision planting market?

The hardware segment is expected to rise at a CAGR of 9.8% in 2024.

Which country is likely to be at the pinnacle in the precision planting ecosystem?

Japan is likely to ne the top-performing market, with an expected CAGR of 11.5%.

Explore Similar Insights

Future Market Insights

Precision Planting Market