Reports

- Global Locations -

Headquarters

Future Market Insights, Inc.

Christiana Corporate, 200
Continental Drive, Suite 401,
Newark, Delaware - 19713,
United States

T: +1-845-579-5705

Americas

Future Market Insights, Inc.

616 Corporate Way, Suite 2-9018,
Valley Cottage, NY 10989, United States

T: +1-347-918-3531

MEA

Future Market Insights

1602-6 Jumeirah Bay X2 Tower, Plot No: JLT-PH2-X2A,
Jumeirah Lakes Towers, Dubai,
United Arab Emirates

Europe

Future Market Insights

3rd Floor, 207 Regent Street,
W1B 3HH London
United Kingdom

T: + 44 (0) 20 8123 9659
D: +44 (0) 20 3287 4268

Asia Pacific

Future Market Insights

IndiaLand Global Tech Park, Unit UG-1, Behind Grand HighStreet, Phase 1, Hinjawadi, MH, Pune – 411057, India

Precision Chemicals Market Outlook (2023 to 2033)

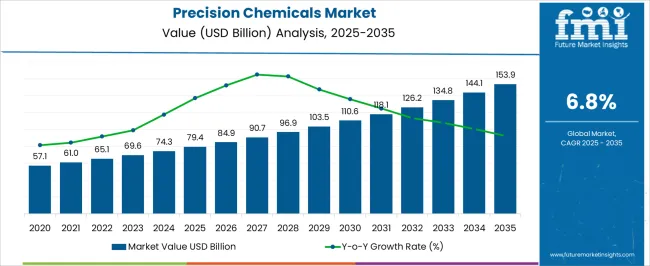
The market size is projected to be worth US$ 69,109.9 million in 2023. The market is likely to surpass US$ 138,512.2 million by 2033 at a CAGR of 7.2% during the forecast period. Precision and accuracy in chemical composition are crucial, especially when producing the required product preparation is essential. Precision chemicals are substances that have been specially created and produced to adhere to extremely high purity and accuracy requirements.

They are often used in processes including the manufacturing of pharmaceuticals, electronics, and cosmetics, where even minute levels of contaminants could have major effects. Modern manufacturing processes and quality control procedures are often used in the production of precision chemicals to ensure that they satisfy the highest requirements of accuracy and purity.

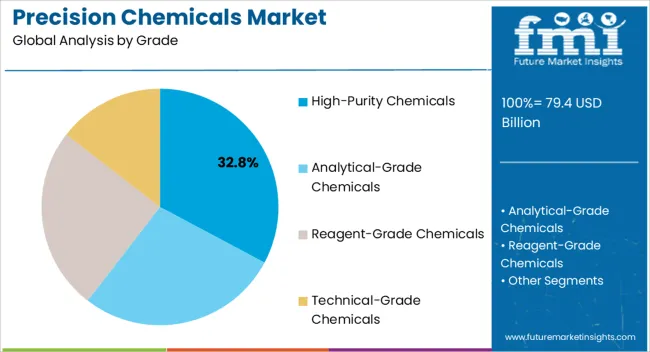
Different grades of these chemicals are available to satisfy various requirements, and they are often categorized based on their purity and accuracy. High-purity chemicals, analytical-grade chemicals, reagent-grade chemicals, and technical-grade chemicals are a few of the common types of chemicals. The purity and accuracy of a precision chemical establish its grade, which is used to guarantee the quality and consistency of the chemical in a particular application.

Other Drivers Propelling the Demand for Precision Chemicals include:

  • The demand for high-quality precision cleaning chemicals is a main driver in the market.
  • Growing customer preference for solvent-based cleaning chemicals, is propelling the expansion of the market.
  • The need to reduce environmental impact and develop environment-friendly compositions is driving the utilization of chemicals at the precise level
  • The Rising demand for precision farming and agriculture and the need for precise micro-chemicals is one of the primary reasons driving the market growth.
  • The growing demand for semiconductor-grade precision cleaners for silicon wafers, and medical devices are driving market growth.

Challenges for Companies /Manufacturers in the Market:

  • These chemicals are produced through advanced quality control processes and manufacturing techniques and these procedures are expensive in nature, which may make it difficult for manufacturers to produce this at competitive prices.
  • These compounds are produced and used under rigorous regulatory guidelines, which can be convoluted and challenging to understand. This can make it problematic for companies to manufacture and market these chemicals, especially in sectors with stringent standards.
  • As there are many technical or financial limitations, the production of some precision compounds is difficult or impossible. This could impede the supply of specific chemicals and make it difficult for companies to meet demand.
  • While sophisticated manufacturing processes and quality control procedures are often employed for producing precision compounds, there is still a chance of contamination during production. This may need adding quality control procedures and affect the final product's accuracy and purity.

Opportunities in the Market:

  • There is increasing pressure on producers to manufacture chemicals that are accurate and pure as consumers become discerning and require higher-quality products. As a result, companies that can make precise compounds will have the opportunity to fill this need.
  • The development of new production techniques, advanced manufacturing procedures, and microscopic level of quality and safety make it easier for companies to produce these compounds and create opportunities for manufacturers to enter the market and develops high-quality products.
  • Analytical chemicals are employed in quality assurance, regulatory compliance, and research and development in various end-use industries. Precision chemical production is becoming progressively more viable as a result of the rising demand for analytical chemicals.

Latest Trends in the Market:

  • The precision chemicals market is relatively small, and there are potential trends for expansion into new markets, such as the pharmaceutical and food and beverage industries.
  • In the field of medical and pharmaceuticals, there is a growing interest in high-precision cleaning chemicals and formulations. Researchers are exploring SEMI-grade cleaners, aqueous and non-aqueous cleaners. This approach allows for the production of these high-quality chemicals with detailed performance attributes and versatile functionalities.
Attribute Details
Precision Chemicals Market Size (2023) US$ 69,109.9 million
Precision Chemicals Market Projected Size (2033) US$ 138,512.2 million
Value CAGR (2023 to 2033) 7.2%

Don't pay for what you don't need

Customize your report by selecting specific countries or regions and save 30%!

2018 to 2022 Precision Chemicals Demand Outlook Compared to 2023 to 2033 Forecast

From 2018 to 2022, the global market experienced a CAGR of 6.8%, reaching a market size of US$ 69,109.9 million in 2023.

From 2018 to 2022, the global market witnessed steady growth due to the rising demand for the medical and pharmaceutical industry as sulfuric acid, nitric acid, and hydrofluoric acids can be used in implantable devices. The increasing demand for these compounds is driving the growth of the market.

Future Forecast for Precision Chemicals Industry

Looking ahead, the global market is expected to rise at a CAGR of 7.2% from 2023 to 2033. During the forecast period, the market size is expected to reach US$ 138,512.2 million.

From 2023 to 2033, these chemicals are projected to sustain their upward growth trend, primarily by the growing need for cleaning and polishing of silicon carbide, an extremely hard surface material utilized in power electrical systems and sophisticated communications, and wide band gap semiconductors (WBGS) devices The escalating demand for these chemicals in electronic and semiconductor industry is a key driver for the expansion of the market.

China, the U.S., Japan, and South Korea are the key contributors to the significant market share. Among them, China stands out as the prominent player, benefiting from its extensive semiconductor manufacturing capacity owing to this there is a need for these precision compounds. The end-use industries are expected to develop throughout the projection period, and regional governments will continue to invest in and support the market in North America and Asia-Pacific.

Nikhil Kaitwade
Nikhil Kaitwade

Principal Consultant

Talk to Analyst

Find your sweet spots for generating winning opportunities in this market.

Comparative View of the Precision Chemicals Market

Precision Chemicals Market:

Attributes Precision Chemicals Market
CAGR (2023 to 2033) 7.2%
Market Value (2033) US$ 138,512.2 million
Opportunity The development of new production techniques, advanced manufacturing procedures, and microscopic level of quality and safety make it easier for companies to produce these compounds and create opportunities for manufacturers to enter the market and develops high-quality products
Key Trends In the field of medical and pharmaceuticals, there is a growing interest in high-precision cleaning chemicals and formulations. Researchers are exploring SEMI-grade cleaners, aqueous and non-aqueous cleaners. This approach allows for the production of these high-quality chemicals with detailed performance attributes and versatile functionalities.

Fine Chemicals Market:

Attributes Fine Chemicals Market
CAGR (2023 to 2033) 6.8%
Market Value (2033) US$ 340,084.3 million
Opportunity Rising awareness of personal care and increased application of cleaning products are further supporting growth. Improved living standards and rising e-commerce activities would soon lead to increasing demand for cosmetics and personal care items. It is likely to surge demand for fine chemicals in the next ten years.
Key Trends There is a growing trend toward sustainable and environmentally friendly practices in various sectors. Fine chemicals are often used as catalysts, reagents, or intermediates in green chemistry processes.

Pharmaceutical Solvents Market:

Attributes Pharmaceutical Solvents Market
CAGR (2023 to 2033) 4.6%
Market Value (2033) US$ 6,100.5 million
Opportunity The rising demand for novel drug delivery development systems such as inhalation, transdermal patches, and implants drives the market growth. The popularity of natural solvents is increasing due to concern over environmental impacts. The growing advanced technology, such as nanotechnology is expected to boost the market size.
Key Trends Rising number of chronic diseases such as diabetes, the growing aging population, and the increasing demand for active pharmaceutical ingredients

Country-Wise Insights

The Research and Development Activities Ignite the Precision Chemicals Market, Transforming Formulations and Accelerating Manufacturing Procedures in the United States!

Country The United States
Market Size (US$ million) by End of Forecast Period (2033) US$ 26,036.3 million
CAGR % 2023 to End of Forecast (2033) 5.7%

The market in the United States is expected to reach a market share of US$ 26,036.3 million by 2033, expanding at a CAGR of 5.7%. The production of high-quality chemicals for use in research and development, quality control, and regulatory compliance is the primary focus of precision chemicals manufacturers in the United States. Technological advancements, a rise in the usage of chemicals such as Tri Acid Blend, silicone oil removers, etc. in research and development, and rising analytical chemical demand are some of the market-driving factors in the USA.

Growing Demand for Precision Micro chemicals in India's Agriculture Sector Set to Propel Market Growth!

Country India
Market Size (US$ million) by End of Forecast Period (2033) US$ 7,978.3 million
CAGR % 2023 to End of Forecast (2033) 6.9 %

The market in India is expected to reach a market share of US 7,978.3 million, expanding at a CAGR of 6.9% during the forecast period. Precision chemicals have emerged as a preferred choice in precision farming, and their demand continues to surge. A paradigm change in crop production and animal husbandry is referred to as precision farming, often known as smart agriculture which requires these agrochemicals compound. The rising adoption of 21st-century solutions by both commercial and intensive farms serves as the foundation for it. The "Internet of Things" (IoT), also known as Industry 4.0, which is driven by improved device connectivity and data integration, encompasses this in significant part.

The use of cutting-edge sensing technologies is essential to the IoT revolution in smart farming. These solutions give users a comprehensive understanding of all significant production factors, even down to the micro level. the demand for these chemicals in India is set to experience significant growth, propelling the overall market forward.

China's Precision Chemicals Market Set for Notable Growth as the Semiconductor and Electronic Industry Accelerates its Demand!

Country China
Market Size (US$ million) by End of Forecast Period (2033) US$ 48,724.6 million
CAGR % 2023 to End of Forecast (2033) 7.3%

The market in China is anticipated to reach a market share of US$ 48,724.6 million, moving at a CAGR of 7.3 % during the forecast period. Highly toxic precision chemicals are often used in the electronics and semiconductor manufacturing process. To ensure the reliability of the final product and high post-process quality, precision cleaning chemicals are crucial in the manufacturing of parts.

The requirement for higher standards of cleaning is increasing while also becoming more challenging in recent years as the structural design of parts has grown more sophisticated in accordance with the development of nanoscale processing technologies. China's market for precision chemicals is predicted to expand significantly over the next few years as a result of rising demand from the semiconductor and electronics industries.
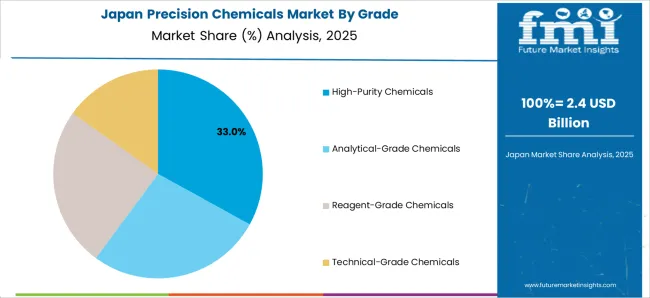
Increasing Adoption of Precision Chemicals in Pharmaceuticals to Drive Market Growth in Japan

Country Japan
Market Size (US$ million) by End of Forecast Period (2033) US$ 9,474.2 million
CAGR % 2023 to End of Forecast (2033) 6.4%

The market in Japan is estimated to reach a market share of US$ 9,474.2million by 2033, thriving at a CAGR of 6.4%. Pharmaceuticals are one of the fastest-growing industries in Japan owing to technological advancement, R and D innovations, and rising consumer demand for pharmaceutical products and nutritional supplements. The production and selling of medicines have to be done with extreme caution, accuracy, and quality, according to pharmaceutical manufacturers.

Starting with stringent regulations for raw materials and moving on to the storage conditions for finished medications and supplements that are eventually offered to patients. The market in Japan is predicted to grow owing to the increasing adoption of precision compounds in the pharmaceutical industry.

Get the data you need at a Fraction of the cost

Personalize your report by choosing insights you need
and save 40%!

Category-Wise Insights

How Cleaning Products is Driving the Precision Chemicals Market?

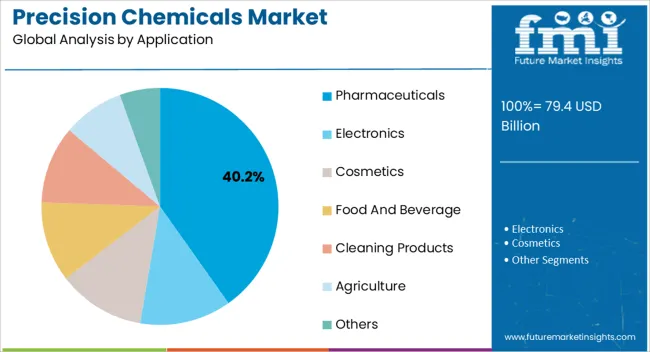
From 2022 to 2033, cleaning products are predicted to dominate the market with a CAGR of 5.8%. With the increasing demand for precise cleaning products from the semiconductor and electronics industry, the need for these compounds is anticipated to increase and will account for a large market share by 2023.

Water-based and semi-water-based cleaning chemicals are used instead of solvent-based (chlorides, hydrocarbon, fluorides, bromides, etc.). The simultaneous removal of organic and inorganic contaminants is made possible by the use of surfactants to penetrate, emulsify, disperse, and prevent reattachment.

This increases the demand for water-based and semi-water-based cleansers, which both have a lower environmental effect and have higher cleaning performance. The market is witnessing growth due to the rising awareness of water-based precision chemicals in cleaning applications.

What factors are boosting the demand for Precision Chemicals application in Agriculture?

The Agrochemical industry is expected to dominate the market with a CAGR of 5.3% from 2022 to 2033. The productivity and operational efficiencies of the world agriculture sector can be greatly increased by precision agrochemicals and insecticides.

To bring the existing, antiquated systems up to date, careful monitoring and substantial changes are required. The agrochemical sector has seen several changes and trials, involving everything from equipment to safety protocols and regulations. Due to the rising demand, the precision chemical process has emerged as one of the most sought-after services. The growing need for precise and accurate concentrations of chemicals in fungicides, pesticides, and precise micro chemicals is expected to fuel the demand for precision compounds
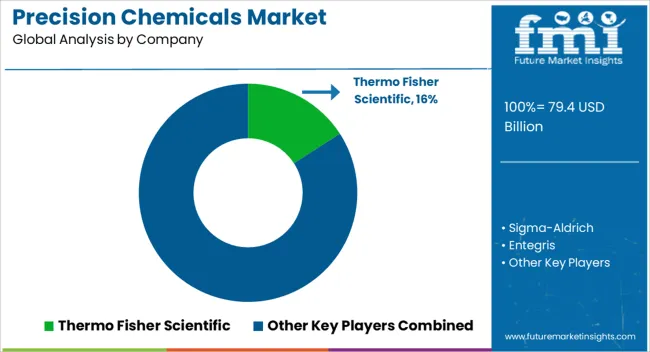
How do Key Players Stay Competitive in the market?

The market is highly consolidated, with key players having a significant market share. Key players in the industry are focusing on the development of advanced technology for the manufacturing of these precision chemicals, for various applications such as pharmaceuticals, cosmetics, semiconductors, and electronics. They are also expanding their product portfolio to include new and emerging applications, such as high-precision cleaning agents, medical cleaning agents, and semiconductor-grade precision cleaners this helps them to reach a wider range of customers and grow their business.

Key Strategies Adopted by the Players

  • Investment in R and D

Market participants are actively developing a range of precision chemicals that demonstrate both excellent environmental and precise performance. An example of this is Fujifilm (China) Investment Co., Ltd. developing new areas for precision chemical manufacturers. Utilizing the expertise and technology it has gained in the field of photographic film, the company is expanding its operations into three new sectors: healthcare, materials, and imaging.

  • Acquisitions and Partnerships

Key players are engaged in acquisitions and partnerships to broaden their range of chemicals and extend their market reach. An example of this strategic approach is BASF SE and Entegris company have signed an agreement on the sale of the Precision Micro chemicals business to Entegris for $90 million.

Key Players in the Market

  • Precision Chemical, LLC
  • RECKLI
  • Precision Chemical Manufacturing Ltd
  • Precision Chemical Technologies Inc.
  • Entegris
  • Sigma-Aldrich
  • Thermo Fisher Scientific
  • Fujifilm (China) Investment Co., Ltd.
  • NuGenTec
  • Precision Alloys and Chemicals
  • CABB Group GmbH

Key Developments in the Market:

  • In 2021- Entegris – a leading global player in specialty chemicals and advanced materials solutions for the microelectronics industry acquired Precision Micro chemicals business is part of the Surface Treatment business unit of BASF’s Coatings division, operating under the Chemetall brand.

Segmentation Analysis of the Market

By Grade:

  • High-purity chemicals
  • Analytical-grade chemicals
  • Reagent-grade chemicals
  • Technical-grade chemicals

By Product Type:

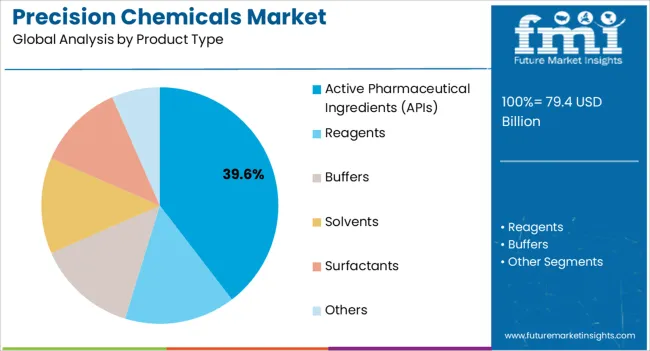
  • Reagents
  • Buffers
  • Active pharmaceutical ingredients (APIs)
  • Solvents
  • Surfactants
  • Others

By Application:

  • Pharmaceuticals
  • Electronics
  • Cosmetics
  • Food and beverage
  • Cleaning products
  • Agriculture
  • Others

By Region:

  • North America
  • Latin America
  • Western Europe
  • Eastern Europe
  • East Asia
  • South Asia and Pacific
  • The Middle East and Africa

Frequently Asked Questions

What is the Current Precision Chemicals Market Valuation?

The precision chemicals market is pegged at a value of US$ 69,109.9 million in 2023.

What is the Projected Size of the Precision Chemicals Market by 2033?

The precision chemicals market is estimated to reach US$ 138,512.2 million by 2033.

What is the projected CAGR for the Precision Chemicals Market?

Sales of precision chemicals are anticipated to surge at a CAGR of 7.2% through 2033.

Which Country Demonstrates Significant Profit Potential for Precision Chemicals?

China demonstrates remarkable profit potential for precision chemicals, with a projected revenue of US$ 48,724.6 million by 2033, driven by robust manufacturing.

How was the Historical Performance of the Precision Chemicals Market?

The global precision chemicals market demonstrated a CAGR of 6.8% between 2018 and 2022.

Table of Content

1. Executive Summary

    1.1. Global Market Outlook

    1.2. Demand Side Trends

    1.3. Supply Side Trends

    1.4. Grade Roadmap

    1.5. Analysis and Recommendations

2. Market Overview

    2.1. Market Coverage / Taxonomy

    2.2. Market Definition / Scope / Limitations

3. Key Market Trends

    3.1. Key Trends Impacting the Market

    3.2. Material Innovation / Development Trends

4. Key Success Factors

    4.1. Material Adoption / Usage Analysis

    4.2. Material USPs / Features

    4.3. Strategic Promotional Strategies

5. Global Market Demand Analysis 2018 to 2022 and Forecast, 2023 to 2033

    5.1. Historical Market Volume (Tons) Analysis, 2018 to 2022

    5.2. Current and Future Market Volume (Tons) Projections, 2023 to 2033

    5.3. Y-o-Y Growth Trend Analysis

6. Global Market - Pricing Analysis

    6.1. Regional Pricing Analysis

    6.2. Global Average Pricing Analysis Benchmark

7. Global Market Demand (in Value or Size in US$ Million) Analysis 2018 to 2022 and Forecast, 2023 to 2033

    7.1. Historical Market Value (US$ Million) Analysis, 2018 to 2022

    7.2. Current and Future Market Value (US$ Million) Projections, 2023 to 2033

        7.2.1. Y-o-Y Growth Trend Analysis

        7.2.2. Absolute $ Opportunity Analysis

8. Market Background

    8.1. Macro-Economic Factors

    8.2. Forecast Factors - Relevance and Impact

    8.3. Value Chain

        8.3.1. Material Manufacturers

        8.3.2. Distributors

        8.3.3. Probable End-Users

        8.3.4. Avrg. Profitability Margin

    8.4. COVID-19 Crisis – Impact Assessment

        8.4.1. Current Statistics

        8.4.2. Short-Mid-Long Term Outlook

        8.4.3. Likely Rebound

    8.5. Market Dynamics

        8.5.1. Drivers

        8.5.2. Restraints

        8.5.3. Opportunity Analysis

    8.6. Global Supply Demand Analysis

    8.7. Key Developments

    8.8. Patent Analysis

9. Global Market Analysis 2018 to 2022 and Forecast 2023 to 2033, by Product Type

    9.1. Introduction / Key Findings

    9.2. Historical Market Size (US$ Million) and Volume (Tons) Analysis by Product Type, 2018 to 2022

    9.3. Current and Future Market Size (US$ Million) and Volume Analysis and Forecast by Product Type, 2023 to 2033

            9.3.1.1. Reagents

            9.3.1.2. Buffers

            9.3.1.3. Active pharmaceutical ingredients (APIs)

            9.3.1.4. Solvents

            9.3.1.5. Surfactants

            9.3.1.6. Others

    9.4. Market Attractiveness Analysis by Product Type

10. Global Market Analysis 2018 to 2022 and Forecast 2023 to 2033, by Grade

    10.1. Introduction / Key Findings

    10.2. Historical Market Size (US$ Million) and Volume (Tons) Analysis by Grade, 2018 to 2022

    10.3. Current and Future Market Size (US$ Million) and Volume Analysis and Forecast by Grade, 2023 to 2033

        10.3.1. High-purity chemicals

        10.3.2. Analytical-grade chemicals

        10.3.3. Reagent-grade chemicals

        10.3.4. Technical-grade chemicals

    10.4. Market Attractiveness Analysis by Grade

11. Global Market Analysis 2018 to 2022 and Forecast 2023 to 2033, by Application

    11.1. Introduction / Key Findings

    11.2. Historical Market Size (US$ Million) and Volume (Tons) Analysis by Application, 2018 to 2022

    11.3. Current and Future Market Size (US$ Million) and Volume Analysis and Forecast by Application, 2023 to 2033

            11.3.1.1. Pharmaceuticals

            11.3.1.2. Electronics

            11.3.1.3. Cosmetics

            11.3.1.4. Food and beverage

            11.3.1.5. Cleaning products

            11.3.1.6. Agriculture

            11.3.1.7. Others

    11.4. Market Attractiveness Analysis by Application

12. Global Market Analysis 2018 to 2022 and Forecast 2023 to 2033, by Region

    12.1. Introduction

    12.2. Historical Market Size (US$ Million) and Volume (Tons) Analysis by Region, 2018 to 2022

    12.3. Current Market Size (US$ Million) and Volume (Tons) Analysis and Forecast by Region, 2023 to 2033

        12.3.1. North America

        12.3.2. Latin America

        12.3.3. East Asia

        12.3.4. South Asia and Pacific

        12.3.5. Western Europe

        12.3.6. Eastern Europe

        12.3.7. Middle East and Africa

    12.4. Market Attractiveness Analysis by Region

13. North America Market Analysis 2018 to 2022 and Forecast 2023 to 2033

    13.1. Introduction

    13.2. Pricing Analysis

    13.3. Historical Market Size (US$ Million) and Volume Trend Analysis by Market Taxonomy, 2018 to 2022

    13.4. Market Size (US$ Million) and Volume Forecast by Market Taxonomy, 2023 to 2033

        13.4.1. by Country

            13.4.1.1. U.S.

            13.4.1.2. Canada

        13.4.2. by Product Type

        13.4.3. by Grade

        13.4.4. by Application

    13.5. Market Attractiveness Analysis

        13.5.1. by Country

        13.5.2. by Product Type

        13.5.3. by Grade

        13.5.4. by Application

    13.6. Key Market Participants - Intensity Mapping

14. Latin America Market Analysis 2018 to 2022 and Forecast 2023 to 2033

    14.1. Introduction

    14.2. Pricing Analysis

    14.3. Historical Market Size (US$ Million) and Volume Trend Analysis by Market Taxonomy, 2018 to 2022

    14.4. Market Size (US$ Million) and Volume Forecast by Market Taxonomy, 2023 to 2033

        14.4.1. by Country

            14.4.1.1. Brazil

            14.4.1.2. Mexico

            14.4.1.3. Argentina

        14.4.2. by Product Type

        14.4.3. by Grade

        14.4.4. by Application

    14.5. Market Attractiveness Analysis

        14.5.1. by Country

        14.5.2. by Product Type

        14.5.3. by Grade

        14.5.4. by Application

    14.6. Key Market Participants - Intensity Mapping

15. East Asia Market Analysis 2018 to 2022 and Forecast 2023 to 2033

    15.1. Introduction

    15.2. Pricing Analysis

    15.3. Historical Market Size (US$ Million) and Volume Trend Analysis by Market Taxonomy, 2018 to 2022

    15.4. Market Size (US$ Million) and Volume Forecast by Market Taxonomy, 2023 to 2033

        15.4.1. by Country

            15.4.1.1. China

            15.4.1.2. Japan

            15.4.1.3. South Korea

        15.4.2. by Product Type

        15.4.3. by Grade

        15.4.4. by Application

    15.5. Market Attractiveness Analysis

        15.5.1. by Country

        15.5.2. by Product Type

        15.5.3. by Grade

        15.5.4. by Application

    15.6. Key Market Participants - Intensity Mapping

16. South Asia and Pacific Market Analysis 2018 to 2022 and Forecast 2023 to 2033

    16.1. Introduction

    16.2. Pricing Analysis

    16.3. Historical Market Size (US$ Million) and Volume Trend Analysis by Market Taxonomy, 2018 to 2022

    16.4. Market Size (US$ Million) and Volume Forecast by Market Taxonomy, 2023 to 2033

        16.4.1. by Country

            16.4.1.1. India

            16.4.1.2. The Association of Southeast Asian Nations

            16.4.1.3. ANZ

        16.4.2. by Product Type

        16.4.3. by Grade

        16.4.4. by Application

    16.5. Market Attractiveness Analysis

        16.5.1. by Country

        16.5.2. by Product Type

        16.5.3. by Grade

        16.5.4. by Application

    16.6. Key Market Participants - Intensity Mapping

17. Western Europe Market Analysis 2018 to 2022 and Forecast 2023 to 2033

    17.1. Introduction

    17.2. Pricing Analysis

    17.3. Historical Market Size (US$ Million) and Volume Trend Analysis by Market Taxonomy, 2018 to 2022

    17.4. Market Size (US$ Million) and Volume Forecast by Market Taxonomy, 2023 to 2033

        17.4.1. by Country

            17.4.1.1. Germany

            17.4.1.2. Italy

            17.4.1.3. France

            17.4.1.4. U.K.

            17.4.1.5. Spain

            17.4.1.6. BENELUX

            17.4.1.7. NORDICS

            17.4.1.8. Rest of Western Europe

        17.4.2. by Product Type

        17.4.3. by Grade

        17.4.4. by Application

    17.5. Market Attractiveness Analysis

        17.5.1. by Country

        17.5.2. by Product Type

        17.5.3. by Grade

        17.5.4. by Application

    17.6. Key Market Participants - Intensity Mapping

18. Eastern Europe Market Analysis 2018 to 2022 and Forecast 2023 to 2033

    18.1. Introduction

    18.2. Pricing Analysis

    18.3. Historical Market Size (US$ Million) and Volume Trend Analysis by Market Taxonomy, 2018 to 2022

    18.4. Market Size (US$ Million) and Volume Forecast by Market Taxonomy, 2023 to 2033

        18.4.1. by Country

            18.4.1.1. Poland

            18.4.1.2. Hungary

            18.4.1.3. Romania

            18.4.1.4. Czech Republic

            18.4.1.5. Rest of Eastern Europe

        18.4.2. by Product Type

        18.4.3. by Grade

        18.4.4. by Application

    18.5. Market Attractiveness Analysis

        18.5.1. by Country

        18.5.2. by Product Type

        18.5.3. by Grade

        18.5.4. by Application

    18.6. Key Market Participants - Intensity Mapping

19. Middle East and Africa Market Analysis 2018 to 2022 and Forecast 2023 to 2033

    19.1. Introduction

    19.2. Pricing Analysis

    19.3. Historical Market Size (US$ Million) and Volume Trend Analysis by Market Taxonomy, 2018 to 2022

    19.4. Market Size (US$ Million) and Volume Forecast by Market Taxonomy, 2023 to 2033

        19.4.1. by Country

            19.4.1.1. Gulf Cooperation Council

            19.4.1.2. Türkiye

            19.4.1.3. Northern Africa

            19.4.1.4. South Africa

            19.4.1.5. Rest of Middle East and Africa

        19.4.2. by Product Type

        19.4.3. by Grade

        19.4.4. by Application

    19.5. Market Attractiveness Analysis

        19.5.1. by Country

        19.5.2. by Product Type

        19.5.3. by Grade

        19.5.4. by Application

    19.6. Key Market Participants - Intensity Mapping

20. Country Wise Market Analysis

    20.1. U.S. Market Analysis

        20.1.1. by Product Type

        20.1.2. by Grade

        20.1.3. by Application

    20.2. Canada Market Analysis

        20.2.1. by Product Type

        20.2.2. by Grade

        20.2.3. by Application

    20.3. Mexico Market Analysis

        20.3.1. by Product Type

        20.3.2. by Grade

        20.3.3. by Application

    20.4. Brazil Market Analysis

        20.4.1. by Product Type

        20.4.2. by Grade

        20.4.3. by Application

    20.5. Argentina Market Analysis

        20.5.1. by Product Type

        20.5.2. by Grade

        20.5.3. by Application

    20.6. China Market Analysis

        20.6.1. by Product Type

        20.6.2. by Grade

        20.6.3. by Application

    20.7. Japan Market Analysis

        20.7.1. by Product Type

        20.7.2. by Grade

        20.7.3. by Application

    20.8. S. Korea Market Analysis

        20.8.1. by Product Type

        20.8.2. by Grade

        20.8.3. by Application

    20.9. India Market Analysis

        20.9.1. by Product Type

        20.9.2. by Grade

        20.9.3. by Application

    20.10. The Association of Southeast Asian Nations Market Analysis

        20.10.1. by Product Type

        20.10.2. by Grade

        20.10.3. by Application

    20.11. Australia and New Zealand Market Analysis

        20.11.1. by Product Type

        20.11.2. by Grade

        20.11.3. by Application

    20.12. Germany Market Analysis

        20.12.1. by Product Type

        20.12.2. by Grade

        20.12.3. by Application

    20.13. Italy Market Analysis

        20.13.1. by Product Type

        20.13.2. by Grade

        20.13.3. by Application

    20.14. France Market Analysis

        20.14.1. by Product Type

        20.14.2. by Grade

        20.14.3. by Application

    20.15. U.K. Market Analysis

        20.15.1. by Product Type

        20.15.2. by Grade

        20.15.3. by Application

    20.16. Spain Market Analysis

        20.16.1. by Product Type

        20.16.2. by Grade

        20.16.3. by Application

    20.17. BENELUX Market Analysis

        20.17.1. by Product Type

        20.17.2. by Grade

        20.17.3. by Application

    20.18. NORDICS Market Analysis

        20.18.1. by Product Type

        20.18.2. by Grade

        20.18.3. by Application

    20.19. Poland Market Analysis

        20.19.1. by Product Type

        20.19.2. by Grade

        20.19.3. by Application

    20.20. Hungary Market Analysis

        20.20.1. by Product Type

        20.20.2. by Grade

        20.20.3. by Application

    20.21. Romania Market Analysis

        20.21.1. by Product Type

        20.21.2. by Grade

        20.21.3. by Application

    20.22. Czech Republic Market Analysis

        20.22.1. by Product Type

        20.22.2. by Grade

        20.22.3. by Application

    20.23. Gulf Cooperation Council Market Analysis

        20.23.1. by Product Type

        20.23.2. by Grade

        20.23.3. by Application

    20.24. Türkiye Market Analysis

        20.24.1. by Product Type

        20.24.2. by Grade

        20.24.3. by Application

    20.25. Northern Africa Market Analysis

        20.25.1. by Product Type

        20.25.2. by Grade

        20.25.3. by Application

    20.26. South Africa Market Analysis

        20.26.1. by Product Type

        20.26.2. by Grade

        20.26.3. by Application

21. Market Structure Analysis

    21.1. Market Analysis by Tier of Companies (Precision Chemicals)

    21.2. Market Share Analysis of Top Players

    21.3. Market Presence Analysis

22. Competition Analysis

    22.1. Competition Dashboard

    22.2. Competition Benchmarking

    22.3. Competition Deep Dive

        22.3.1. BASF SE

            22.3.1.1. Overview

            22.3.1.2. Material Portfolio

            22.3.1.3. Profitability by Market Segments (Material/Channel/Region)

            22.3.1.4. Sales Footprint

            22.3.1.5. Strategy Overview

        22.3.2. Precision Chemical, LLC

            22.3.2.1. Overview

            22.3.2.2. Material Portfolio

            22.3.2.3. Profitability by Market Segments (Material/Channel/Region)

            22.3.2.4. Sales Footprint

            22.3.2.5. Strategy Overview

        22.3.3. RECKLI

            22.3.3.1. Overview

            22.3.3.2. Material Portfolio

            22.3.3.3. Profitability by Market Segments (Material/Channel/Region)

            22.3.3.4. Sales Footprint

            22.3.3.5. Strategy Overview

        22.3.4. Precision Chemical Manufacturing Ltd

            22.3.4.1. Overview

            22.3.4.2. Material Portfolio

            22.3.4.3. Profitability by Market Segments (Material/Channel/Region)

            22.3.4.4. Sales Footprint

            22.3.4.5. Strategy Overview

        22.3.5. Precision Chemical Technologies Inc.

            22.3.5.1. Overview

            22.3.5.2. Material Portfolio

            22.3.5.3. Profitability by Market Segments (Material/Channel/Region)

            22.3.5.4. Sales Footprint

            22.3.5.5. Strategy Overview

        22.3.6. Entegris

            22.3.6.1. Overview

            22.3.6.2. Material Portfolio

            22.3.6.3. Profitability by Market Segments (Material/Channel/Region)

            22.3.6.4. Sales Footprint

            22.3.6.5. Strategy Overview

        22.3.7. Sigma-Aldrich

            22.3.7.1. Overview

            22.3.7.2. Material Portfolio

            22.3.7.3. Profitability by Market Segments (Material/Channel/Region)

            22.3.7.4. Sales Footprint

            22.3.7.5. Strategy Overview

        22.3.8. Thermo Fisher Scientific

            22.3.8.1. Overview

            22.3.8.2. Material Portfolio

            22.3.8.3. Profitability by Market Segments (Material/Channel/Region)

            22.3.8.4. Sales Footprint

            22.3.8.5. Strategy Overview

        22.3.9. Fujifilm (China) Investment Co., Ltd.

            22.3.9.1. Overview

            22.3.9.2. Material Portfolio

            22.3.9.3. Profitability by Market Segments (Material/Channel/Region)

            22.3.9.4. Sales Footprint

            22.3.9.5. Strategy Overview

        22.3.10. NuGenTec

            22.3.10.1. Overview

            22.3.10.2. Material Portfolio

            22.3.10.3. Profitability by Market Segments (Material/Channel/Region)

            22.3.10.4. Sales Footprint

            22.3.10.5. Strategy Overview

        22.3.11. Precision Alloys and Chemicals

            22.3.11.1. Overview

            22.3.11.2. Material Portfolio

            22.3.11.3. Profitability by Market Segments (Material/Channel/Region)

            22.3.11.4. Sales Footprint

            22.3.11.5. Strategy Overview

        22.3.12. CABB Group GmbH

            22.3.12.1. Overview

            22.3.12.2. Material Portfolio

            22.3.12.3. Profitability by Market Segments (Material/Channel/Region)

            22.3.12.4. Sales Footprint

            22.3.12.5. Strategy Overview

23. Primary Survey Analysis

24. Assumptions and Acronyms Used

25. Research Methodology

List of Tables

Table 01: Global Market Size Volume (Tons) Analysis and Forecast by Product Type, 2018 to 2033

Table 02: Global Market Size Volume (Tons) Analysis and Forecast by Product Type, 2018 to 2033

Table 03: Global Market Size (US$ Million) Analysis and Forecast by Product Type, 2018 to 2033

Table 04: Global Market Size (US$ Million) Analysis and Forecast by Product Type, 2018 to 2033

Table 05: Global Market Size Volume (Tons) Analysis and Forecast by Grade, 2018 to 2033

Table 06: Global Market Size (US$ Million) Analysis and Forecast by Grade, 2018 to 2033

Table 07: Global Market Size Volume (Tons) Analysis and Forecast by Application, 2018 to 2033

Table 08: Global Market Size (US$ Million) Analysis and Forecast by Application, 2018 to 2033

Table 09: Global Market Size Volume (Tons) Analysis and Forecast by Region, 2018 to 2033

Table 10: Global Market Size (US$ Million) Analysis and Forecast by Region, 2018 to 2033

Table 11: North America Market Size (US$ Million) and Volume (Tons) Analysis and Forecast by Country, 2018 to 2033

Table 12: North America Market Size Volume (Tons) Analysis and Forecast by Product Type, 2018 to 2033

Table 13: North America Market Size Volume (Tons) Analysis and Forecast by Product Type, 2018 to 2033

Table 14: North America Market Size (US$ Million) Analysis and Forecast by Product Type, 2018 to 2033

Table 15: North America Market Size (US$ Million) Analysis and Forecast by Product Type, 2018 to 2033

Table 16: North America Market Size Volume (Tons) Analysis and Forecast by Grade, 2018 to 2033

Table 17: North America Market Size (US$ Million) Analysis and Forecast by Grade, 2018 to 2033

Table 18: North America Market Size Volume (Tons) Analysis and Forecast by Application, 2018 to 2033

Table 19: North America Market Size (US$ Million) Analysis and Forecast by Application, 2018 to 2033

Table 20: Latin America Market Size (US$ Million) and Volume (Tons) Analysis and Forecast by Country, 2018 to 2033

Table 21: Latin America Market Size Volume (Tons) Analysis and Forecast by Product Type, 2018 to 2033

Table 22: Latin America Market Size Volume (Tons) Analysis and Forecast by Product Type, 2018 to 2033

Table 23: Latin America Market Size (US$ Million) Analysis and Forecast by Product Type, 2018 to 2033

Table 24: Latin America Market Size (US$ Million) Analysis and Forecast by Product Type, 2018 to 2033

Table 25: Latin America Market Size Volume (Tons) Analysis and Forecast by Grade, 2018 to 2033

Table 26: Latin America Market Size (US$ Million) Analysis and Forecast by Grade, 2018 to 2033

Table 27: Latin America Market Size Volume (Tons) Analysis and Forecast by Application, 2018 to 2033

Table 28: Latin America Market Size (US$ Million) Analysis and Forecast by Application, 2018 to 2033

Table 29: Western Europe Market Size (US$ Million) and Volume (Tons) Analysis and Forecast by Country, 2018 to 2033

Table 30: Western Europe Market Size Volume (Tons) Analysis and Forecast by Product Type, 2018 to 2033

Table 31: Western Europe Market Size Volume (Tons) Analysis and Forecast by Product Type, 2018 to 2033

Table 32: Western Europe Market Size (US$ Million) Analysis and Forecast by Product Type, 2018 to 2033

Table 33: Western Europe Market Size (US$ Million) Analysis and Forecast by Product Type, 2018 to 2033

Table 34: Western Europe Market Size Volume (Tons) Analysis and Forecast by Grade, 2018 to 2033

Table 35: Western Europe Market Size (US$ Million) Analysis and Forecast by Grade, 2018 to 2033

Table 36: Western Europe Market Size Volume (Tons) Analysis and Forecast by Application, 2018 to 2033

Table 37: Western Europe Market Size (US$ Million) Analysis and Forecast by Application, 2018 to 2033

Table 38: Eastern Europe Market Size (US$ Million) and Volume (Units) Analysis and Forecast by Country, 2018 to 2033

Table 39: Eastern Europe Market Size Volume (Tons) Analysis and Forecast by Product Type, 2018 to 2033

Table 40: Eastern Europe Market Size Volume (Tons) Analysis and Forecast by Product Type, 2018 to 2033

Table 41: Eastern Europe Market Size (US$ Million) Analysis and Forecast by Product Type, 2018 to 2033

Table 42: Eastern Europe Market Size (US$ Million) Analysis and Forecast by Product Type, 2018 to 2033

Table 43: Eastern Europe Market Size Volume (Tons) Analysis and Forecast by Grade, 2018 to 2033

Table 44: Eastern Europe Market Size (US$ Million) Analysis and Forecast by Grade, 2018 to 2033

Table 45: Eastern Europe Market Size Volume (Tons) Analysis and Forecast by Application, 2018 to 2033

Table 46: Eastern Europe Market Size (US$ Million) Analysis and Forecast by Application, 2018 to 2033

Table 47: South Asia Pacific Market Size (US$ Million) and Volume (Tons) Analysis and Forecast by Country, 2018 to 2033

Table 48: South Asia Pacific Market Size Volume (Tons) Analysis and Forecast by Product Type, 2018 to 2033

Table 49: South Asia Pacific Market Size Volume (Tons) Analysis and Forecast by Product Type, 2018 to 2033

Table 50: South Asia Pacific Market Size (US$ Million) Analysis and Forecast by Product Type, 2018 to 2033

Table 51: South Asia Pacific Market Size (US$ Million) Analysis and Forecast by Product Type, 2018 to 2033

Table 52: South Asia Pacific Market Size Volume (Tons) Analysis and Forecast by Grade, 2018 to 2033

Table 53: South Asia Pacific Market Size (US$ Million) Analysis and Forecast by Grade, 2018 to 2033

Table 54: South Asia Pacific Market Size Volume (Tons) Analysis and Forecast by Application, 2018 to 2033

Table 55: South Asia Pacific Market Size (US$ Million) Analysis and Forecast by Application, 2018 to 2033

Table 56: East Asia Market Size (US$ Million) and Volume (Tons) Analysis and Forecast by Country, 2018 to 2033

Table 57: East Asia Market Size (US$ Million) and Volume (Tons) Analysis and Forecast by Country, 2018 to 2033

Table 58: East Asia Market Size Volume (Tons) Analysis and Forecast by Product Type, 2018 to 2033

Table 59: East Asia Market Size Volume (Tons) Analysis and Forecast by Product Type, 2018 to 2033

Table 60: East Asia Market Size (US$ Million) Analysis and Forecast by Product Type, 2018 to 2033

Table 61: East Asia Market Size (US$ Million) Analysis and Forecast by Product Type, 2018 to 2033

Table 62: East Asia Market Size Volume (Tons) Analysis and Forecast by Grade, 2018 to 2033

Table 63: East Asia Market Size (US$ Million) Analysis and Forecast by Grade, 2018 to 2033

Table 64: East Asia Market Size Volume (Tons) Analysis and Forecast by Application, 2018 to 2033

Table 65: East Asia Market Size (US$ Million) Analysis and Forecast by Application, 2018 to 2033

Table 66: Middle East and Africa Market Size (US$ Million) and Volume (Tons) Analysis and Forecast by Country, 2018 to 2033

Table 67: Middle East and Africa Market Size (US$ Million) and Volume (Tons) Analysis and Forecast by Country, 2018 to 2033

Table 68: Middle East and Africa Market Size Volume (Tons) Analysis and Forecast by Product Type, 2018 to 2033

Table 69: Middle East and Africa Market Size Volume (Tons) Analysis and Forecast by Product Type, 2018 to 2033

Table 70: Middle East and Africa Market Size (US$ Million) Analysis and Forecast by Product Type, 2018 to 2033

Table 71: Middle East and Africa Market Size (US$ Million) Analysis and Forecast by Product Type, 2018 to 2033

Table 72: Middle East and Africa Market Size Volume (Tons) Analysis and Forecast by Grade, 2018 to 2033

Table 73: Middle East and Africa Market Size (US$ Million) Analysis and Forecast by Grade, 2018 to 2033

Table 74: Middle East and Africa Market Size Volume (Tons) Analysis and Forecast by Application, 2018 to 2033

Table 75: Middle East and Africa Market Size (US$ Million) Analysis and Forecast by Application, 2018 to 203

List of Charts

Figure 01: Global Market Historical Volume (Tons), 2018 to 2022

Figure 02: Global Market Current and Forecast Volume), 2023 to 2033

Figure 03: Global Market Historical Value (US$ Million), 2018 to 2022

Figure 04: Global Market Current and Forecast Value (US$ Million), 2023 to 2033

Figure 05: Global Market Incremental $ Opportunity (US$ Million), 2023 to 2033

Figure 06: Global Market Share and BPS Analysis by Product Type, 2023 and 2033

Figure 07: Global Market Y-o-Y Growth Projections by Product Type, 2023 to 2033

Figure 08: Global Market Attractiveness Analysis by Product Type, 2023 to 2033

Figure 09: Global Market Absolute $ Opportunity by Reagents Segment, 2018 to 2033

Figure 10: Global Market Absolute $ Opportunity by Buffers Segment, 2018 to 2033

Figure 11: Global Market Absolute $ Opportunity by Active pharmaceutical ingredients (APIs) Segment, 2018 to 2033

Figure 12: Global Market Absolute $ Opportunity by Solvents Segment, 2018 to 2033

Figure 13: Global Market Absolute $ Opportunity by Surfactants Segment, 2018 to 2033

Figure 14: Global Market Absolute $ Opportunity by Others Segment, 2018 to 2033

Figure 15: Global Market Share and BPS Analysis by Grade, 2023 and 2033

Figure 16: Global Market Y-o-Y Growth Projections by Grade, 2023 to 2033

Figure 17: Global Market Attractiveness Analysis by Grade, 2023 to 2033

Figure 18: Global Market Absolute $ Opportunity by High-purity chemicals Segment, 2018 to 2033

Figure 19: Global Market Absolute $ Opportunity by Analytical-grade chemicals Segment, 2018 to 2033

Figure 20: Global Market Absolute $ Opportunity by Reagent-grade chemicals Segment, 2018 to 2033

Figure 21: Global Market Absolute $ Opportunity by Technical-grade chemicals Segment, 2018 to 2033

Figure 22: Global Market Share and BPS Analysis by Application, 2023 and 2033

Figure 23: Global Market Y-o-Y Growth Projections by Application, 2023 to 2033

Figure 24: Global Market Attractiveness Analysis by Application, 2023 to 2033

Figure 25: Global Market Absolute $ Opportunity by Pharmaceuticals Segment, 2018 to 2033

Figure 26: Global Market Absolute $ Opportunity by Electronics Industry Segment, 2018 to 2033

Figure 27: Global Market Absolute $ Opportunity by Cosmetics Industry Segment, 2018 to 2033

Figure 28: Global Market Absolute $ Opportunity by Food and beverage Industry Segment, 2018 to 2033

Figure 29: Global Market Absolute $ Opportunity by Cleaning Products Segment, 2018 to 2033

Figure 30: Global Market Absolute $ Opportunity by Agriculture Segment, 2018 to 2033

Figure 31: Global Market Absolute $ Opportunity by Others Segment, 2018 to 2033

Figure 32: Global Market Share and BPS Analysis by Region, 2023 and 2033

Figure 33: Global Market Y-o-Y Growth Projections by Region, 2023 to 2033

Figure 34: Global Market Attractiveness Analysis by Region, 2023 to 2033

Figure 35: Global Market Absolute $ Opportunity by North America Segment, 2018 to 2033

Figure 36: Global Market Absolute $ Opportunity by Latin America Segment, 2018 to 2033

Figure 37: Global Market Absolute $ Opportunity by Western Europe Segment, 2018 to 2033

Figure 38: Global Market Absolute $ Opportunity by Eastern Europe Segment, 2018 to 2033

Figure 39: Global Market Absolute $ Opportunity by South Asia Pacific Segment, 2018 to 2033

Figure 40: Global Market Absolute $ Opportunity by East Asia Segment, 2018 to 2033

Figure 41: Global Market Absolute $ Opportunity by Middle East and Africa Segment, 2018 to 2033

Figure 42: North America Market Share and BPS Analysis by Country, 2023 and 2033

Figure 43: North America Market Y-o-Y Growth Projections by Country, 2023 to 2033

Figure 44: North America Market Attractiveness Analysis by Country, 2023 to 2033

Figure 45: North America Market Share and BPS Analysis by Product Type, 2023 and 2033

Figure 46: North America Market Y-o-Y Growth Projections by Product Type, 2023 to 2033

Figure 47: North America Market Attractiveness Analysis by Product Type, 2023 to 2033

Figure 48: North America Market Share and BPS Analysis by Grade, 2023 and 2033

Figure 49: North America Market Y-o-Y Growth Projections by Grade, 2023 to 2033

Figure 50: North America Market Attractiveness Analysis by Grade, 2023 to 2033

Figure 51: North America Market Share and BPS Analysis by Application, 2023 and 2033

Figure 52: North America Market Y-o-Y Growth Projections by Application, 2023 to 2033

Figure 53: North America Market Attractiveness Analysis by Application, 2023 to 2033

Figure 54: Latin America Market Share and BPS Analysis by Country, 2023 and 2033

Figure 55: Latin America Market Y-o-Y Growth Projections by Country, 2023 to 2033

Figure 56: Latin America Market Attractiveness Analysis by Country, 2023 to 2033

Figure 57: Latin America Market Share and BPS Analysis by Product Type, 2023 and 2033

Figure 58: Latin America Market Y-o-Y Growth Projections by Product Type, 2023 to 2033

Figure 59: Latin America Market Attractiveness Analysis by Product Type, 2023 to 2033

Figure 60: Latin America Market Share and BPS Analysis by Grade, 2023 and 2033

Figure 61: Latin America Market Y-o-Y Growth Projections by Grade, 2023 to 2033

Figure 62: Latin America Market Attractiveness Analysis by Grade, 2023 to 2033

Figure 63: Latin America Market Share and BPS Analysis by Application, 2023 and 2033

Figure 64: Latin America Market Y-o-Y Growth Projections by Application, 2023 to 2033

Figure 65: Latin America Market Attractiveness Analysis by Application, 2023 to 2033

Figure 66: Western Europe Market Share and BPS Analysis by Country, 2023 and 2033

Figure 67: Western Europe Market Y-o-Y Growth Projections by Country, 2023 to 2033

Figure 68: Western Europe Market Attractiveness Analysis by Country, 2023 to 2033

Figure 69: Western Europe Market Share and BPS Analysis by Product Type, 2023 and 2033

Figure 70: Western Europe Market Y-o-Y Growth Projections by Product Type, 2023 to 2033

Figure 71: Western Europe Market Attractiveness Analysis by Product Type, 2023 to 2033

Figure 72: Western Europe Market Share and BPS Analysis by Grade, 2023 and 2033

Figure 73: Western Europe Market Y-o-Y Growth Projections by Grade, 2023 to 2033

Figure 74: Western Europe Market Attractiveness Analysis by Grade, 2023 to 2033

Figure 75: Western Europe Market Share and BPS Analysis by Application, 2023 and 2033

Figure 76: Western Europe Market Y-o-Y Growth Projections by Application, 2023 to 2033

Figure 77: Western Europe Market Attractiveness Analysis by Application, 2023 to 2033

Figure 78: Eastern Europe Market Share and BPS Analysis by Country, 2023 and 2033

Figure 79: Eastern Europe Market Y-o-Y Growth Projections by Country, 2023 to 2033

Figure 80: Eastern Europe Market Attractiveness Analysis by Country, 2023 to 2033

Figure 81: Eastern Europe Market Share and BPS Analysis by Product Type, 2023 and 2033

Figure 82: Eastern Europe Market Y-o-Y Growth Projections by Product Type, 2023 to 2033

Figure 83: Eastern Europe Market Attractiveness Analysis by Product Type, 2023 to 2033

Figure 84: Eastern Europe Market Share and BPS Analysis by Grade, 2023 and 2033

Figure 85: Eastern Europe Market Y-o-Y Growth Projections by Grade, 2023 to 2033

Figure 86: Eastern Europe Market Attractiveness Analysis by Grade, 2023 to 2033

Figure 87: Eastern Europe Market Share and BPS Analysis by Application, 2023 and 2033

Figure 88: Eastern Europe Market Y-o-Y Growth Projections by Application, 2023 to 2033

Figure 89: Eastern Europe Market Attractiveness Analysis by Application, 2023 to 2033

Figure 90: South Asia Pacific Market Share and BPS Analysis by Country, 2023 and 2033

Figure 91: South Asia Pacific Market Y-o-Y Growth Projections by Country, 2023 to 2033

Figure 92: South Asia Pacific Market Attractiveness Analysis by Country, 2023 to 2033

Figure 93: South Asia Pacific Market Share and BPS Analysis by Product Type, 2023 and 2033

Figure 94: South Asia Pacific Market Y-o-Y Growth Projections by Product Type, 2023 to 2033

Figure 95: South Asia Pacific Market Attractiveness Analysis by Product Type, 2023 to 2033

Figure 96: South Asia Pacific Market Share and BPS Analysis by Grade, 2023 and 2033

Figure 97: South Asia Pacific Market Y-o-Y Growth Projections by Grade, 2023 to 2033

Figure 98: South Asia Pacific Market Attractiveness Analysis by Grade, 2023 to 2033

Figure 99: South Asia Pacific Market Share and BPS Analysis by Application, 2023 and 2033

Figure 100: South Asia Pacific Market Y-o-Y Growth Projections by Application, 2023 to 2033

Figure 101: South Asia Pacific Market Attractiveness Analysis by Application, 2023 to 2033

Figure 102: East Asia Market Share and BPS Analysis by Country, 2023 and 2033

Figure 103: East Asia Market Y-o-Y Growth Projections by Country, 2023 to 2033

Figure 104: East Asia Market Attractiveness Analysis by Country, 2023 to 2033

Figure 105: East Asia Market Share and BPS Analysis by Country, 2023 and 2033

Figure 106: East Asia Market Y-o-Y Growth Projections by Country, 2023 to 2033

Figure 107: East Asia Market Attractiveness Analysis by Country, 2023 to 2033

Figure 108: East Asia Market Share and BPS Analysis by Product Type, 2023 and 2033

Figure 109: East Asia Market Y-o-Y Growth Projections by Product Type, 2023 to 2033

Figure 110: East Asia Market Attractiveness Analysis by Product Type, 2023 to 2033

Figure 111: East Asia Market Share and BPS Analysis by Grade, 2023 and 2033

Figure 112: East Asia Market Y-o-Y Growth Projections by Grade, 2023 to 2033

Figure 113: East Asia Market Attractiveness Analysis by Grade, 2023 to 2033

Figure 114: East Asia Market Share and BPS Analysis by Application, 2023 and 2033

Figure 115: East Asia Market Y-o-Y Growth Projections by Application, 2023 to 2033

Figure 116: East Asia Market Attractiveness Analysis by Application, 2023 to 2033

Figure 117: Middle East and Africa Market Share and BPS Analysis by Country, 2023 and 2033

Figure 118: Middle East and Africa Market Y-o-Y Growth Projections by Country, 2023 to 2033

Figure 119: Middle East and Africa Market Attractiveness Analysis by Country, 2023 to 2033

Figure 120: Middle East and Africa Market Share and BPS Analysis by Country, 2023 and 2033

Figure 121: Middle East and Africa Market Y-o-Y Growth Projections by Country, 2023 to 2033

Figure 122: Middle East and Africa Market Attractiveness Analysis by Country, 2023 to 2033

Figure 123: Middle East and Africa Market Share and BPS Analysis by Product Type, 2023 and 2033

Figure 124: Middle East and Africa Market Y-o-Y Growth Projections by Product Type, 2023 to 2033

Figure 125: Middle East and Africa Market Attractiveness Analysis by Product Type, 2023 to 2033

Figure 126: Middle East and Africa Market Share and BPS Analysis by Grade, 2023 and 2033

Figure 127: Middle East and Africa Market Y-o-Y Growth Projections by Grade, 2023 to 2033

Figure 128: Middle East and Africa Market Attractiveness Analysis by Grade, 2023 to 2033

Figure 129: Middle East and Africa Market Share and BPS Analysis by Application, 2023 and 2033

Figure 130: Middle East and Africa Market Y-o-Y Growth Projections by Application, 2023 to 2033

Figure 131: Middle East and Africa Market Attractiveness Analysis by Application, 2023 to 2033

Explore Chemicals & Materials Insights

View Reports

Precision Chemicals Market