Cosmetic Chemicals Market Size and Share Forecast Outlook 2025 to 2035

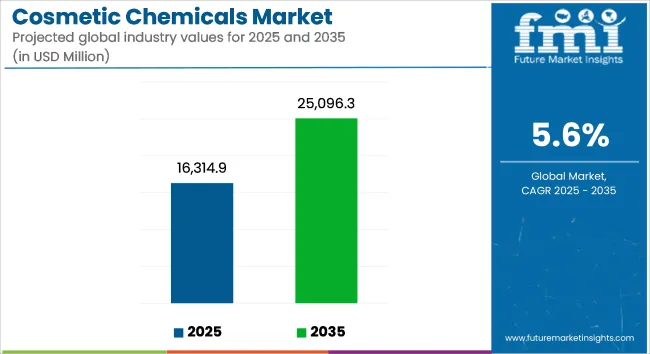
The global cosmetic chemicals market is projected to grow from USD 16,314.9 Million in 2025 to USD 25,096.3 Million by 2035, progressing at a CAGR of 5.6% during the forecast period. This growth is primarily fueled by evolving consumer lifestyles, rising demand for multifunctional and clean-label personal care products, and the increasing penetration of cosmetics across emerging economies. Regulatory scrutiny and eco-conscious consumerism are driving the adoption of biodegradable, plant-based, and skin-friendly chemical formulations.
Quick Stats for Cosmetic Chemicals Market

  • Industry Value (2025): USD 16,314.9 Million
  • Forecast Value (2035): USD 25,096.3 Million
  • Forecast CAGR (2025 to 2035): 5.6%
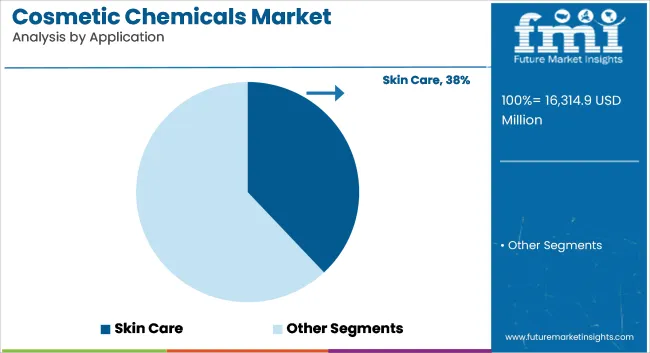
  • Leading Segment by Application in 2025: Skin Care (≈38% market share)
  • Top Key Players: BASF SE, Croda International Plc, Ashland Inc., Dow Inc., Clariant AG, Solvay SA, Evonik Industries AG

Cosmetic Chemicals Market Industry Value Analysis

The ongoing shift toward dermatology-driven, science-backed skincare is further propelling demand for specialty actives, peptides, ceramides, and botanical extracts. Growing awareness of aging, pigmentation, and pollution-induced skin damage is influencing the formulation trends in both mass-market and premium cosmetics. Additionally, male grooming, hybrid cosmetics, and the surge of online beauty platforms are reshaping product development and regional demand dynamics.

The demand for sustainable, non-toxic, and high-efficacy cosmetic chemicals is growing as consumers become increasingly ingredient-conscious and environmentally aware. Formulation transparency, clean beauty labels, and hypoallergenic claims are driving purchasing behavior, especially among Gen Z and millennial consumers. The Asia-Pacific region, led by China, South Korea, and India, is witnessing an uptick in domestic cosmetic manufacturing, supported by rising disposable incomes and the localization of beauty trends.

The industry is also witnessing increased demand for multifunctional ingredients that combine emulsification, sensory enhancement, and therapeutic activity. As skinimalism (minimal skincare), vegan cosmetics, and functional beauty gain traction, cosmetic chemicals are expected to play a vital role in driving product performance and regulatory alignment.
Analyzing Cosmetic Chemicals Market by Top Investing Segments

Skin Care Segment to Dominate, Driven by Active Ingredient Demand

Cosmetic Chemicals Market Analysis By Application

The skin care segment is forecast to account for around 38% of global cosmetic chemical demand in 2025, with a CAGR of 6.8% projected through 2035. This segment’s growth is driven by expanding consumer focus on anti-aging, hydration, barrier repair, and pigmentation correction. The increasing popularity of products such as serums, moisturizers, masks, and sunscreens has intensified the need for functional chemicals like hyaluronic acid, retinoids, niacinamide, peptides, and ceramides.

Multifunctional actives that offer antioxidant, anti-inflammatory, and UV-protective properties are being incorporated in both dermatological and luxury skin care. North America and Europe are investing in biomimetic and plant-based chemical alternatives that provide long-term efficacy without irritation. Asia-Pacific, particularly South Korea and Japan, is at the forefront of innovation in fermentation-based actives and delivery systems like liposomes and microspheres.

Consumer preference for minimal-ingredient formulations and hybrid products (cosmetics with skin care benefits) is further elevating demand for emulsifiers, rheology modifiers, and penetration enhancers. The rise of sensitive skin care, baby skin solutions, and dermocosmetics is also reinforcing this trend.
Cosmetic Surfactants Lead Product Demand Amid Shift to Mild and Green Formulations

Cosmetic Chemicals Market Analysis By Product

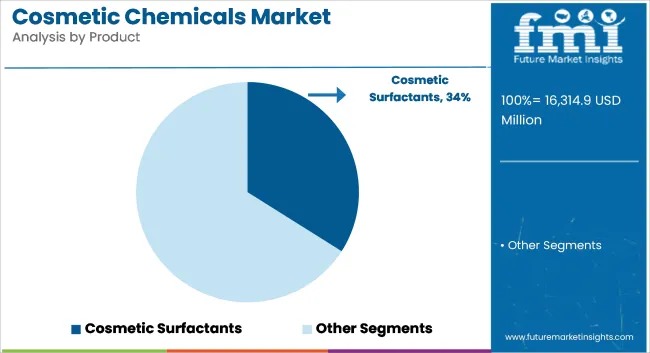
The cosmetic surfactants segment is projected to dominate the cosmetic chemicals market in 2025, accounting for about 34% of total consumption and growing at a CAGR of 6.4% through 2035. These ingredients are critical in products such as facial cleansers, body washes, shampoos, and makeup removers, where they act as cleansing agents, emulsifiers, and foaming boosters. The demand for surfactants is being reshaped by rising consumer awareness around skin sensitivity, leading to a growing preference for sulfate-free, non-irritating, and eco-certified alternatives.

Formulators are increasingly turning to naturally derived surfactants such as alkyl polyglucosides (APGs), amino acid-based surfactants, and sugar-derived esters that provide a gentler cleansing experience while maintaining efficacy. In particular, personal care brands across North America and Europe are phasing out traditional sulfate compounds like SLS and SLES, replacing them with bio-based, dermatologically tested alternatives to meet consumer demand for transparency and safety.

The Asia-Pacific region, home to large-scale shampoo and skincare production hubs, is also witnessing rising adoption of mild surfactants as local consumers prioritize sensitive skin and daily-use hygiene routines. Meanwhile, global leaders such as Solvay, BASF, and Dow are accelerating R&D and capacity expansion for sulfate-free surfactant technologies, targeting premium, baby care, and sensitive-skin product lines. As the clean beauty and green chemistry movement gains momentum, cosmetic surfactants will remain foundational to both functional performance and regulatory compliance in next-generation cosmetic formulations.

Challenges and Opportunities

Challenge

Regulatory Compliance and Safety Concerns

Like chemical manufacturers that supply cosmetic ingredients, cosmetic chemical manufacturers must manage a complicated global regulatory framework affecting safety standards, ingredient bans and disclosure requirements. Regions like the EU have prohibited or banned over 1,000 ingredients, forcing companies to search for alternatives that follow the rules.

And growing concerns about allergens, endocrine disrupting chemicals and micro plastics are putting pressure on companies to trace the safety and environmental impact of raw materials. It is challenging technically and financially to develop effective products that can satisfy these rules.

Opportunity

Surge in Demand for Natural and Sustainable Ingredients

The transition to green cosmetics and clean beauty formulations is also a sector with significant growth opportunities. Information from many sources has made consumers side with products that do not contain parabens, sulphates, silicones, and synthetic fragrances, increasing the demand for things like plant-derived emulsifiers, botanical extracts, bioactive, and biodegradable preservatives.

This pressure to produce biodegradable products has been exacerbated with the increase in vegan, cruelty-free and carbon-neutral beauty brands. Those that invest in green chemistry, biotechnology, and circular sourcing models should see significant traction in both developed and emerging markets.
Country wise insights

Cosmetic Chemicals Market Cagr Analysis By Country

United States

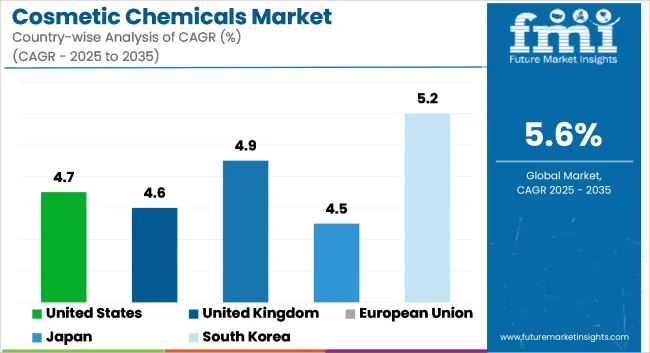
The United States cosmetic chemicals market is expected to witness a CAGR of 4.7% during the tenure of 2025 to 2035. This segment is witnessing growth in this region due to the increasing consumer awareness about the ingredients in formulation, the increasing of clean beauty trends; and innovation of the formulations of anti-aging and multifunctional products.

As the rules and needs of consumers are pushing manufacturers to turn more bio-based and sustainable, domestic manufacturers are investing in providing chemical ingredients that meet such demands. The adoption of advanced cosmetic chemicals across product lines (skincare, haircare, and colour cosmetics) is also attributed to the strong cosmetics manufacturing base and the presence of major personal care brands in the market.

Country CAGR (2025 to 2035)
United States 4.7%

United Kingdom

The UK cosmetic chemicals market is expected to grow at a CAGR of 4.6% during the forecast period. Local cosmetic brands have been adapting their strategic approach to ingredient sourcing, with a firm shift towards vegan, cruelty free and dermatologically tested products. According to the trend, natural and green preservative, emollients, and surfactants is on the rise. They also add that, especially post-Brexit, the UK’s regulatory adaptations in chemical imports and safety standards are impacting both aspects and growing reliance on localized innovation and sustainable sourcing.

Country CAGR (2025 to 2035)
United Kingdom 4.6%

European Union

The cosmetic chemicals market in the broader European Union is expected to shape up with a CAGR of 4.9% during 2025 to 2035. With strict EU regulation on cosmetic products and emphasis of consumer safety, manufacturers are aiming towards REACH compliant nontoxic chemical substitutes.

These active and functional ingredients are highly demanded in industries such as organic cosmetics and cosmeceutical products which will boost the absolute volume demand for specialty cosmetic ingredients in developed regions such as Germany and France. The growing trend of male grooming and such age-based formulations are also contributing to the demand across the market.

Region CAGR (2025 to 2035)
European Union 4.9%

Japan

The cosmetic chemicals market in Japan is projected to register a CAGR of 4.5% during the forecast period. The demand for new chemical ingredients that enhance skin health and provide natural look are magnified in this country whose culture is very keen on skin-care and minimalism. Japanese cosmetic manufacturers are especially interested in hybrid skincare-makeup formulations and innovative functional ingredients from traditional herbal sources and biotechnology.

Country CAGR (2025 to 2035)
Japan 4.5%

South Korea

The South Korea cosmetic chemicals market aspires to grow at a CAGR of 5.2% over the tenure of 2025 to 2035. The country remains a top investor in high-efficacy chemical ingredients, such as peptides, ceramides and botanical actives, as a global leader in beauty innovation.

The growing domestic production and export of cosmetic chemical ingredients is driven by rising K-beauty product demand in global markets. Fi India has a host of government-supported R&D for biotechnological and nanotechnological developments that contribute to formulations in the country.

Country CAGR (2025 to 2035)
South Korea 5.2%

Competition Outlook

The cosmetic chemicals market is moderately fragmented with intense innovation-focused competition. Leading manufacturers are differentiating themselves through green chemistry innovations, biotech-based ingredients, and circular economy integration. Companies are emphasizing sustainable sourcing, biodegradable formulations, and certified natural/organic claims to align with consumer expectations and regulatory mandates.

Strategic mergers, joint ventures, and acquisitions are being executed to access novel ingredient platforms, R&D capabilities, and regional markets. BASF, Croda, and Clariant have expanded their portfolios with plant-derived and fermentation-based actives, while Dow and Ashland are pioneering sensory-optimized polymers and bio-based solubilizers.

Recent Developments

  • In April 2025, BASF was reported to have launched Verdessence® RiceTouch, a new biodegradable sensory modifier based on rice starch for natural and sustainable cosmetic formulations. The ingredient was designed to provide a smooth, powdery skin feel and was suitable for mattifying applications in skincare and makeup. It was stated that RiceTouch supports clean beauty trends, offering a renewable and microbiome-friendly alternative to synthetic polymers. The launch expanded BASF’s Verdessence® portfolio of bio-based personal care ingredients.
  • In March 2025, DIC Corporation was reported to have showcased new cosmetic pigments and functional ingredients at in-cosmetics Global 2025 in Paris. The company introduced color materials designed for improved skin tone correction, visual coverage, and light management, including innovations derived from sustainable sources. It was stated that DIC emphasized its commitment to sensory performance, ethical sourcing, and regulatory compliance.

Key Players

  • Ashland Global Specialty Chemicals Inc.
  • Momentive Performance Materials Inc.
  • The Lubrizol Corporation
  • Archer Daniels Midland Company
  • Actives International
  • Lucas Meyer Cosmetics Canada, Inc.
  • Eastman Chemical Company
  • Innospec Inc.
  • INOLEX Inc.
  • Eyesome Co., Ltd.

Key Segments Profiled in the Cosmetic Chemicals Industry Survey

By Product:

  • Cosmetic Surfactants
  • Cosmetic Polymer Ingredients
  • Cosmetic Colorants
  • Cosmetic Preservatives

By Application:

  • Skin Care
  • Hair Care
  • Make-Up Applications
  • Oral Care
  • Fragrances
  • Other Applications

By Region:

  • North America
  • Latin America
  • Western Europe
  • Eastern Europe
  • Asia Pacific Excluding Japan
  • Japan
  • Middle East Africa

Table of Content

  1. Executive Summary
  2. Industry Introduction, including Taxonomy and Market Definition
  3. Market Trends and Success Factors, including Macro-economic Factors, Market Dynamics, and Recent Industry Developments
  4. Global Market Demand Analysis 2020 to 2024 and Forecast 2025 to 2035, including Historical Analysis and Future Projections
  5. Pricing Analysis
  6. Global Market Analysis 2020 to 2024 and Forecast 2025 to 2035
    • Product
    • Application
  7. Global Market Analysis 2020 to 2024 and Forecast 2025 to 2035, By Product
    • Cosmetic Surfactants
    • Cosmetic Polymer Ingredients
    • Cosmetic Colorants
    • Cosmetic Preservatives
  8. Global Market Analysis 2020 to 2024 and Forecast 2025 to 2035, By Application
    • for Skin Care
    • for Hair Care
    • for Make-Up Applications
    • for Oral Care
    • for Fragrances
    • for Other Applications
  9. Global Market Analysis 2020 to 2024 and Forecast 2025 to 2035, By Region
    • North America
    • Latin America
    • Western Europe
    • Eastern Europe
    • East Asia
    • South Asia Pacific
    • Middle East and Africa
  10. North America Sales Analysis 2020 to 2024 and Forecast 2025 to 2035, by Key Segments and Countries
  11. Latin America Sales Analysis 2020 to 2024 and Forecast 2025 to 2035, by Key Segments and Countries
  12. Western Europe Sales Analysis 2020 to 2024 and Forecast 2025 to 2035, by Key Segments and Countries
  13. Eastern Europe Sales Analysis 2020 to 2024 and Forecast 2025 to 2035, by Key Segments and Countries
  14. East Asia Sales Analysis 2020 to 2024 and Forecast 2025 to 2035, by Key Segments and Countries
  15. South Asia Pacific Sales Analysis 2020 to 2024 and Forecast 2025 to 2035, by Key Segments and Countries
  16. Middle East and Africa Sales Analysis 2020 to 2024 and Forecast 2025 to 2035, by Key Segments and Countries
  17. Sales Forecast 2025 to 2035 by Product and Application for 30 Countries
  18. Competition Outlook, including Market Structure Analysis, Company Share Analysis by Key Players, and Competition Dashboard
  19. Company Profile
    • Ashland Global Specialty Chemicals Inc.
    • Momentive Performance Materials Inc.
    • The Lubrizol Corporation
    • Archer Daniels Midland Company
    • Actives International
    • Lucas Meyer Cosmetics Canada, Inc.
    • Eastman Chemical Company
    • Innospec Inc.
    • INOLEX Inc.
    • Novacap Group

List of Tables

  • Table 1: Global Market Value (USD Million) Forecast by Region, 2020 to 2035
  • Table 2: Global Market Volume (Tons) Forecast by Region, 2020 to 2035
  • Table 3: Global Market Value (USD Million) Forecast by Product Type, 2020 to 2035
  • Table 4: Global Market Volume (Tons) Forecast by Product Type, 2020 to 2035
  • Table 5: Global Market Value (USD Million) Forecast by Function, 2020 to 2035
  • Table 6: Global Market Volume (Tons) Forecast by Function, 2020 to 2035
  • Table 7: Global Market Value (USD Million) Forecast by Application, 2020 to 2035
  • Table 8: Global Market Volume (Tons) Forecast by Application, 2020 to 2035
  • Table 9: North America Market Value (USD Million) Forecast by Country, 2020 to 2035
  • Table 10: North America Market Volume (Tons) Forecast by Country, 2020 to 2035
  • Table 11: North America Market Value (USD Million) Forecast by Product Type, 2020 to 2035
  • Table 12: North America Market Volume (Tons) Forecast by Product Type, 2020 to 2035
  • Table 13: North America Market Value (USD Million) Forecast by Function, 2020 to 2035
  • Table 14: North America Market Volume (Tons) Forecast by Function, 2020 to 2035
  • Table 15: North America Market Value (USD Million) Forecast by Application, 2020 to 2035
  • Table 16: North America Market Volume (Tons) Forecast by Application, 2020 to 2035
  • Table 17: Latin America Market Value (USD Million) Forecast by Country, 2020 to 2035
  • Table 18: Latin America Market Volume (Tons) Forecast by Country, 2020 to 2035
  • Table 19: Latin America Market Value (USD Million) Forecast by Product Type, 2020 to 2035
  • Table 20: Latin America Market Volume (Tons) Forecast by Product Type, 2020 to 2035
  • Table 21: Latin America Market Value (USD Million) Forecast by Function, 2020 to 2035
  • Table 22: Latin America Market Volume (Tons) Forecast by Function, 2020 to 2035
  • Table 23: Latin America Market Value (USD Million) Forecast by Application, 2020 to 2035
  • Table 24: Latin America Market Volume (Tons) Forecast by Application, 2020 to 2035
  • Table 25: Europe Market Value (USD Million) Forecast by Country, 2020 to 2035
  • Table 26: Europe Market Volume (Tons) Forecast by Country, 2020 to 2035
  • Table 27: Europe Market Value (USD Million) Forecast by Product Type, 2020 to 2035
  • Table 28: Europe Market Volume (Tons) Forecast by Product Type, 2020 to 2035
  • Table 29: Europe Market Value (USD Million) Forecast by Function, 2020 to 2035
  • Table 30: Europe Market Volume (Tons) Forecast by Function, 2020 to 2035
  • Table 31: Europe Market Value (USD Million) Forecast by Application, 2020 to 2035
  • Table 32: Europe Market Volume (Tons) Forecast by Application, 2020 to 2035
  • Table 33: East Asia Market Value (USD Million) Forecast by Country, 2020 to 2035
  • Table 34: East Asia Market Volume (Tons) Forecast by Country, 2020 to 2035
  • Table 35: East Asia Market Value (USD Million) Forecast by Product Type, 2020 to 2035
  • Table 36: East Asia Market Volume (Tons) Forecast by Product Type, 2020 to 2035
  • Table 37: East Asia Market Value (USD Million) Forecast by Function, 2020 to 2035
  • Table 38: East Asia Market Volume (Tons) Forecast by Function, 2020 to 2035
  • Table 39: East Asia Market Value (USD Million) Forecast by Application, 2020 to 2035
  • Table 40: East Asia Market Volume (Tons) Forecast by Application, 2020 to 2035
  • Table 41: South Asia & Pacific Market Value (USD Million) Forecast by Country, 2020 to 2035
  • Table 42: South Asia & Pacific Market Volume (Tons) Forecast by Country, 2020 to 2035
  • Table 43: South Asia & Pacific Market Value (USD Million) Forecast by Product Type, 2020 to 2035
  • Table 44: South Asia & Pacific Market Volume (Tons) Forecast by Product Type, 2020 to 2035
  • Table 45: South Asia & Pacific Market Value (USD Million) Forecast by Function, 2020 to 2035
  • Table 46: South Asia & Pacific Market Volume (Tons) Forecast by Function, 2020 to 2035
  • Table 47: South Asia & Pacific Market Value (USD Million) Forecast by Application, 2020 to 2035
  • Table 48: South Asia & Pacific Market Volume (Tons) Forecast by Application, 2020 to 2035
  • Table 49: MEA Market Value (USD Million) Forecast by Country, 2020 to 2035
  • Table 50: MEA Market Volume (Tons) Forecast by Country, 2020 to 2035
  • Table 51: MEA Market Value (USD Million) Forecast by Product Type, 2020 to 2035
  • Table 52: MEA Market Volume (Tons) Forecast by Product Type, 2020 to 2035
  • Table 53: MEA Market Value (USD Million) Forecast by Function, 2020 to 2035
  • Table 54: MEA Market Volume (Tons) Forecast by Function, 2020 to 2035
  • Table 55: MEA Market Value (USD Million) Forecast by Application, 2020 to 2035
  • Table 56: MEA Market Volume (Tons) Forecast by Application, 2020 to 2035

List of Figures

  • Figure 1: Global Market Value (USD Million) by Product Type, 2025 to 2035
  • Figure 2: Global Market Value (USD Million) by Function, 2025 to 2035
  • Figure 3: Global Market Value (USD Million) by Application, 2025 to 2035
  • Figure 4: Global Market Value (USD Million) by Region, 2025 to 2035
  • Figure 5: Global Market Value (USD Million) Analysis by Region, 2020 to 2035
  • Figure 6: Global Market Volume (Tons) Analysis by Region, 2020 to 2035
  • Figure 7: Global Market Value Share (%) and BPS Analysis by Region, 2025 to 2035
  • Figure 8: Global Market Y-o-Y Growth (%) Projections by Region, 2025 to 2035
  • Figure 9: Global Market Value (USD Million) Analysis by Product Type, 2020 to 2035
  • Figure 10: Global Market Volume (Tons) Analysis by Product Type, 2020 to 2035
  • Figure 11: Global Market Value Share (%) and BPS Analysis by Product Type, 2025 to 2035
  • Figure 12: Global Market Y-o-Y Growth (%) Projections by Product Type, 2025 to 2035
  • Figure 13: Global Market Value (USD Million) Analysis by Function, 2020 to 2035
  • Figure 14: Global Market Volume (Tons) Analysis by Function, 2020 to 2035
  • Figure 15: Global Market Value Share (%) and BPS Analysis by Function, 2025 to 2035
  • Figure 16: Global Market Y-o-Y Growth (%) Projections by Function, 2025 to 2035
  • Figure 17: Global Market Value (USD Million) Analysis by Application, 2020 to 2035
  • Figure 18: Global Market Volume (Tons) Analysis by Application, 2020 to 2035
  • Figure 19: Global Market Value Share (%) and BPS Analysis by Application, 2025 to 2035
  • Figure 20: Global Market Y-o-Y Growth (%) Projections by Application, 2025 to 2035
  • Figure 21: Global Market Attractiveness by Product Type, 2025 to 2035
  • Figure 22: Global Market Attractiveness by Function, 2025 to 2035
  • Figure 23: Global Market Attractiveness by Application, 2025 to 2035
  • Figure 24: Global Market Attractiveness by Region, 2025 to 2035
  • Figure 25: North America Market Value (USD Million) by Product Type, 2025 to 2035
  • Figure 26: North America Market Value (USD Million) by Function, 2025 to 2035
  • Figure 27: North America Market Value (USD Million) by Application, 2025 to 2035
  • Figure 28: North America Market Value (USD Million) by Country, 2025 to 2035
  • Figure 29: North America Market Value (USD Million) Analysis by Country, 2020 to 2035
  • Figure 30: North America Market Volume (Tons) Analysis by Country, 2020 to 2035
  • Figure 31: North America Market Value Share (%) and BPS Analysis by Country, 2025 to 2035
  • Figure 32: North America Market Y-o-Y Growth (%) Projections by Country, 2025 to 2035
  • Figure 33: North America Market Value (USD Million) Analysis by Product Type, 2020 to 2035
  • Figure 34: North America Market Volume (Tons) Analysis by Product Type, 2020 to 2035
  • Figure 35: North America Market Value Share (%) and BPS Analysis by Product Type, 2025 to 2035
  • Figure 36: North America Market Y-o-Y Growth (%) Projections by Product Type, 2025 to 2035
  • Figure 37: North America Market Value (USD Million) Analysis by Function, 2020 to 2035
  • Figure 38: North America Market Volume (Tons) Analysis by Function, 2020 to 2035
  • Figure 39: North America Market Value Share (%) and BPS Analysis by Function, 2025 to 2035
  • Figure 40: North America Market Y-o-Y Growth (%) Projections by Function, 2025 to 2035
  • Figure 41: North America Market Value (USD Million) Analysis by Application, 2020 to 2035
  • Figure 42: North America Market Volume (Tons) Analysis by Application, 2020 to 2035
  • Figure 43: North America Market Value Share (%) and BPS Analysis by Application, 2025 to 2035
  • Figure 44: North America Market Y-o-Y Growth (%) Projections by Application, 2025 to 2035
  • Figure 45: North America Market Attractiveness by Product Type, 2025 to 2035
  • Figure 46: North America Market Attractiveness by Function, 2025 to 2035
  • Figure 47: North America Market Attractiveness by Application, 2025 to 2035
  • Figure 48: North America Market Attractiveness by Country, 2025 to 2035
  • Figure 49: Latin America Market Value (USD Million) by Product Type, 2025 to 2035
  • Figure 50: Latin America Market Value (USD Million) by Function, 2025 to 2035
  • Figure 51: Latin America Market Value (USD Million) by Application, 2025 to 2035
  • Figure 52: Latin America Market Value (USD Million) by Country, 2025 to 2035
  • Figure 53: Latin America Market Value (USD Million) Analysis by Country, 2020 to 2035
  • Figure 54: Latin America Market Volume (Tons) Analysis by Country, 2020 to 2035
  • Figure 55: Latin America Market Value Share (%) and BPS Analysis by Country, 2025 to 2035
  • Figure 56: Latin America Market Y-o-Y Growth (%) Projections by Country, 2025 to 2035
  • Figure 57: Latin America Market Value (USD Million) Analysis by Product Type, 2020 to 2035
  • Figure 58: Latin America Market Volume (Tons) Analysis by Product Type, 2020 to 2035
  • Figure 59: Latin America Market Value Share (%) and BPS Analysis by Product Type, 2025 to 2035
  • Figure 60: Latin America Market Y-o-Y Growth (%) Projections by Product Type, 2025 to 2035
  • Figure 61: Latin America Market Value (USD Million) Analysis by Function, 2020 to 2035
  • Figure 62: Latin America Market Volume (Tons) Analysis by Function, 2020 to 2035
  • Figure 63: Latin America Market Value Share (%) and BPS Analysis by Function, 2025 to 2035
  • Figure 64: Latin America Market Y-o-Y Growth (%) Projections by Function, 2025 to 2035
  • Figure 65: Latin America Market Value (USD Million) Analysis by Application, 2020 to 2035
  • Figure 66: Latin America Market Volume (Tons) Analysis by Application, 2020 to 2035
  • Figure 67: Latin America Market Value Share (%) and BPS Analysis by Application, 2025 to 2035
  • Figure 68: Latin America Market Y-o-Y Growth (%) Projections by Application, 2025 to 2035
  • Figure 69: Latin America Market Attractiveness by Product Type, 2025 to 2035
  • Figure 70: Latin America Market Attractiveness by Function, 2025 to 2035
  • Figure 71: Latin America Market Attractiveness by Application, 2025 to 2035
  • Figure 72: Latin America Market Attractiveness by Country, 2025 to 2035
  • Figure 73: Europe Market Value (USD Million) by Product Type, 2025 to 2035
  • Figure 74: Europe Market Value (USD Million) by Function, 2025 to 2035
  • Figure 75: Europe Market Value (USD Million) by Application, 2025 to 2035
  • Figure 76: Europe Market Value (USD Million) by Country, 2025 to 2035
  • Figure 77: Europe Market Value (USD Million) Analysis by Country, 2020 to 2035
  • Figure 78: Europe Market Volume (Tons) Analysis by Country, 2020 to 2035
  • Figure 79: Europe Market Value Share (%) and BPS Analysis by Country, 2025 to 2035
  • Figure 80: Europe Market Y-o-Y Growth (%) Projections by Country, 2025 to 2035
  • Figure 81: Europe Market Value (USD Million) Analysis by Product Type, 2020 to 2035
  • Figure 82: Europe Market Volume (Tons) Analysis by Product Type, 2020 to 2035
  • Figure 83: Europe Market Value Share (%) and BPS Analysis by Product Type, 2025 to 2035
  • Figure 84: Europe Market Y-o-Y Growth (%) Projections by Product Type, 2025 to 2035
  • Figure 85: Europe Market Value (USD Million) Analysis by Function, 2020 to 2035
  • Figure 86: Europe Market Volume (Tons) Analysis by Function, 2020 to 2035
  • Figure 87: Europe Market Value Share (%) and BPS Analysis by Function, 2025 to 2035
  • Figure 88: Europe Market Y-o-Y Growth (%) Projections by Function, 2025 to 2035
  • Figure 89: Europe Market Value (USD Million) Analysis by Application, 2020 to 2035
  • Figure 90: Europe Market Volume (Tons) Analysis by Application, 2020 to 2035
  • Figure 91: Europe Market Value Share (%) and BPS Analysis by Application, 2025 to 2035
  • Figure 92: Europe Market Y-o-Y Growth (%) Projections by Application, 2025 to 2035
  • Figure 93: Europe Market Attractiveness by Product Type, 2025 to 2035
  • Figure 94: Europe Market Attractiveness by Function, 2025 to 2035
  • Figure 95: Europe Market Attractiveness by Application, 2025 to 2035
  • Figure 96: Europe Market Attractiveness by Country, 2025 to 2035
  • Figure 97: East Asia Market Value (USD Million) by Product Type, 2025 to 2035
  • Figure 98: East Asia Market Value (USD Million) by Function, 2025 to 2035
  • Figure 99: East Asia Market Value (USD Million) by Application, 2025 to 2035
  • Figure 100: East Asia Market Value (USD Million) by Country, 2025 to 2035
  • Figure 101: East Asia Market Value (USD Million) Analysis by Country, 2020 to 2035
  • Figure 102: East Asia Market Volume (Tons) Analysis by Country, 2020 to 2035
  • Figure 103: East Asia Market Value Share (%) and BPS Analysis by Country, 2025 to 2035
  • Figure 104: East Asia Market Y-o-Y Growth (%) Projections by Country, 2025 to 2035
  • Figure 105: East Asia Market Value (USD Million) Analysis by Product Type, 2020 to 2035
  • Figure 106: East Asia Market Volume (Tons) Analysis by Product Type, 2020 to 2035
  • Figure 107: East Asia Market Value Share (%) and BPS Analysis by Product Type, 2025 to 2035
  • Figure 108: East Asia Market Y-o-Y Growth (%) Projections by Product Type, 2025 to 2035
  • Figure 109: East Asia Market Value (USD Million) Analysis by Function, 2020 to 2035
  • Figure 110: East Asia Market Volume (Tons) Analysis by Function, 2020 to 2035
  • Figure 111: East Asia Market Value Share (%) and BPS Analysis by Function, 2025 to 2035
  • Figure 112: East Asia Market Y-o-Y Growth (%) Projections by Function, 2025 to 2035
  • Figure 113: East Asia Market Value (USD Million) Analysis by Application, 2020 to 2035
  • Figure 114: East Asia Market Volume (Tons) Analysis by Application, 2020 to 2035
  • Figure 115: East Asia Market Value Share (%) and BPS Analysis by Application, 2025 to 2035
  • Figure 116: East Asia Market Y-o-Y Growth (%) Projections by Application, 2025 to 2035
  • Figure 117: East Asia Market Attractiveness by Product Type, 2025 to 2035
  • Figure 118: East Asia Market Attractiveness by Function, 2025 to 2035
  • Figure 119: East Asia Market Attractiveness by Application, 2025 to 2035
  • Figure 120: East Asia Market Attractiveness by Country, 2025 to 2035
  • Figure 121: South Asia & Pacific Market Value (USD Million) by Product Type, 2025 to 2035
  • Figure 122: South Asia & Pacific Market Value (USD Million) by Function, 2025 to 2035
  • Figure 123: South Asia & Pacific Market Value (USD Million) by Application, 2025 to 2035
  • Figure 124: South Asia & Pacific Market Value (USD Million) by Country, 2025 to 2035
  • Figure 125: South Asia & Pacific Market Value (USD Million) Analysis by Country, 2020 to 2035
  • Figure 126: South Asia & Pacific Market Volume (Tons) Analysis by Country, 2020 to 2035
  • Figure 127: South Asia & Pacific Market Value Share (%) and BPS Analysis by Country, 2025 to 2035
  • Figure 128: South Asia & Pacific Market Y-o-Y Growth (%) Projections by Country, 2025 to 2035
  • Figure 129: South Asia & Pacific Market Value (USD Million) Analysis by Product Type, 2020 to 2035
  • Figure 130: South Asia & Pacific Market Volume (Tons) Analysis by Product Type, 2020 to 2035
  • Figure 131: South Asia & Pacific Market Value Share (%) and BPS Analysis by Product Type, 2025 to 2035
  • Figure 132: South Asia & Pacific Market Y-o-Y Growth (%) Projections by Product Type, 2025 to 2035
  • Figure 133: South Asia & Pacific Market Value (USD Million) Analysis by Function, 2020 to 2035
  • Figure 134: South Asia & Pacific Market Volume (Tons) Analysis by Function, 2020 to 2035
  • Figure 135: South Asia & Pacific Market Value Share (%) and BPS Analysis by Function, 2025 to 2035
  • Figure 136: South Asia & Pacific Market Y-o-Y Growth (%) Projections by Function, 2025 to 2035
  • Figure 137: South Asia & Pacific Market Value (USD Million) Analysis by Application, 2020 to 2035
  • Figure 138: South Asia & Pacific Market Volume (Tons) Analysis by Application, 2020 to 2035
  • Figure 139: South Asia & Pacific Market Value Share (%) and BPS Analysis by Application, 2025 to 2035
  • Figure 140: South Asia & Pacific Market Y-o-Y Growth (%) Projections by Application, 2025 to 2035
  • Figure 141: South Asia & Pacific Market Attractiveness by Product Type, 2025 to 2035
  • Figure 142: South Asia & Pacific Market Attractiveness by Function, 2025 to 2035
  • Figure 143: South Asia & Pacific Market Attractiveness by Application, 2025 to 2035
  • Figure 144: South Asia & Pacific Market Attractiveness by Country, 2025 to 2035
  • Figure 145: MEA Market Value (USD Million) by Product Type, 2025 to 2035
  • Figure 146: MEA Market Value (USD Million) by Function, 2025 to 2035
  • Figure 147: MEA Market Value (USD Million) by Application, 2025 to 2035
  • Figure 148: MEA Market Value (USD Million) by Country, 2025 to 2035
  • Figure 149: MEA Market Value (USD Million) Analysis by Country, 2020 to 2035
  • Figure 150: MEA Market Volume (Tons) Analysis by Country, 2020 to 2035
  • Figure 151: MEA Market Value Share (%) and BPS Analysis by Country, 2025 to 2035
  • Figure 152: MEA Market Y-o-Y Growth (%) Projections by Country, 2025 to 2035
  • Figure 153: MEA Market Value (USD Million) Analysis by Product Type, 2020 to 2035
  • Figure 154: MEA Market Volume (Tons) Analysis by Product Type, 2020 to 2035
  • Figure 155: MEA Market Value Share (%) and BPS Analysis by Product Type, 2025 to 2035
  • Figure 156: MEA Market Y-o-Y Growth (%) Projections by Product Type, 2025 to 2035
  • Figure 157: MEA Market Value (USD Million) Analysis by Function, 2020 to 2035
  • Figure 158: MEA Market Volume (Tons) Analysis by Function, 2020 to 2035
  • Figure 159: MEA Market Value Share (%) and BPS Analysis by Function, 2025 to 2035
  • Figure 160: MEA Market Y-o-Y Growth (%) Projections by Function, 2025 to 2035
  • Figure 161: MEA Market Value (USD Million) Analysis by Application, 2020 to 2035
  • Figure 162: MEA Market Volume (Tons) Analysis by Application, 2020 to 2035
  • Figure 163: MEA Market Value Share (%) and BPS Analysis by Application, 2025 to 2035
  • Figure 164: MEA Market Y-o-Y Growth (%) Projections by Application, 2025 to 2035
  • Figure 165: MEA Market Attractiveness by Product Type, 2025 to 2035
  • Figure 166: MEA Market Attractiveness by Function, 2025 to 2035
  • Figure 167: MEA Market Attractiveness by Application, 2025 to 2035
  • Figure 168: MEA Market Attractiveness by Country, 2025 to 2035

Frequently Asked Questions

What was the overall size of the Cosmetic Chemicals Market in 2025?

The overall market size for the Cosmetic Chemicals Market was USD 16,314.9 Million in 2025.

How big is the Cosmetic Chemicals Market expected to be in 2035?

The Cosmetic Chemicals Market is expected to reach USD 25,096.3 Million in 2035.

What will drive the demand for the Cosmetic Chemicals Market during the forecast period?

The demand is driven by increasing consumer spending on personal care, growing preference for multifunctional and anti-aging products, rising demand for organic and sustainable ingredients, and advancements in cosmetic formulations and active compounds.

List the top 5 countries contributing to the Cosmetic Chemicals Market?

The top 5 countries driving market growth are the USA, UK, Europe, Japan and South Korea.

Which segment in product type is expected to lead in the Cosmetic Chemicals Market?

The Cosmetic surfactants segment is expected to command a significant share over the assessment period.

Explore Similar Insights

Future Market Insights

Cosmetic Chemicals Market