The global cosmetic dropper market is valued at USD 3.7 billion in 2025 and is set to reach USD 7.8 billion by 2035, recording an absolute increase of USD 4.1 billion over the forecast period. This translates into a total growth of 110.8%, with the market forecast to expand at a CAGR of 7.8% between 2025 and 2035. The market size is expected to grow by approximately 2.1X during the same period, supported by increasing demand for precision dispensing solutions, growing premium beauty product adoption, rising liquid serum formulations, and expanding requirements for controlled dosage systems across cosmetics, skincare, and personal care sectors.
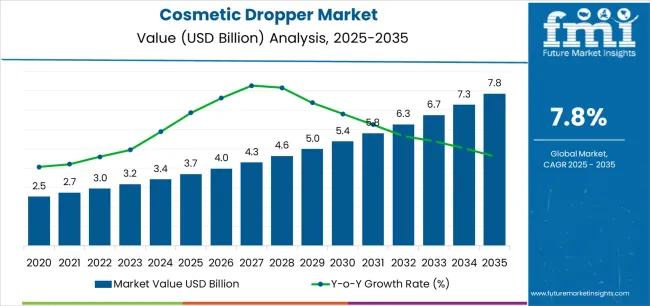
Between 2025 and 2030, the cosmetic dropper market is projected to expand from USD 3.7 billion to USD 5.4 billion, resulting in a value increase of USD 1.7 billion, which represents 41.5% of the total forecast growth for the decade. This phase of development will be shaped by increasing demand for premium skincare droppers, rising liquid foundation applications enabling precision dispensing formats, and growing availability of customizable dropper solutions across luxury beauty brands and specialty cosmetic applications.
Between 2030 and 2035, the market is forecast to grow from USD 5.4 billion to USD 7.8 billion, adding another USD 2.4 billion, which constitutes 58.5% of the ten-year expansion. This period is expected to be characterized by the advancement of smart dropper technologies, the integration of antimicrobial coating systems for hygiene enhancement, and the development of premium dropper formats across diverse cosmetic categories. The growing emphasis on product differentiation and luxury packaging will drive demand for advanced dropper varieties with enhanced aesthetic appeal, improved functionality features, and superior dispensing precision characteristics.
| Metric | Value |
|---|---|
| Estimated Market Value (2025E) | USD 3.7 Billion |
| Forecast Market Value (2035F) | USD 7.8 Billion |
| Forecast CAGR (2025-2035) | 7.8% |
From 2030 to 2035, the market is forecast to grow from USD 5.4 billion to USD 7.8 billion, adding another USD 2.4 billion, which constitutes 58.5% of the ten-year expansion. This period is expected to be characterized by the advancement of precision dosing technologies, the integration of child-resistant mechanisms for safety applications, and the development of specialized dropper systems for active ingredient formulations. The growing emphasis on product presentation and premium positioning will drive demand for sophisticated varieties with enhanced visual appeal, improved ergonomic design features, and superior performance characteristics.
Between 2020 and 2024, the cosmetic dropper market experienced significant growth, driven by increasing awareness of skincare regimen benefits and growing recognition of dropper systems' effectiveness in supporting efficient product dispensing across premium and mass market segments. The market developed as users recognized the potential for dropper packaging to deliver economic advantages while meeting modern requirements for minimal product waste and reliable application practices. Technological advancement in pipette mechanism design and dropper engineering began emphasizing the critical importance of maintaining leak-proof operation while extending product freshness and improving user experience across diverse cosmetic applications.
Market expansion is being supported by the increasing global demand for precision dispensing packaging solutions and the corresponding shift toward controlled dosage formats that can provide superior product protection while meeting user requirements for accurate application and contamination-free storage processes. Modern beauty brands are increasingly focused on incorporating dropper systems that can enhance product differentiation while satisfying demands for consistent, reliably performing mechanisms and optimized skincare routines. Cosmetic droppers' proven ability to deliver precise dosing, extended product freshness, and diverse application possibilities makes them essential packaging components for premium beauty brands and quality-conscious cosmetic manufacturers.
The growing emphasis on skincare routine sophistication and premium product positioning is driving demand for high-performance dropper systems that can support luxury brand positioning and comprehensive user experience benefits across serum products, facial oils, and active ingredient categories. User preference for packaging mechanisms that combine functional excellence with aesthetic appeal is creating opportunities for innovative implementations in both traditional and emerging cosmetic applications. The rising influence of social media beauty trends and modern skincare education is also contributing to increased adoption of droppers that can provide precise application and reliable functionality characteristics.
The market is segmented by material type, product type, capacity, end-use application, and region. By material type, the market is divided into glass droppers, plastic droppers, aluminum droppers, bamboo droppers, and hybrid droppers. Based on product type, the market is categorized into standard droppers, calibrated droppers, child-resistant droppers, tamper-evident droppers, and premium droppers. By capacity, the market includes small (up to 15ml), medium (15ml-30ml), large (30ml-50ml), and extra-large (above 50ml). By end-use application, the market encompasses skincare, makeup, hair care, fragrance, and other applications. Regionally, the market is divided into North America, Europe, Asia Pacific, Latin America, Middle East & Africa, and other regions.
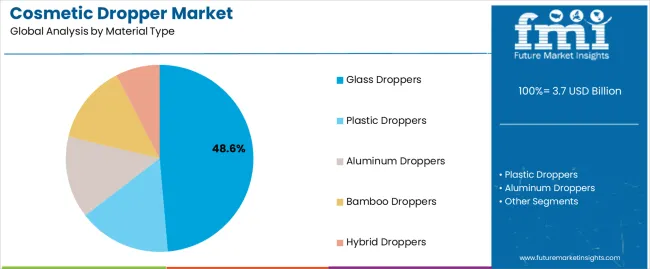
The glass droppers segment is projected to account for 48.6% of the cosmetic dropper market in 2025, reaffirming its position as the leading material category. Beauty brands and cosmetic manufacturers increasingly utilize glass droppers for their superior chemical compatibility characteristics, established premium positioning, and essential functionality in diverse liquid formulations across multiple active ingredient applications. Glass droppers' standardized protection characteristics and proven reliability directly address user requirements for consistent product preservation and optimal packaging value in premium applications.
This material segment forms the foundation of modern cosmetic dropper patterns, as it represents the format with the greatest luxury appeal and established compatibility across multiple skincare formulations. Brand investments in glass refinement and quality standardization continue to strengthen adoption among premium-focused operators. With users prioritizing product purity and aesthetic appeal, glass droppers align with both functional objectives and luxury requirements, making them the central component of comprehensive premium packaging strategies.
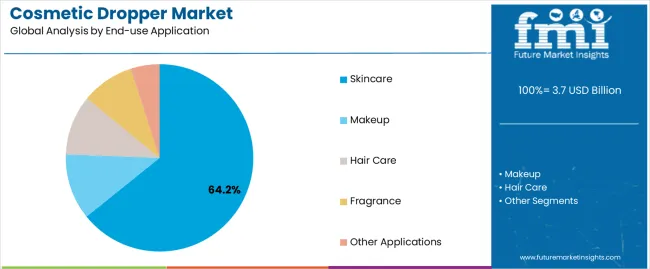
Skincare is projected to represent 64.2% of the cosmetic dropper market in 2025, underscoring its critical role as the primary application for precision-focused brands seeking superior product dispensing benefits and enhanced user convenience credentials. Premium users and beauty brands prefer skincare applications for their established high-value positioning, proven consumer acceptance, and ability to maintain exceptional product profiles while supporting diverse serum offerings during various skincare experiences. Positioned as essential applications for discerning consumers, skincare offerings provide both application precision excellence and premium advantages.
The segment is supported by continuous improvement in dropper technology and the widespread availability of customization options that enable brand distinction and luxury positioning at the consumer level. Packaging companies are optimizing dropper designs to support active ingredient preservation and accessible application strategies. As dropper technology continues to advance and consumers seek precise skincare application formats, skincare applications will continue to drive market growth while supporting product efficacy and user satisfaction strategies.
The cosmetic dropper market is advancing rapidly due to increasing serum product demand and growing need for precision dispensing mechanisms that emphasize superior product preservation outcomes across skincare segments and cosmetic applications. The market faces challenges, including complexity in material compatibility, functionality issues with certain formulations, and cost pressures affecting premium dropper adoption. Innovation in smart dropper systems and antimicrobial coating technologies continues to influence market development and expansion patterns.
The growing adoption of cosmetic droppers in premium skincare packaging is enabling brands to develop product positioning that provides distinctive luxury benefits while commanding consumer confidence and enhanced application precision. Premium skincare applications provide superior dispensing properties while allowing more sophisticated dosage control across various product categories. Users are increasingly recognizing the functional advantages of dropper positioning for precise skincare application and efficacy-conscious beauty routines.
Modern cosmetic dropper manufacturers are incorporating advanced smart technologies, connected dispensing concepts, and digital integration systems to enhance user experience, improve application tracking, and meet commercial demands for interactive beauty solutions. These systems improve user engagement while enabling new applications, including personalized skincare programs and data-driven beauty solutions. Advanced smart integration also allows manufacturers to support connected beauty positioning and digital objectives beyond traditional packaging operations.
| Country | CAGR (2025-2035) |
|---|---|
| USA | 7.2% |
| Germany | 6.8% |
| UK | 6.6% |
| China | 9.4% |
| Japan | 6.9% |
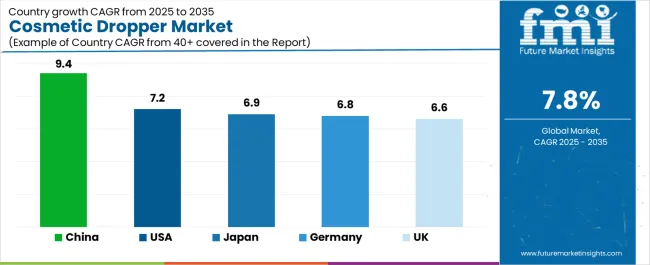
The cosmetic dropper market is experiencing robust growth globally, with China leading at a 9.4% CAGR through 2035, driven by the expanding premium beauty industry, growing skincare consciousness, and increasing adoption of luxury cosmetic products. The USA follows at 7.2%, supported by rising premium skincare demand, expanding beauty innovation, and growing acceptance of advanced dropper solutions. Germany shows growth at 6.8%, emphasizing established packaging capabilities and comprehensive beauty product innovation. The UK records 6.6%, focusing on luxury cosmetic packaging and premium positioning. Japan demonstrates 6.9% growth, prioritizing quality dropper solutions and technological precision.
The report covers an in-depth analysis of 40+ countries, with top-performing countries highlighted below.
Revenue from cosmetic dropper consumption and sales in the USA is projected to exhibit exceptional growth with a CAGR of 7.2% through 2035, driven by the country's rapidly expanding premium skincare sector, favorable consumer attitudes toward luxury packaging, and initiatives promoting innovative dropper mechanisms across major beauty regions. The USA's position as a leading beauty market and increasing focus on skincare-conscious packaging development are creating substantial demand for high-quality cosmetic droppers in both premium and specialty markets. Major beauty brands and cosmetic producers are establishing comprehensive packaging capabilities to serve growing demand and emerging market opportunities.
Demand for cosmetic dropper products in Germany is expanding at a CAGR of 6.8%, supported by rising packaging sophistication, growing beauty product requirements, and expanding manufacturing infrastructure. The country's developing technical capabilities and increasing commercial investment in precision engineering are driving demand for cosmetic droppers across both imported and domestically produced applications. International packaging companies and domestic manufacturers are establishing comprehensive operational networks to address growing market demand for quality beauty droppers and efficient packaging solutions.
Revenue from cosmetic dropper products in the UK is projected to grow at a CAGR of 6.6% through 2035, supported by the country's mature beauty market, established luxury culture, and leadership in premium packaging aesthetics. Britain's sophisticated consumer base and strong support for high-end packaging are creating steady demand for both traditional and innovative cosmetic dropper varieties. Leading beauty brands and specialty manufacturers are establishing comprehensive operational strategies to serve both domestic markets and growing export opportunities.
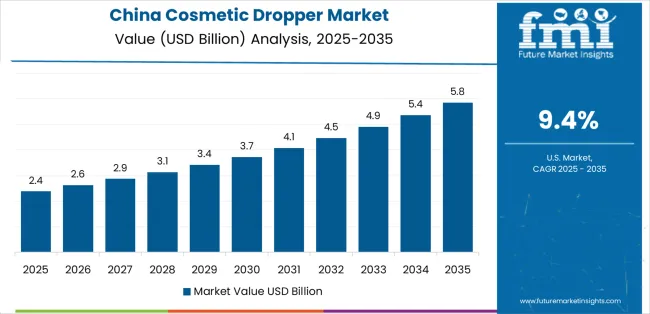
Demand for cosmetic dropper products in China is anticipated to expand at a CAGR of 9.4% through 2035, driven by the country's emphasis on beauty market expansion, manufacturing leadership, and sophisticated production capabilities for droppers requiring specialized precision varieties. Chinese manufacturers and beauty brands consistently seek commercial-grade packaging that enhances product appeal and supports premium positioning for both traditional and innovative consumer applications. The country's position as an Asian manufacturing leader continues to drive innovation in specialty cosmetic dropper applications and commercial production standards.
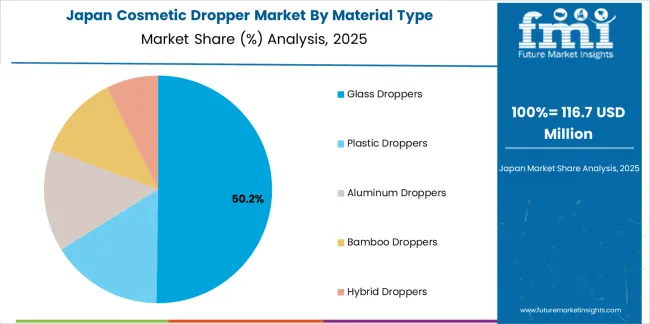
Revenue from cosmetic dropper products in Japan is expected to grow at a CAGR of 6.9% through 2035, supported by the country's emphasis on quality manufacturing, packaging precision, and advanced technology integration requiring efficient dropper solutions. Japanese businesses and beauty brands prioritize dropper reliability and manufacturing precision, making cosmetic droppers essential packaging for both traditional and modern beauty applications. The country's comprehensive quality excellence and advancing packaging patterns support continued market expansion.

The Europe cosmetic dropper market is projected to grow from USD 1.2 billion in 2025 to USD 2.5 billion by 2035, recording a CAGR of 7.6% over the forecast period. Germany leads the region with a 28.5% share in 2025, moderating slightly to 28.0% by 2035, supported by its strong manufacturing base and demand for premium, technically advanced dropper products. The United Kingdom follows with 21.0% in 2025, easing to 20.5% by 2035, driven by a sophisticated beauty market and emphasis on luxury packaging innovation and design excellence. France accounts for 19.5% in 2025, rising to 20.0% by 2035, reflecting steady adoption of premium packaging solutions and beauty product innovation. Italy holds 13.0% in 2025, expanding to 13.5% by 2035 as luxury beauty innovation and specialty dropper applications grow. Spain contributes 9.5% in 2025, growing to 10.0% by 2035, supported by expanding beauty sector and premium cosmetic positioning. The Nordic countries rise from 6.0% in 2025 to 6.2% by 2035 on the back of strong innovation adoption and advanced packaging technologies. BENELUX declines from 2.5% in 2025 to 1.8% by 2035, reflecting market maturity and regional consolidation.
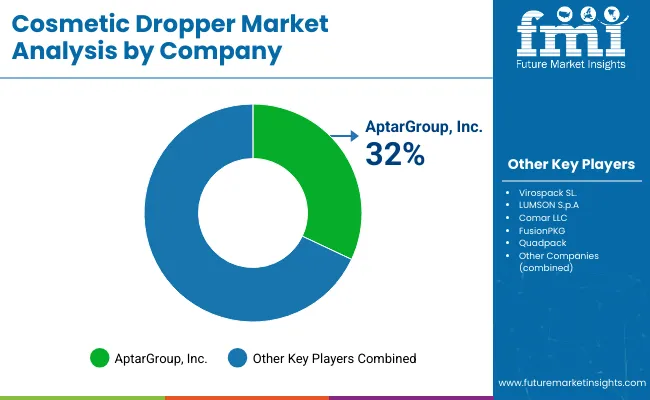
The cosmetic dropper market is characterized by competition among established packaging manufacturers, specialized dropper producers, and integrated beauty packaging solution companies. Companies are investing in precision molding technologies, advanced dispensing mechanism systems, product innovation capabilities, and comprehensive customization networks to deliver consistent, high-quality, and reliable cosmetic dropper systems. Innovation in smart dropper technology, antimicrobial materials, and application-specific product development is central to strengthening market position and customer satisfaction.
Aptar Group leads the market with a strong focus on dropper innovation and comprehensive packaging solutions, offering commercial dropper systems with emphasis on engineering excellence and technological heritage. Albéa Group provides specialized beauty packaging capabilities with a focus on global market applications and dropper engineering networks. Silgan Dispensing delivers integrated packaging solutions with a focus on dropper positioning and operational efficiency. HCP Packaging specializes in comprehensive cosmetic packaging with an emphasis on premium applications. Virospack focuses on luxury beauty droppers with advanced design and premium positioning capabilities.
The success of cosmetic dropper systems in meeting commercial packaging demands, consumer-driven precision requirements, and performance integration will not only enhance beauty product delivery outcomes but also strengthen global beauty packaging manufacturing capabilities. It will consolidate emerging regions' positions as hubs for efficient dropper production and align advanced economies with commercial packaging systems. This calls for a concerted effort by all stakeholders -- governments, industry bodies, manufacturers, distributors, and investors. Each can be a crucial enabler in preparing the market for its next phase of growth.
How Governments Could Spur Local Production and Adoption?
How Industry Bodies Could Support Market Development?
How Distributors and Beauty Industry Players Could Strengthen the Ecosystem?
How Manufacturers Could Navigate the Shift?
| Item | Value |
|---|---|
| Quantitative Units (2025) | USD 3.7 billion |
| Material Type | Glass Droppers; Plastic Droppers; Aluminum Droppers; Bamboo Droppers; Hybrid Droppers |
| Product Type | Standard Droppers; Calibrated Droppers; Child-Resistant Droppers; Tamper-Evident Droppers; Premium Droppers |
| Capacity | Small (up to 15ml); Medium (15ml-30ml); Large (30ml-50ml); Extra-Large (above 50ml) |
| End-Use | Skincare; Makeup; Hair Care; Fragrance; Other Applications |
| Regions | North America; Europe; Asia Pacific; Latin America; Middle East & Africa; Other Regions |
| Key Countries | United States; Germany; United Kingdom; China; Japan; and 40+ additional countries |
| Key Companies | Aptar Group; Albéa Group; Silgan Dispensing; HCP Packaging (profiled); Virospack; Other leading cosmetic dropper companies |
| Additional Attributes | Dollar sales by material type, product type, capacity & end-use; Regional demand trends; Competitive landscape; Technological advancements in dropper engineering; Smart dropper technology integration initiatives; Antimicrobial coating programs; Premium product development strategies |
The global cosmetic dropper market is estimated to be valued at USD 3.7 billion in 2025.
The market size for the cosmetic dropper market is projected to reach USD 7.8 billion by 2035.
The cosmetic dropper market is expected to grow at a 7.8% CAGR between 2025 and 2035.
The key product types in cosmetic dropper market are glass droppers, plastic droppers, aluminum droppers, bamboo droppers and hybrid droppers.
In terms of end-use application, skincare segment to command 64.2% share in the cosmetic dropper market in 2025.


Our Research Products

The "Full Research Suite" delivers actionable market intel, deep dives on markets or technologies, so clients act faster, cut risk, and unlock growth.

The Leaderboard benchmarks and ranks top vendors, classifying them as Established Leaders, Leading Challengers, or Disruptors & Challengers.

Locates where complements amplify value and substitutes erode it, forecasting net impact by horizon

We deliver granular, decision-grade intel: market sizing, 5-year forecasts, pricing, adoption, usage, revenue, and operational KPIs—plus competitor tracking, regulation, and value chains—across 60 countries broadly.

Spot the shifts before they hit your P&L. We track inflection points, adoption curves, pricing moves, and ecosystem plays to show where demand is heading, why it is changing, and what to do next across high-growth markets and disruptive tech

Real-time reads of user behavior. We track shifting priorities, perceptions of today’s and next-gen services, and provider experience, then pace how fast tech moves from trial to adoption, blending buyer, consumer, and channel inputs with social signals (#WhySwitch, #UX).

Partner with our analyst team to build a custom report designed around your business priorities. From analysing market trends to assessing competitors or crafting bespoke datasets, we tailor insights to your needs.
Supplier Intelligence
Discovery & Profiling
Capacity & Footprint
Performance & Risk
Compliance & Governance
Commercial Readiness
Who Supplies Whom
Scorecards & Shortlists
Playbooks & Docs
Category Intelligence
Definition & Scope
Demand & Use Cases
Cost Drivers
Market Structure
Supply Chain Map
Trade & Policy
Operating Norms
Deliverables
Buyer Intelligence
Account Basics
Spend & Scope
Procurement Model
Vendor Requirements
Terms & Policies
Entry Strategy
Pain Points & Triggers
Outputs
Pricing Analysis
Benchmarks
Trends
Should-Cost
Indexation
Landed Cost
Commercial Terms
Deliverables
Brand Analysis
Positioning & Value Prop
Share & Presence
Customer Evidence
Go-to-Market
Digital & Reputation
Compliance & Trust
KPIs & Gaps
Outputs
Full Research Suite comprises of:
Market outlook & trends analysis
Interviews & case studies
Strategic recommendations
Vendor profiles & capabilities analysis
5-year forecasts
8 regions and 60+ country-level data splits
Market segment data splits
12 months of continuous data updates
DELIVERED AS:
PDF EXCEL ONLINE
Market Leaders & Share in the Cosmetic Dropper Industry
Cosmetic Pigment Market Forecast and Outlook 2025 to 2035
Cosmetic Product Packaging Market Size and Share Forecast Outlook 2025 to 2035
Cosmetic Jars Market Size and Share Forecast Outlook 2025 to 2035
Droppers Market Size and Share Forecast Outlook 2025 to 2035
Cosmetic Filling Machines Market Size and Share Forecast Outlook 2025 to 2035
Cosmetic Sucrose Cocoate Market Size and Share Forecast Outlook 2025 to 2035
Dropper System Market Size and Share Forecast Outlook 2025 to 2035
Cosmetic Ingredients For Hair Removal Market Size and Share Forecast Outlook 2025 to 2035
Cosmetic Packaging Market Size and Share Forecast Outlook 2025 to 2035
Cosmetic Plastic Packaging Market Size and Share Forecast Outlook 2025 to 2035
Cosmetic Jar Industry Analysis in North America Size and Share Forecast Outlook 2025 to 2035
Cosmetic Tube Packaging Market Size and Share Forecast Outlook 2025 to 2035
Cosmetic Nanoencapsulation Market Size and Share Forecast Outlook 2025 to 2035
Cosmetic Kaolin Powder Market Size and Share Forecast Outlook 2025 to 2035
Cosmetic Wax Market Size and Share Forecast Outlook 2025 to 2035
Cosmetic Pencil & Pen Market Size and Share Forecast Outlook 2025 to 2035
Cosmetic Implants Market Size and Share Forecast Outlook 2025 to 2035
Cosmetic Tubes Market by Material Type & Application from 2025 to 2035
Cosmetic Chemicals Market Growth - Trends & Forecast 2025 to 2035

Thank you!
You will receive an email from our Business Development Manager. Please be sure to check your SPAM/JUNK folder too.
Chat With
MaRIA